

Physiological consequences of rising water salinity for a declining freshwater turtle
- PMID: 31452893
- PMCID: PMC6702588
- DOI: 10.1093/conphys/coz054
Physiological consequences of rising water salinity for a declining freshwater turtle
Abstract
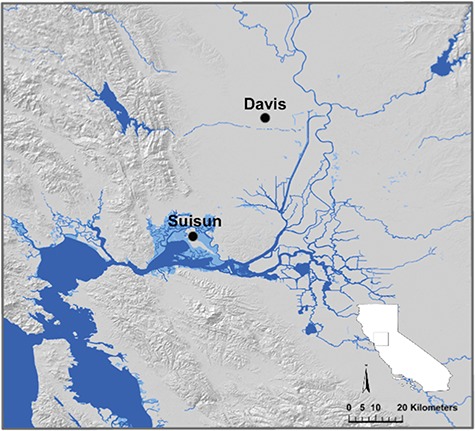
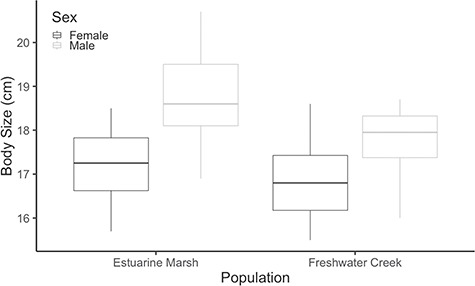
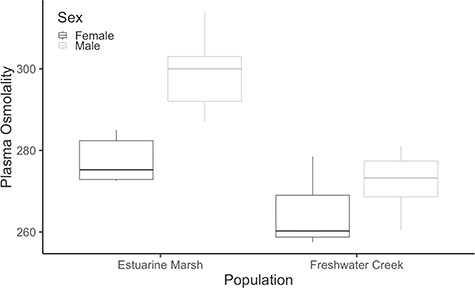
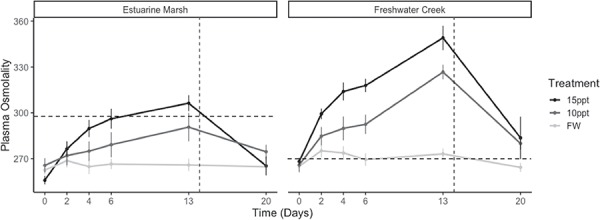
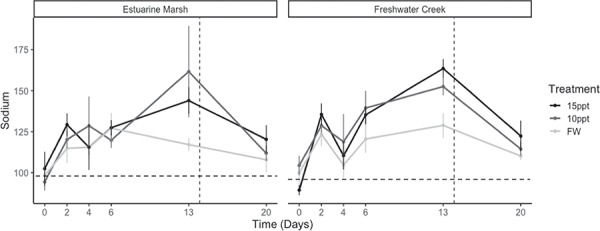
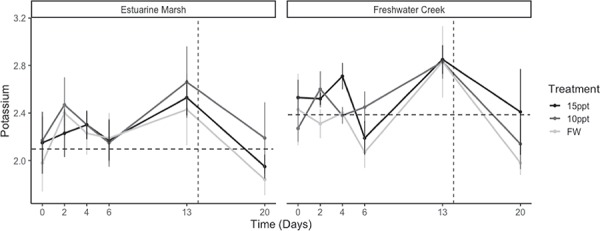
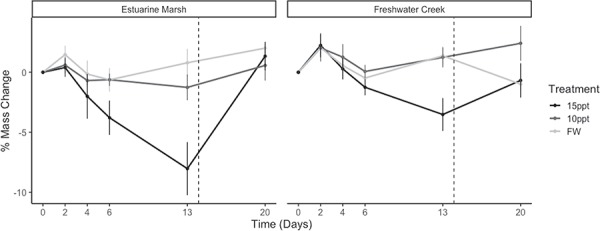
Sea-level rise, drought and water diversion can all lead to rapid salinization of freshwater habitats, especially in coastal areas. Increased water salinities can in turn alter the geographic distribution and ecology of freshwater species including turtles. The physiological consequences of salinization for freshwater turtles, however, are poorly known. Here, we compared the osmoregulatory response of two geographically separate populations of the freshwater Western Pond Turtle (Actinemys marmorata)-a species declining across its range in western North America-to three constant salinities: 0.4 ppt, 10 ppt and 15 ppt over 2 weeks. We found that turtles from a coastal estuarine marsh population regulated their plasma osmolality at lower levels than their conspecifics from an inland freshwater creek population 45 km away. Plasma osmolalities were consistently lower in estuarine marsh turtles than the freshwater creek turtles over the entire 2-week exposure to 10 ppt and 15 ppt water. Furthermore, estuarine marsh turtles maintained plasma osmolalities within 1 SD of their mean field osmolalities over the 2-week exposure, whereas freshwater creek turtles exceeded their field values within the first few days after exposure to elevated salinities. However, individuals from both populations exhibited body mass loss in 15 ppt water, with significantly greater loss in estuarine turtles. We speculate that the greater ability to osmoregulate by the estuarine marsh turtles may be explained by their reduced feeding and drinking in elevated salinities that was not exhibited by the freshwater creek population. However, due to mass loss in both populations, physiological and behavioural responses exhibited by estuarine marsh turtles may only be effective adaptations for short-term exposures to elevated salinities, such as those from tides and when traversing saline habitats, and are unlikely to be effective for long-term exposure to elevated salinity as is expected under sea-level rise.
Keywords: Freshwater turtles; osmoregulation; salinity; sea-level rise.
Figures
Similar articles
-
Salinity tolerances and use of saline environments by freshwater turtles: implications of sea level rise.Biol Rev Camb Philos Soc. 2018 Aug;93(3):1634-1648. doi: 10.1111/brv.12410. Epub 2018 Mar 25. Biol Rev Camb Philos Soc. 2018. PMID: 29575680 Review.
-
Brackish Tidal Marsh Management and the Ecology of a Declining Freshwater Turtle.Environ Manage. 2020 Oct;66(4):644-653. doi: 10.1007/s00267-020-01326-0. Epub 2020 Jul 10. Environ Manage. 2020. PMID: 32651626
-
Impact of environmental salinity on the MAPK-NFAT5 pathway in Trachemys scripta elegans and its role in osmoregulaton.Comp Biochem Physiol C Toxicol Pharmacol. 2025 Aug;294:110201. doi: 10.1016/j.cbpc.2025.110201. Epub 2025 Mar 31. Comp Biochem Physiol C Toxicol Pharmacol. 2025. PMID: 40174736
-
Salinity tolerances of two Australian freshwater turtles, Chelodina expansa and Emydura macquarii (Testudinata: Chelidae).Conserv Physiol. 2016 Oct 15;4(1):cow042. doi: 10.1093/conphys/cow042. eCollection 2016. Conserv Physiol. 2016. PMID: 27757236 Free PMC article.
-
The ecology of overwintering among turtles: where turtles overwinter and its consequences.Biol Rev Camb Philos Soc. 2006 Aug;81(3):339-67. doi: 10.1017/S1464793106007032. Epub 2006 May 15. Biol Rev Camb Philos Soc. 2006. PMID: 16700968 Review.
Cited by
-
Osmoregulation in the estuarine diamond-backed terrapin across a broad range of naturally occurring salinities.Biol Open. 2025 Jun 15;14(6):bio062072. doi: 10.1242/bio.062072. Epub 2025 Jun 30. Biol Open. 2025. PMID: 40485507 Free PMC article.
-
Effects of the environment on the evolution of the vertebrate urinary tract.Nat Rev Urol. 2023 Dec;20(12):719-738. doi: 10.1038/s41585-023-00794-3. Epub 2023 Jul 13. Nat Rev Urol. 2023. PMID: 37443264 Review.
References
-
- Ackerly D, Jones A, Stacey M, Riordan B (2018) San Francisco Bay Area Summary Report California’s Fourth Climate Change Assessment. Publication number: CCCA4-SUM-2018-005 http://www.climateassessment.ca.gov/.
-
- Agha M, Ennen JR, Bower DS, Nowakowski AJ, Sweat SC, Todd BD (2018) Salinity tolerances and use of saline environments by freshwater turtles: implications of sea level rise. Biol Rev 93: 1634–1648. - PubMed
-
- Bay-Delta Live (2018) https://www.baydeltalive.com. (last accessed 2 January 2019)
-
- Bentley PJ, Bretz WL, Schmidt-Nielsen K (1967) Osmoregulation in the diamondback terrapin, Malaclemys terrapin centrata. J Exp Biol 46: 161. - PubMed
