. 2019 Aug 19:5:130.
doi: 10.1038/s41420-019-0210-6. eCollection 2019.

Buffering of cytosolic calcium plays a neuroprotective role by preserving the autophagy-lysosome pathway during MPP+-induced neuronal death

Affiliations

Buffering of cytosolic calcium plays a neuroprotective role by preserving the autophagy-lysosome pathway during MPP+-induced neuronal death

Shinae Jung et al. Cell Death Discov. .

Abstract

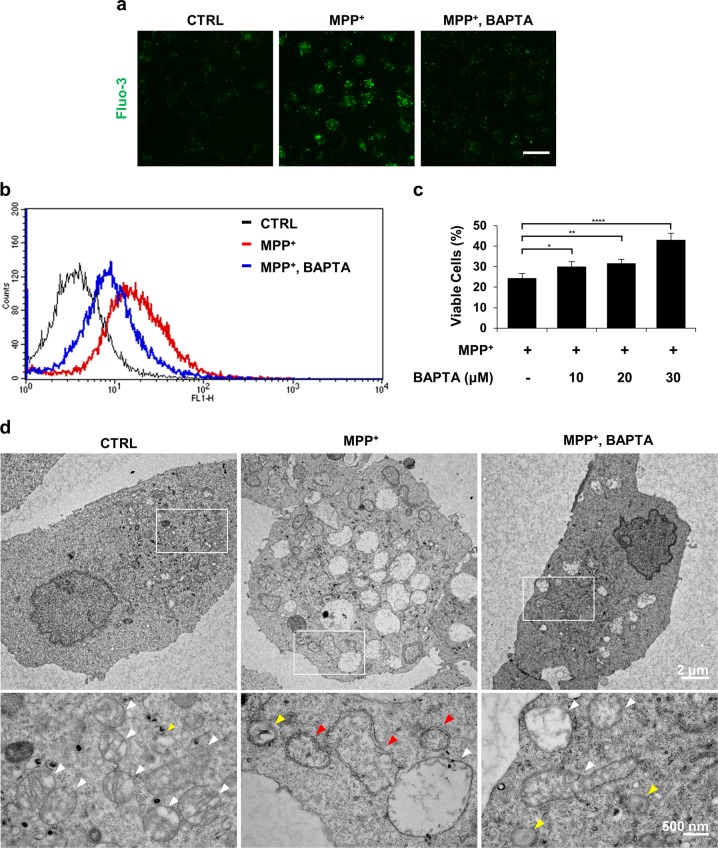
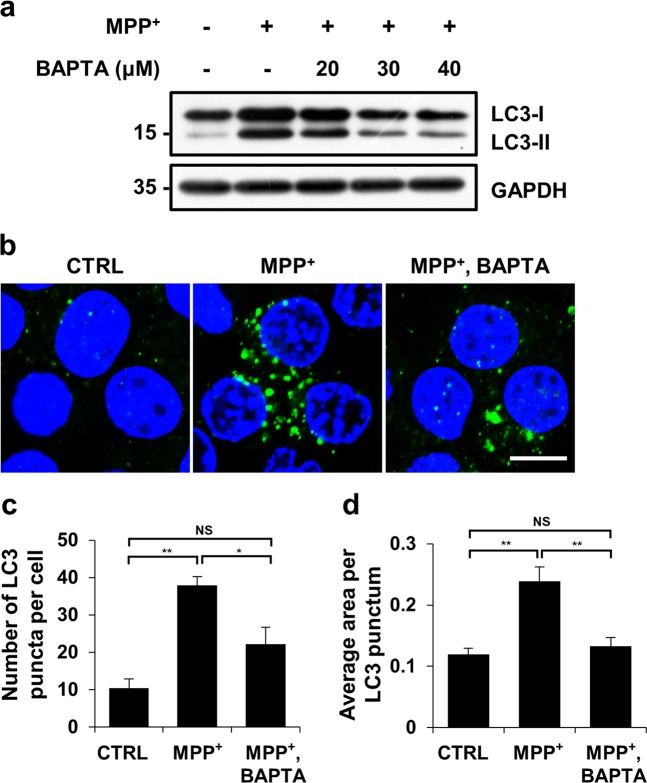
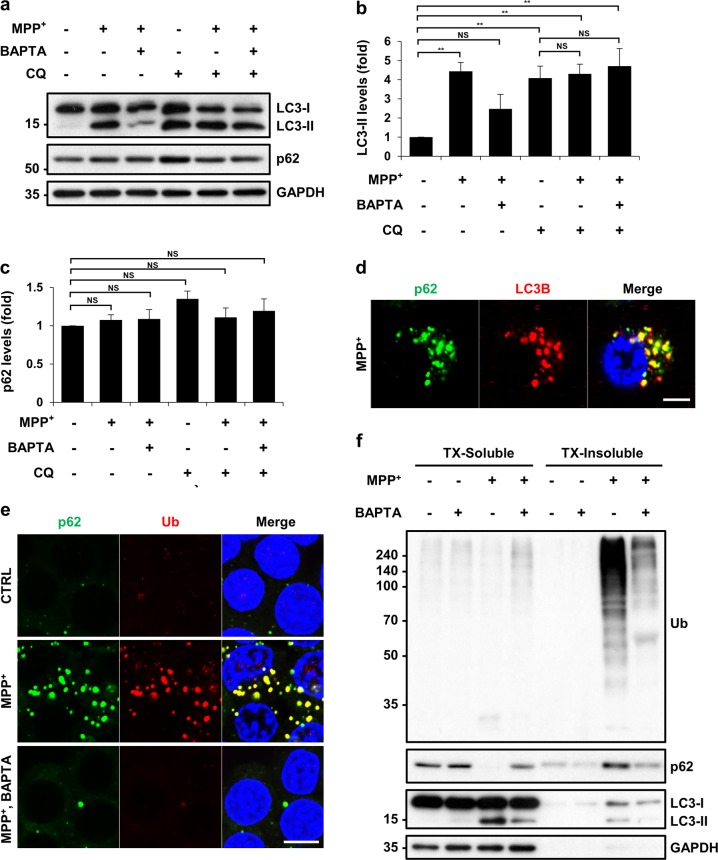
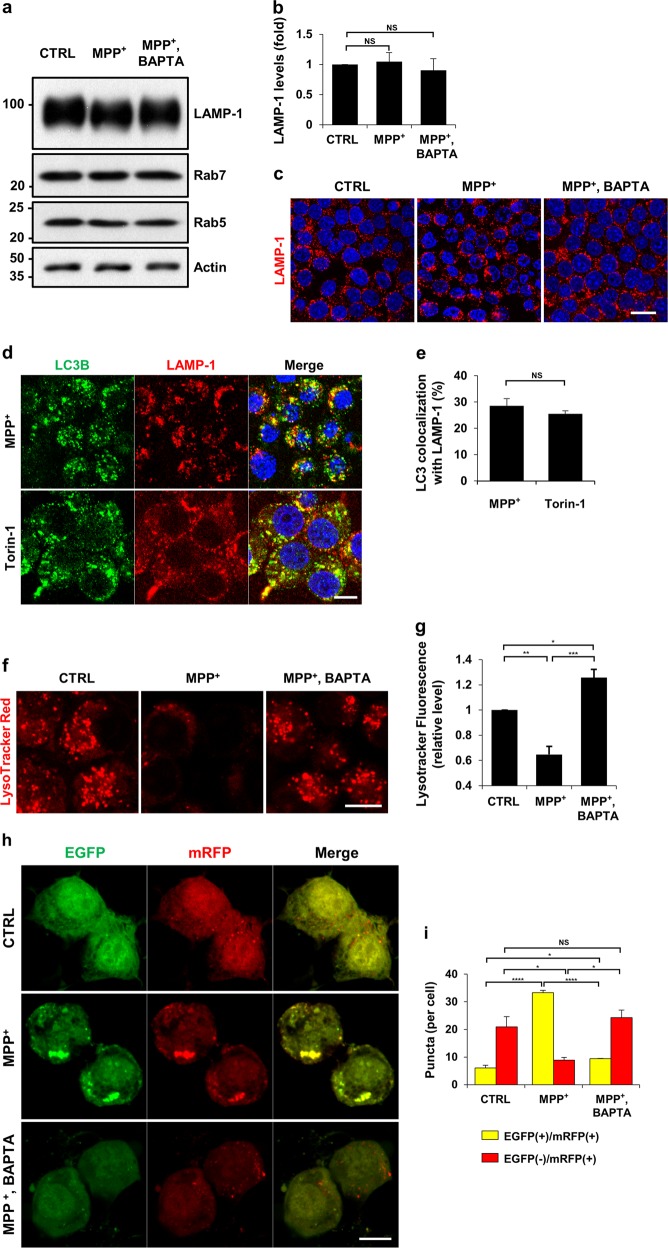
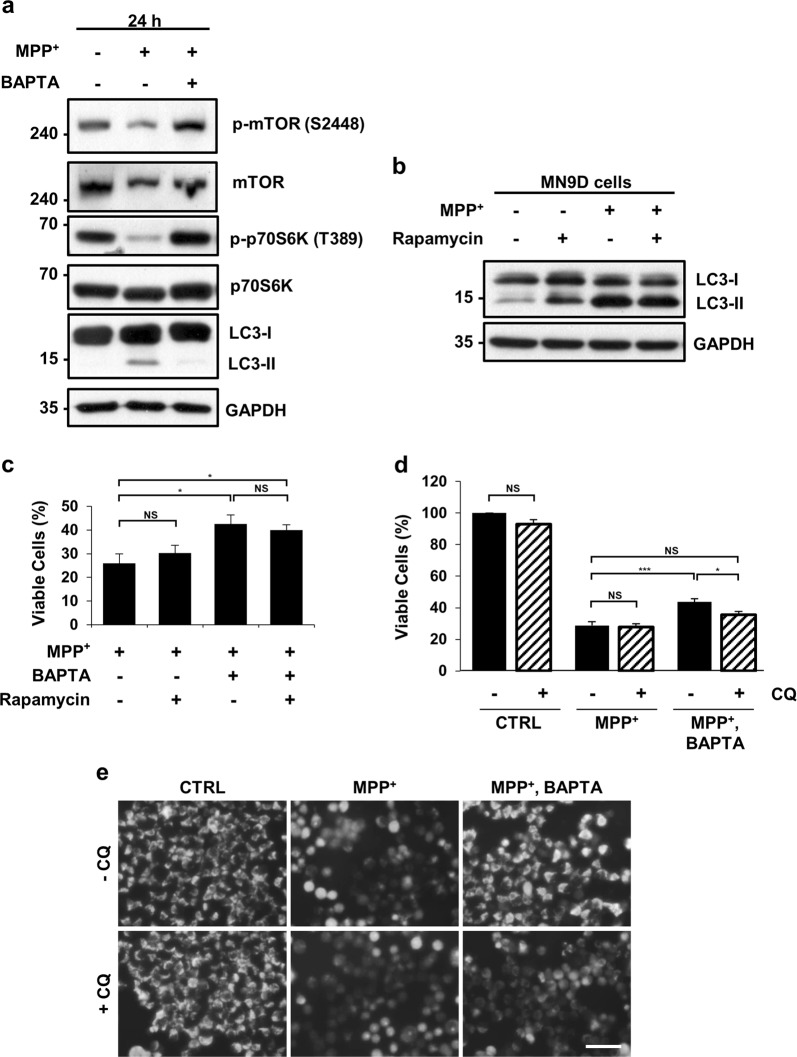
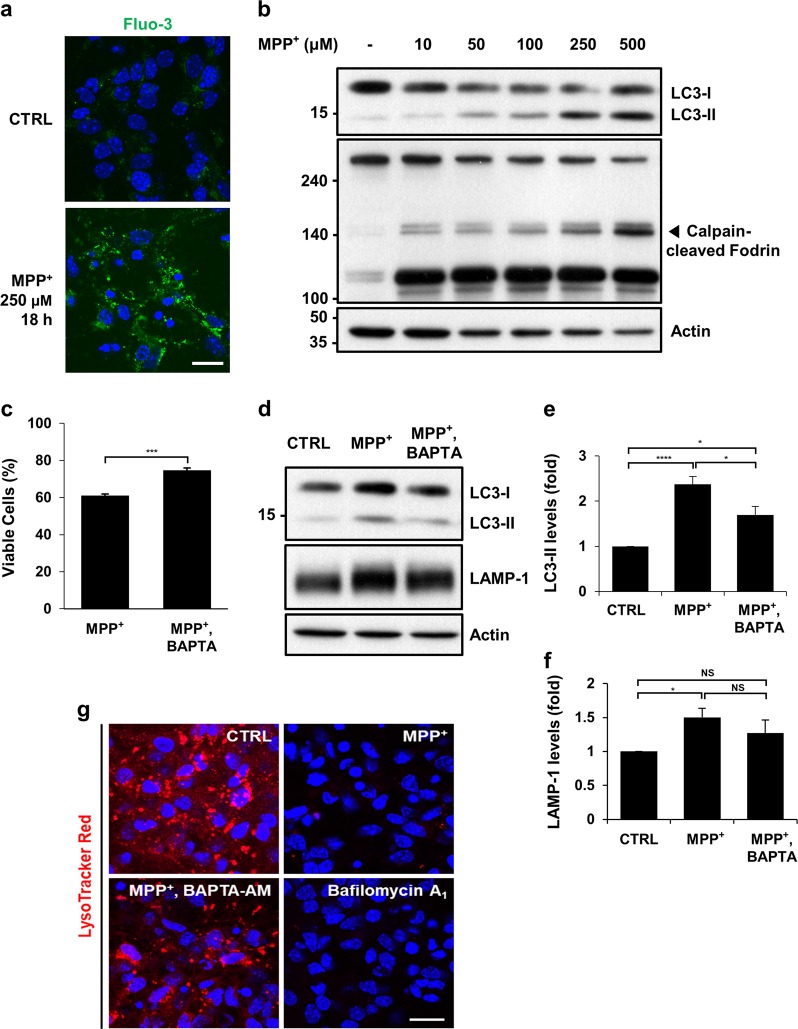
Parkinson's disease (PD) is a chronic neurodegenerative disease with no cure. Calbindin, a Ca2+-buffering protein, has been suggested to have a neuroprotective effect in the brain tissues of PD patients and in experimental models of PD. However, the underlying mechanisms remain elusive. Here, we report that in 1-methyl-4-phenylpyridinium (MPP+)-induced culture models of PD, the buffering of cytosolic Ca2+ by calbindin-D28 overexpression or treatment with a chemical Ca2+ chelator reversed impaired autophagic flux, protecting cells against MPP+-mediated neurotoxicity. When cytosolic Ca2+ overload caused by MPP+ was ameliorated, the MPP+-induced accumulation of autophagosomes decreased and the autophagic flux significantly increased. In addition, the accumulation of damaged mitochondria and p62-positive ubiquitinated protein aggregates, following MPP+ intoxication, was alleviated by cytosolic Ca2+ buffering. We showed that MPP+ treatment suppressed autophagic degradation via raising the lysosomal pH and therefore reducing cytosolic Ca2+ elevation restored the lysosomal pH acidity and normal autophagic flux. These results support the notion that functional lysosomes are required for Ca2+-mediated cell protection against MPP+-mediated neurotoxicity. Thus, our data suggest a novel process in which the modulation of Ca2+ confers neuroprotection via the autophagy-lysosome pathway. This may have implications for the pathogenesis and future therapeutic targets of PD.

Keywords: Cell death in the nervous system; Neurological disorders.


Conflict of interest statement

Conflict of interestThe authors declare that they have no conflict of interest.

Figures

Fig. 1
Fig. 1. Buffering of cytosolic calcium attenuates MPP+-mediated toxicity in MN9D cells.
ad MN9D cells were treated with vehicle (control, CTRL) or 50 μM MPP+ in the presence or absence of 30 μM BAPTA-AM for 30 h. a MN9D cells were stained with 3 µM Fluo-3. A representative image of cells was taken using confocal microscopy after fixation. The scale bar represents 20 μm. b Cytosolic Ca2+ levels were assessed using flow cytometry. c MTT reduction assays were performed to assess cell viability that is expressed as a percentage of untreated control cells (100%). Bars represent the mean ± SEM of three independent experiments in triplicate. *p < 0.05; **p < 0.01; ****p < 0.0001. d Electron micrographs of MN9D cells were taken after drug treatment. Lower panels are magnified images from the boxed areas. Mitochondria (white arrowheads), lysosomes (yellow arrowheads) and autophagosomes (red arrowheads) are indicated
Fig. 2
Fig. 2. Reducing cytosolic calcium elevation suppresses the appearance of LC-3-positive autophagosomes caused by MPP+ treatment.
MN9D cells were treated with 50 μM MPP+ in the presence or absence of the indicated concentrations of BAPTA-AM for 30 h. a Cell lysates were subjected to immunoblot analyses using the anti-LC3 antibody. Anti-GAPDH antibody was used as a loading control. bd Immunocytochemical analyses were performed using an anti-LC3 antibody (green) and nuclei counterstaining with Hoechst 33258 (blue). b Cells were then examined using a confocal microscope. Merged images are provided. The scale bar represents 10 μm. The number of LC3 puncta per cell (c) and average puncta area of LC3 (d) were quantified using ImageJ after examining 90 cells per condition. The bar represents the mean ± SEM of three independent experiments. *p < 0.05; **p < 0.01; NS, not significant
Fig. 3
Fig. 3. MPP+ blocks autophagic flux as determined by an elevated calcium-dependent accumulation of insoluble p62 and Ub-positive spots.
MN9D cells were treated with 50 μM MPP+ in the presence or absence of 30 μM BAPTA-AM and/or 50 μM chloroquine (CQ) for 30 h. a Immunoblot analyses were performed using the anti-LC3 or anti-p62 antibody. b, c Quantification of LC3-II and p62 levels in each condition was performed after normalization to GAPDH loading control. Bars represent the mean ± SEM of three independent experiments. **p < 0.01; NS, not significant. After MPP+ treatment alone (d) or in combination with BAPTA-AM (e), cells were analyzed for the immunofluorescent localization of p62 (green) and LC3B (red) or ubiquitin (Ub; red). Cells were then examined using a confocal microscope. Merged views are provided in the right panel. The scale bar represents (d) 5 μm and (e) 10 μm. f A representative immunoblot analyses of p62, ubiquitin, and LC3 in Triton X-100 (TX)-soluble or TX-insoluble fractions
Fig. 4
Fig. 4. MPP+-induced impairment of autophagic degradation results from lysosomal malfunction in a calcium-dependent manner.
ac MN9D cells were treated with 50 μM MPP+ alone or in combination with 30 μM BAPTA-AM for 30 h. a Cell lysates were subjected to immunoblot analyses with the indicated antibodies. b Quantification of LAMP-1 expression was performed after normalization to actin loading control. Bars represent the mean ± SEM of three independent experiments. NS, not significant. c After drug treatment, cells were immunostained with anti-LAMP-1 antibody. Representative confocal images are provided. Scale bar represents 20 μm. d, e MN9D cells were incubated with 50 μM MPP+ for 30 h or 500 nM Torin-1 for 24 h and then immunostained using anti-LC3 and anti-LAMP-1 antibodies. The scale bar represents 10 μm. e Co-localization of LC3 with LAMP-1 in cells was quantified using ImageJ. Confocal images of at least 30 randomly selected cells from each of the three independent experiments were used for quantitation. Spots that were positive for both LC-3 and LAMP-1 were counted and expressed as a percentage of all LC3-positive spots (100%). Bars represent the mean ± SEM of three independent experiments. NS, not significant. f, g MN9D cells that were treated with 50 μM MPP+ alone or in combination with 30 μM BAPTA-AM for 30 h were stained with LysoTracker Red. Representative confocal images are provided. The scale bar represents 10 μm. g For quantitation, cells were subjected to flow cytometry. Data represent the fluorescence intensity relative to that of control cells (value = 1). Bar represents the mean ± SEM of three independent experiments. *p < 0.05; **p < 0.01; ***p < 0.001. h MN9D cells were transfected with mRFP-EGFP-tagged LC3B probe for 24 h and treated with 50 μM MPP+ alone or in combination with 30 μM BAPTA-AM for 30 h. After fixation, fluorescent images were acquired using confocal microscopy. The scale bar represents 10 μm. i Quantification of the number of yellow puncta (mRFP+-EGFP+-LC3B) and red puncta (mRFP+-EGFP-LC3B) were performed using at least 50 cells per condition. Bar represents the mean ± SEM of three independent experiments. *p < 0.05; ****p < 0.0001; NS, not significant
Fig. 5
Fig. 5. Lysosomal activity is essential for calcium-mediated cell protection against MPP+ toxicity.
a MN9D cells were treated with 50 μM MPP+ in the presence or absence of 30 μM BAPTA-AM for 24 h. Cell lysates were subjected to immunoblot analyses using the indicated antibodies. Representative blots are provided. MN9D cells were treated with 50 μM MPP+ in the presence or absence of 30 μM BAPTA-AM plus b, c 750 nM rapamycin or d, e 50 μM CQ for 30 h. (b) LC3-II levels were detected by immunoblotting with anti-LC3B antibodies. c, d MTT reduction assays were performed to assess cell viability expressed as a percentage of the untreated control cells (100%). Bars represent the mean ± SEM of three independent experiments in triplicate. *p < 0.05; ***p < 0.001; NS, not significant. e After treatment with the indicated combination of drugs, MN9D cells were stained with 0.75 μM MitoTracker Red CMXRos and imaged using fluorescence microscopy. The scale bar represents 200 μm
Fig. 6
Fig. 6. Buffering of cytosolic calcium suppresses cell death, LC3-II accumulation and lysosomal pH elevation in MPP+-treated cortical neurons.
a Primary cultures of cortical neurons prepared from the cortices of E14.5 mouse embryos were treated with or without 250 μM MPP+ for 18 h. Cells were then loaded with 3 µM Fluo-3 and subjected to counterstaining with Hoechst dye. Fluorescent images were taken using a confocal microscopy. The scale bar represents 20 μm. b Cortical neurons were incubated with the indicated concentrations of MPP+ for 24 h. Cell lysates were subjected to immunoblot analyses using anti-LC3 or anti-fodrin antibody. Anti-actin antibody was used as a loading control. cg Cortical neurons were treated with 250 μM MPP+ alone in combination with 0.5 μM BAPTA-AM for 18 h. c Cells were subjected to the MTT assay. Cell viability was expressed as a percentage of MPP+- treated cells compared to the untreated control cells (100%). Bar represents the mean ± SEM of three independent experiments in triplicate. ***p < 0.001. df Cell lysates were analyzed using immunoblotting with anti-LC3 or anti-LAMP-1 antibodies. The intensity of (e) LC3-II signals or (f) LAMP-1 from each condition was densitometrically measured using Image J. After normalization to the intensity of the actin signal, values were expressed as a fold change relative to the untreated control (value = 1). Bars represent the mean ± SEM of four independent experiments. *p < 0.05; ****p < 0.0001; NS, not significant. g Cortical neurons were treated with the indicated drugs. For comparison, cells were treated with 10 nM bafilomycin A1 for 4 h, stained with LysoTracker Red, and counterstained with Hoechst dye. Cells were then imaged using confocal microscopy. Representative fluorescent images are provided. The scale bar represents 20 μm

Similar articles

Cited by

References

    1. Jankovic J. Parkinson’s disease: clinical features and diagnosis. J. Neurol., Neurosurg., Psychiatry. 2008;79:368–376. doi: 10.1136/jnnp.2007.131045. - DOI - PubMed
    1. Dauer W, Przedborski S. Parkinson’s disease: mechanisms and models. Neuron. 2003;39:889–909. doi: 10.1016/S0896-6273(03)00568-3. - DOI - PubMed
    1. Thomas B, Beal MF. Parkinson’s disease. Hum. Mol. Genet. 2007;2:R183–R194. doi: 10.1093/hmg/ddm159. - DOI - PubMed
    1. Olanow CW. The pathogenesis of cell death in Parkinson’s disease–2007. Mov. Disord.: Off. J. Mov. Disord. Soc. 2007;22(Suppl 17):S335–S342. doi: 10.1002/mds.21675. - DOI - PubMed
    1. Corti O, Lesage S, Brice A. What genetics tells us about the causes and mechanisms of Parkinson’s disease. Physiol. Rev. 2011;91:1161–1218. doi: 10.1152/physrev.00022.2010. - DOI - PubMed