

doi: 10.1364/BOE.10.004075.
eCollection 2019 Aug 1.
Review of micro-optical sectioning tomography (MOST): technology and applications for whole-brain optical imaging [Invited]
Affiliations
- PMID: 31452996
- PMCID: PMC6701528
- DOI: 10.1364/BOE.10.004075
Item in Clipboard
Review of micro-optical sectioning tomography (MOST): technology and applications for whole-brain optical imaging [Invited]
Biomed Opt Express.
.
Abstract
Elucidating connectivity and functionality at the whole-brain level is one of the most challenging research goals in neuroscience. Various whole-brain optical imaging technologies with submicron lateral resolution have been developed to reveal the fine structures of brain-wide neural and vascular networks at the mesoscopic level. Among them, micro-optical sectioning tomography (MOST) is attracting increasing attention, as a variety of technological variations and solutions tailored toward different biological applications have been optimized. Here, we summarize the recent development of MOST technology in whole-brain imaging and anticipate future improvements.
Conflict of interest statement
The authors declare no conflicts of interest.
Figures
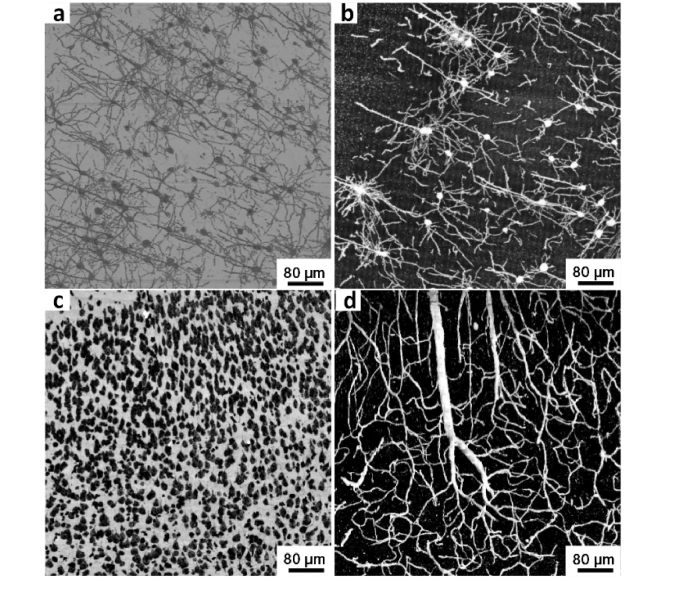
Conventional staining of brain tissue. (a, b) 50-μm-thick maximum intensity projections of Golgi-stained layer 2−3 neurons in primary auditory cortex in two-month-old male C57 mouse brains, acquired via MOST and dual-mode MOST at voxel resolutions of 0.35 × 0.35 × 1 μm and 0.32 × 0.32 × 1 μm, respectively. (c, d) 100-μm-thick minimal and maximum intensity projections of the same Nissl-stained mouse brain.
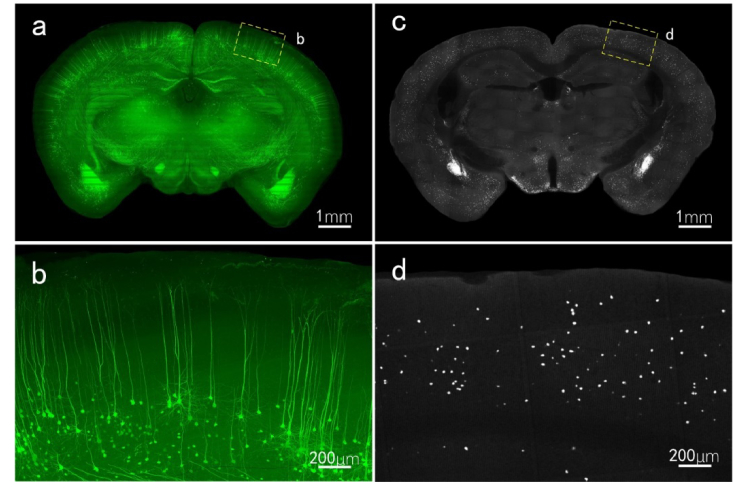
Mouse brains genetically targeted for labeling. (a) Image of hippocampus coronal plane of Thy1-green fluorescent protein (GFP) mouse brain. The projection thickness is 600 μm. (b) Enlarged view of dotted box in (a). (c) Coronal images of hippocampus of SOM-IRES-Cre:Ai3-EYFP mouse brain. The projection thickness is 10 μm. (d) Enlarged view of dotted box in (c).
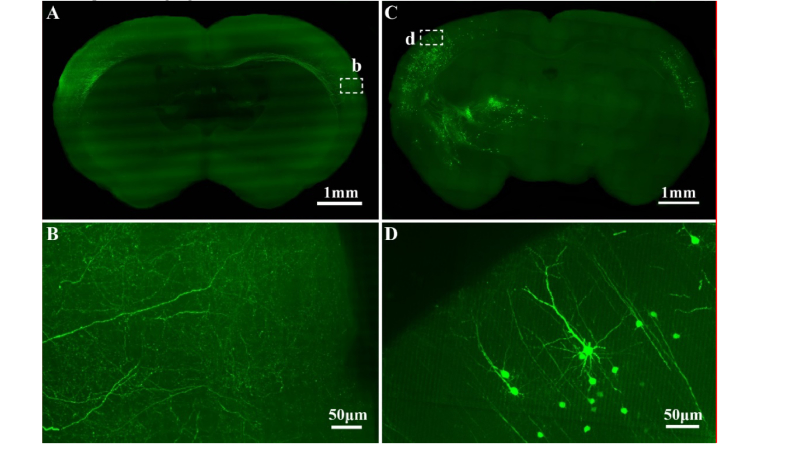
Virus-labeled input and output of Thy1 pyramidal neurons in somatosensory cortex (S2) area of mouse brain. (a) Thy1 pyramidal neuron output in S2 near injection site and (b) details of projected nerve fibers on opposite side of injection site. (c) Input distribution of Thy1 pyramidal neurons in S2 in hippocampus coronal plane and (d) enlarged view of white dotted box in (c).
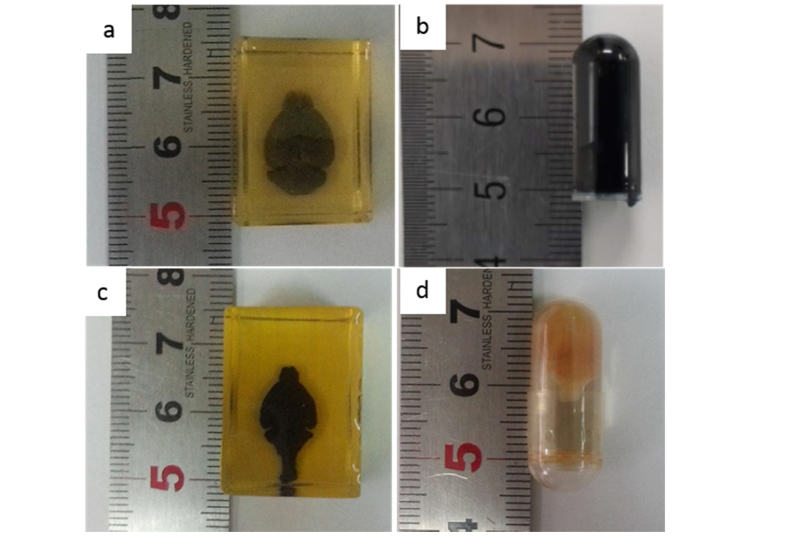
Resin-embedded mice brains .Golgi-stained mouse brains (a) in Spurr resin. (c) Nissl-stained mouse brain in Spurr resin. Fluorescence-labeled mouse brain in GMA resin (b) and HM20 resin (d).
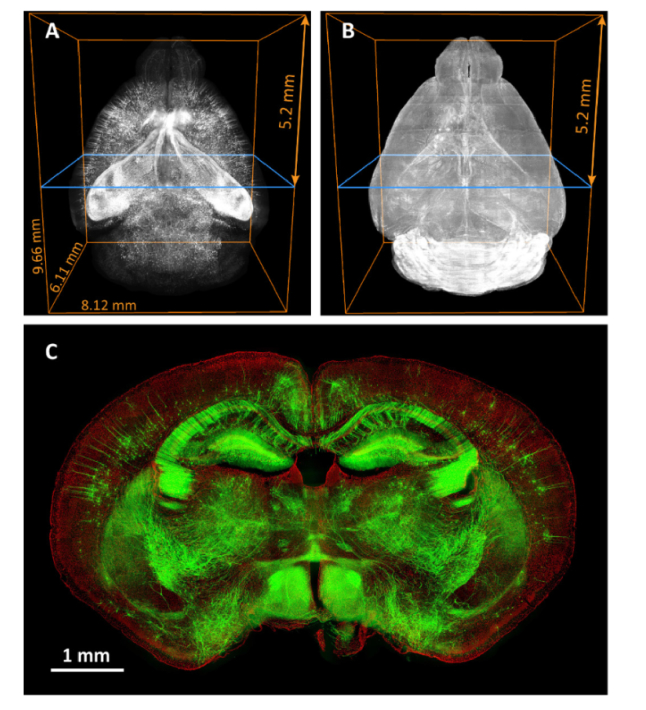
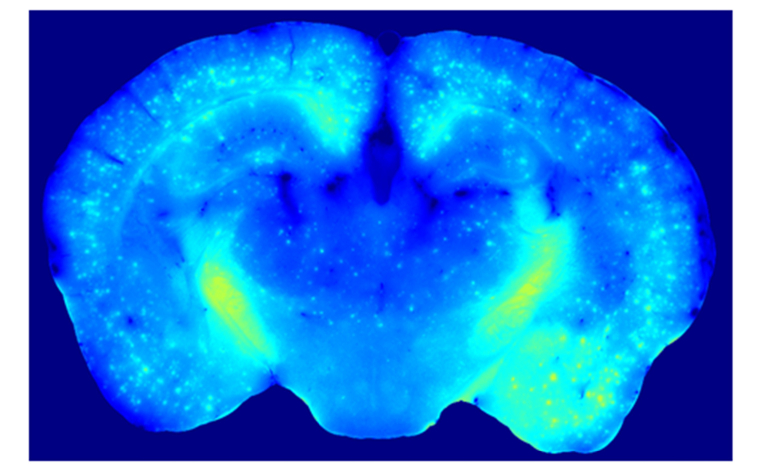
Visualization of Thy1-GFP mouse brain using fMOST. (a) Top view of GFP expression. (b) Top view of propidium iodide (PI)-counterstained cytoarchitecture. (c) Merged images of GFP-labeled neurons (green) and PI-stained cells (red).
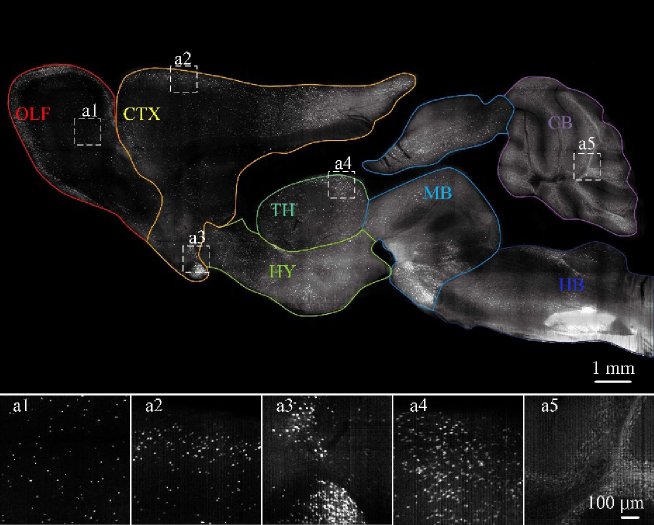
Sagittal reconstruction of maximum intensity projections of CRH-IRES-Cre:Ai3-EYFP mouse brain. The projection thickness is 100 μm. (a1)–(a5) Enlarged views of white square boxes in sagittal image. The dimensions of (a1)–(a5) are 496 × 496 × 100 μm3.
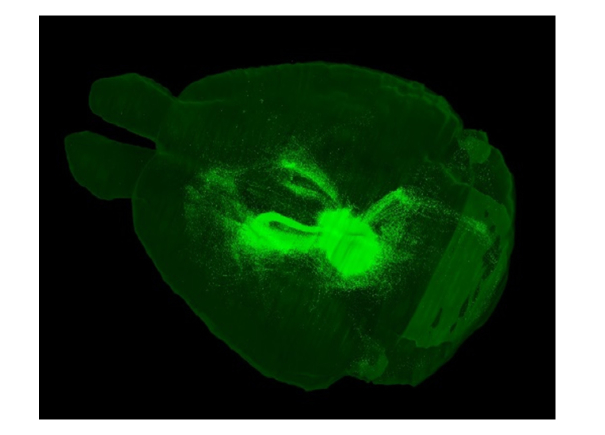
Dorsal view of 3D reconstruction of brain-wide projection labeled with AAV vectors expressing GFP and imaged by 2p-fMOST.
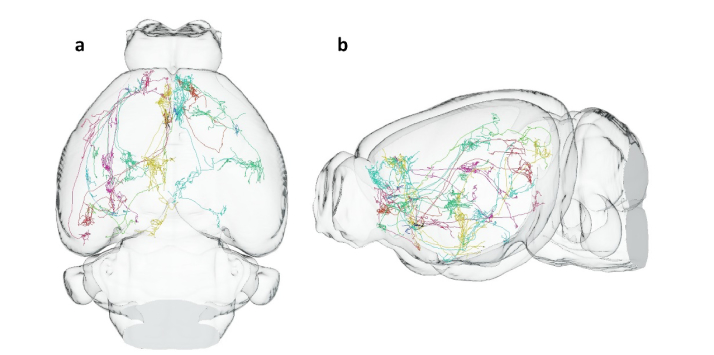
Morphological reconstructions of individual pyramidal neurons. Different colors represent different cells: (a) top view, (b) sagittal view.
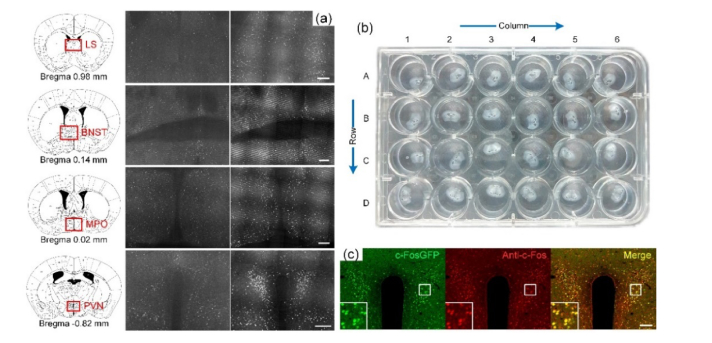
c-Fos expression changes after foot shock stress modeling. (a) Significant changes in c-Fos expression levels in main brain areas. The middle and right columns show the groups without and with foot shock treatment, respectively. The left column shows the corresponding brain areas. Brain areas: LS, lateral septal nucleus, BNST, bed nucleus of the stria terminalis, MPO, medial preoptic nucleus, PVN, paraventricular hypothalamic nucleus, CEA, central amygdaloid nucleus (b) Automatic storage of imaged tissue slices in perforated plate. (c) Anti-c-Fos immunostaining result for paraventricular hypothalamic nucleus. The scale bars in (a) and (c) are 200 and 100 μm, respectively.
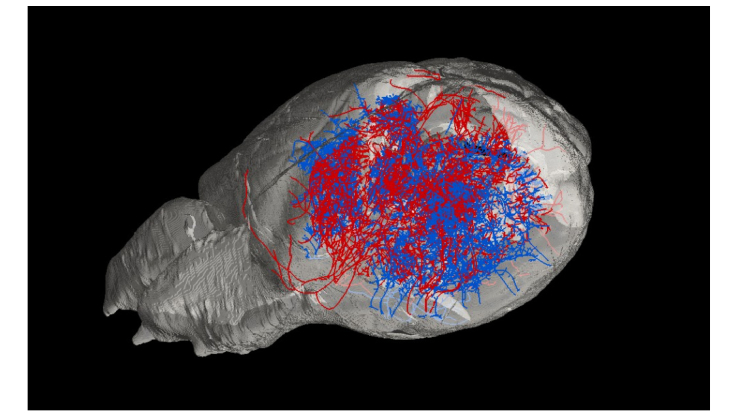
Dorsalateral view of vascular network in Nissl-stained mouse brain. Red and blue represent arterial and venous networks, respectively.
Senile plaque distribution in hippocampus acquired by cryo-MOST.
References
-
- Luo Q., “Brainsmatics—bridging the brain science and brain-inspired artificial intelligence,” Scientia Sinica (Vitae) 47(10), 1015 (2017). 10.1360/N052017-00094 - DOI
LinkOut - more resources
Full Text Sources