. 2019 Jul 26;10(8):4207-4219.
doi: 10.1364/BOE.10.004207. eCollection 2019 Aug 1.

Analysis of low-scattering regions in optical coherence tomography: applications to neurography and lymphangiography

Affiliations

Analysis of low-scattering regions in optical coherence tomography: applications to neurography and lymphangiography

Valentin Demidov et al. Biomed Opt Express. .

Abstract

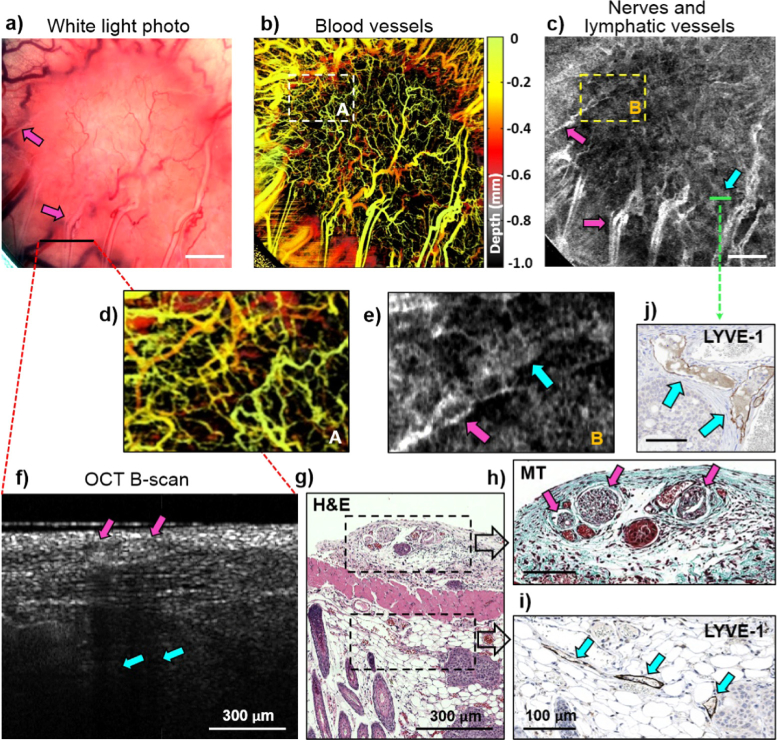
Analysis of semi-transparent low scattering biological structures in optical coherence tomography (OCT) has been actively pursued in the context of lymphatic imaging, with most approaches relying on the relative absence of signal as a means of detection. Here we present an alternate methodology based on spatial speckle statistics, utilizing the similarity of a distribution of given voxel intensities to the power distribution function of pure noise, to visualize the low-scattering biological structures of interest. In a human tumor xenograft murine model, we show that these correspond to lymphatic vessels and nerves; extensive histopathologic validation studies are reported to unequivocally establish this correspondence. The emerging possibility of OCT lymphangiography and neurography is novel and potentially impactful (especially the latter), although further methodology refinement is needed to distinguish between the visualized lymphatics and nerves.


Conflict of interest statement

The authors declare that there are no conflicts of interest related to this article.

Figures

Fig. 1.
Fig. 1.
Schematic diagram of the swept-source OCT system setup with quadrature Mach-Zehnder fiber-based interferometer and optical amplification: SOA - semiconductor optical amplifier, PC - polarization controller, A - fiber attenuator, DB - dual balanced photo-detector, DAQ - data acquisition card, C - collimator, MZ Interferometer - Mach-Zehnder interferometer, M - mirror. SGx and SGy - scanning mirrors driven by galvanometers in x and y lateral dimensions, CR - circulator, L - lens. Red lines represent optical paths, blue lines are electrical signals.
Fig. 2.
Fig. 2.
Speckle statistical data analysis of OCT images. (a) White-light photo of a mouse with installed dorsal skin window chamber; (b) The photo of the chamber with grown pancreatic adenocarcinoma tumor. Blue line indicates the location of (c) the structural OCT image. ROI1 – deep location (noise area), ROI2 - solid tumor tissue, ROI3 - lymphatic vessel lumen; (d) Speckle statistics for OCT signal noise: left and right are statistics for detection channels |Q1| and |Q2| used to form full complex signal S. DB – dual balanced photo-detector (for details see Fig. 1); (e) Speckle statistics of the noise speckle amplitudes A in ROI1, well described by the Rayleigh distribution (R2 = 0.9996); (f) Speckle statistics of the signal-rich tumor tissue in ROI2, displaying a poorer Rayleigh fit (R2 = 0.82); (g) Speckle statistics of the lymphatic vessel lumen in ROI3, showing closer-to-noise goodness of fit (R2 = 0.98). Red curves correspond to Gaussian fit for (d), and Rayleigh fit for (e), (f) and (g).
Fig. 3.
Fig. 3.
Simultaneous mapping of low-scattering tissues by spatial speckle filtering and of blood vessels by temporal speckle variance methods. (a) The white light photo of a pancreatic adenocarcinoma tumor grown in a window chamber model; (b) N = 24 OCT B-scans from the same lateral location within the scanned volume. Scale bar is 0.3 mm; (c) Nerves and lymphatic vessels mapping. Step 1: Speckle amplitudes from each voxel are plotted as a histogram and fitted with Rayleigh distribution function to find the R2 value. Step 2: 0.95 < R2<0.99 thresholding is applied to the entire imaged volume to map nerves and lymphatic vessels (shown in the same B-scan as in (b), and in a lateral-view average intensity projection (AIP) below it). Nerves appear as oval ring-shaped structures. LV-lymphatic vessel; (d) Blood vessels mapping using conventional speckle variance algorithm (shown in the same B-scan as in (b) and in average intensity projection (AIP) below it). BV – blood vessel; (e) Combined 3D volumes of lymphatic/blood vessels and nerves, presented in a lateral-view average intensity projection form.
Fig. 4.
Fig. 4.
Mouse dorsal skin angiography, lymphangiography/neurography, and histology. (a) White-light photo of dorsal skin in window chamber, field of view = 6 × 6 mm2. (b) Depth-encoded blood microvasculature map of (a). (c) Grey-scale average R2– thresholded projection for low-scattering regions in (a). Dashed-line white (A) and yellow (B) rectangular areas are expanded in (d) for blood microvasculature, and (e) for lymphatic vessels and nerves, some of which are labeled with arrows, the former as cyan and the latter as purple. (f) OCT B-scan with histological stains in (g), (h) and (i) from approximately same location in tissue. (g) Overall tissue architecture and cellular morphology are visualized with Hematoxylin and Eosin (H&E) staining; (h) Nerves are distinguished from surrounding connective tissues with Masson’s Trichrome (MT) staining; (f) Lymphatic vessels are visualized with lymphatic vessel endothelial hyaluronan receptor 1 (LYVE-1). Tissue layers are labelled in the bottom row images as Fs – fascia, M- muscle, F – fat, D – dermis, E – epidermis. Nerves are labeled with purple arrows, lymphatic vessels – with cyan arrows. Scale bars in top row panels are 1 mm; in bottom row are 0.1 mm.
Fig. 5.
Fig. 5.
Angiography, lymphangiography/neurography and histology of pancreatic adenocarcinoma grown in a mouse dorsal skin window chamber. (a) White-light photo of dorsal skin in window chamber, field of view – 6 × 6 mm2; (b) Depth-encoded blood microvasculature map of (a); (c) Grey-scale average R2– thresholded projection for low-scattering regions in (a). Dashed-line white (A) and yellow (B) rectangular areas are expanded in (d) for blood microvasculature, and (e) for lymphatic vessels and nerves, some of which are labeled with arrows, the former as cyan and the latter as purple. Scale bars in (a), (b) and (c) are 1 mm; (f) OCT B-scan with corresponding Hematoxylin and Eosin (H&E) staining in (g) from approximately same location in tissue. Black dash-lined rectangular areas are enlarged in (g) and (h); (h) Nerves are distinguished from surrounding connective tissues with Masson’s Trichrome (MT) staining; (i) Peri-tumoral lymphatic vessels are visualized with lymphatic vessel endothelial hyaluronan receptor 1 (LYVE-1). Nerves are labeled with purple arrows, lymphatic vessels – with cyan arrows. (j) LYVE-1 staining of the tumor core tissue (location labeled with green line in (c)), identifying two newly formed lymphatic vessels with thinner walls. Scale bars in (h), (i) and (j) are 0.1 mm.

References

    1. Vakoc B. J., Lanning R. M., Tyrrell J. A., Padera T. P., Bartlett L. A., Stylianopoulos T., Munn L. L., Tearney G. J., Fukumura D., Jain R. K., Bouma B. E., “Three-dimensional microscopy of the tumor microenvironment in vivo using optical frequency domain imaging,” Nat. Med. 15(10), 1219–1223 (2009).10.1038/nm.1971 - DOI - PMC - PubMed
    1. Alitalo K., “The lymphatic vasculature in disease,” Nat. Med. 17(11), 1371–1380 (2011).10.1038/nm.2545 - DOI - PubMed
    1. Stacker S. A., Williams S. P., Karnezis T., Shayan R., Fox S. B., Achen M. G., “Lymphangiogenesis and lymphatic vessel remodelling in cancer,” Nat. Rev. Cancer 14(3), 159–172 (2014).10.1038/nrc3677 - DOI - PubMed
    1. Birim O., Kappetein A. P., Stijnen T., Bogers A. J., “Meta-analysis of positron emission tomographic and computed tomographic imaging in detecting mediastinal lymph node metastases in nonsmall cell lung cancer,” Ann. Thorac. Surg. 79(1), 375–382 (2005).10.1016/j.athoracsur.2004.06.041 - DOI - PubMed
    1. Lu Q., Hua J., Kassir M. M., Delproposto Z., Dai Y., Sun J., Haacke M., Hu J., “Imaging lymphatic system in breast cancer patients with magnetic resonance lymphangiography,” PLoS One 8(7), e69701 (2013).10.1371/journal.pone.0069701 - DOI - PMC - PubMed

LinkOut - more resources