

Comment
doi: 10.1523/ENEURO.0205-19.2019.
eCollection 2019 Jul-Aug.
Estimation for Better Inference in Neuroscience
Affiliations
- PMID: 31453316
- PMCID: PMC6709209
- DOI: 10.1523/ENEURO.0205-19.2019
Item in Clipboard
Comment
Estimation for Better Inference in Neuroscience
eNeuro.
.
Abstract
The estimation approach to inference emphasizes reporting effect sizes with expressions of uncertainty (interval estimates). In this perspective we explain the estimation approach and describe how it can help nudge neuroscientists toward a more productive research cycle by fostering better planning, more thoughtful interpretation, and more balanced evaluation of evidence.
Keywords: estimation; neuroscience methods; statistical inference.
Figures
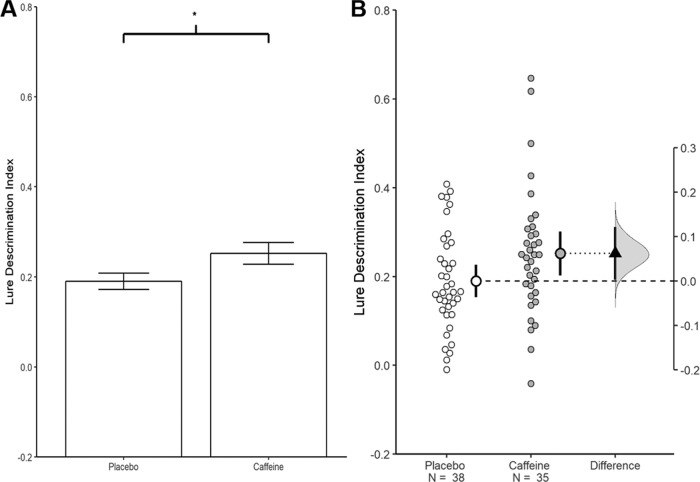
Visualizations emphasizing testing versus estimation. Both plots are from the same experiment examining the effect of caffeine on memory (Borota et al., 2014). A, A traditional bar graph. The bars represent each group mean; the error bars represent the SEM. The * indicates a statistically significant difference, p = 0.05. B, An estimation plot of the same data. In this plot the small circles represent the individual participants. The large circles with error bars represent each group mean with their 95% confidence intervals. Critically, an estimation plot emphasizes the effect size of interest for this design: the difference between the group means. This is depicted on the “difference axis” on the right. The 0 point of this axis is based on the mean of a reference group (in this case the placebo group). The filled triangle shows the difference between groups in this sample. The shaded curve shows the entire distribution of expected sampling error for the difference between the means. The error bar on the triangle indicates the 95% confidence interval for the difference between means. The confidence interval represents the range of parameter values which remain compatible with the data; that is, the variety of effect sizes that are not rejected at α = 0.05. The range of compatible values is very long and includes values that would be impossible to reliably detect with feasible sample sizes. Given this, research conclusions should be tentative and expectations for replication should be tempered. This difference plot was generated using R. The data from A and B was extracted from Borota et al. (2014).
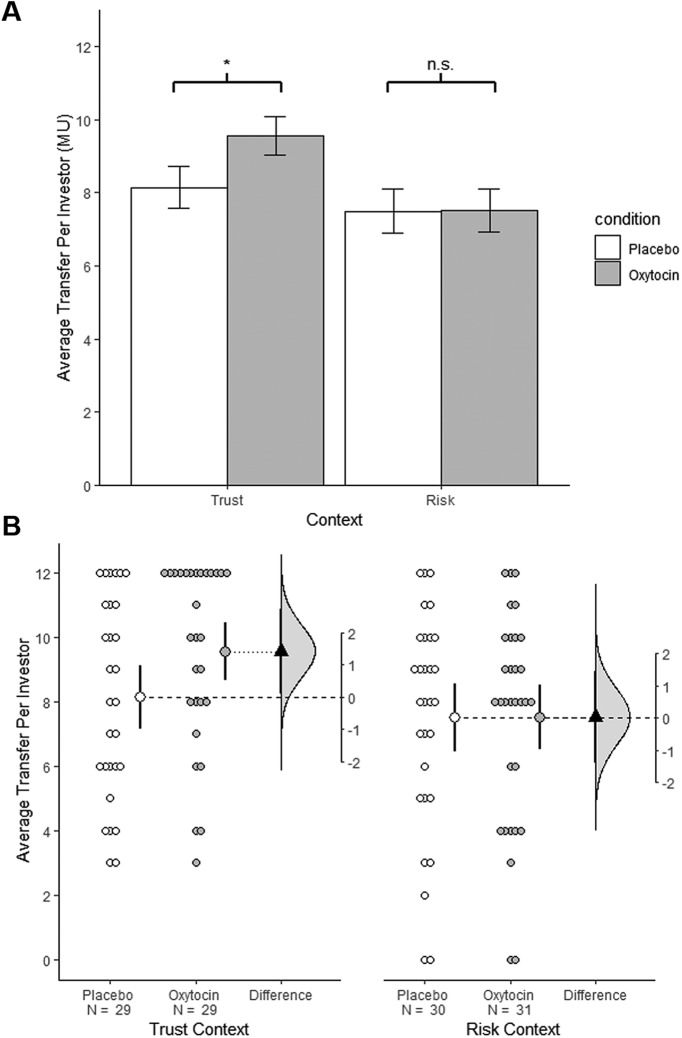
Visualizations emphasizing testing versus estimation. Both plots are from the same experiments examining the effect of oxytocin on social behavior (Kosfeld et al., 2005). A, A bar graph showing the effect of intranasal oxytocin on the amount invested in a trust (left) and risk (right) game. Each bar represents group means and error bars represent ± 1 SE. There is a statistically significant effect of oxytocin in the trust game (p = 0.04, on tailed), but not in the risk game. The difference in statistical significance status can give the impression that oxytocin specifically influences performance in the trust game, but a formal test for an interaction is not significant (p = 0.23). B, Estimation plots of the same data. The plots compare investment in the oxytocin and investment condition in the trust (left) and risk (right) games. Small circles represent individual participants. Large circles with error bars show group means with 90% confidence intervals (90% confidence was selected to match the stringency of the one-tailed test used in the original paper). The triangles represent the observed difference between groups, with 90% confidence intervals. The curves indicate the entire range of expected sampling error in estimating the mean difference. Note the considerable overlap in the estimated oxytocin effects in the trust and risk games. This correctly suggests that there are many compatible effect sizes in common and that these data do not support strong claims for an interaction. This figure was adapted with permission from Calin-Jageman and Cumming (2019).
Comment on
-
Effects of Single Cage Housing on Stress, Cognitive, and Seizure Parameters in the Rat and Mouse Pilocarpine Models of Epilepsy.eNeuro. 2019 Aug 1;6(4):ENEURO.0179-18.2019. doi: 10.1523/ENEURO.0179-18.2019. Print 2019 Jul/Aug. eNeuro. 2019. PMID: 31331937 Free PMC article.
References
-
- American Psychological Association (2010) Publication manual of the American Psychological Association. Washington, DC: American Psychological Association.
-
- Anscombe FJ (1954) Fixed-sample-size analysis of sequential observations. Biometrics 10:89 10.2307/3001665 - DOI
-
- ASA (2016) Ethical guidelines for statistical practice: American Statistical Association. Available at http://www.amstat.org/asa/files/pdfs/EthicalGuidelines.pdf.
Publication types
MeSH terms
Substances
Grants and funding
LinkOut - more resources
Full Text Sources
Medical