. 2019 Aug 19:2:315.
doi: 10.1038/s42003-019-0560-x. eCollection 2019.

Cell-derived extracellular vesicles can be used as a biomarker reservoir for glioblastoma tumor subtyping

Affiliations

Cell-derived extracellular vesicles can be used as a biomarker reservoir for glioblastoma tumor subtyping

Rosemary Lane et al. Commun Biol. .

Abstract

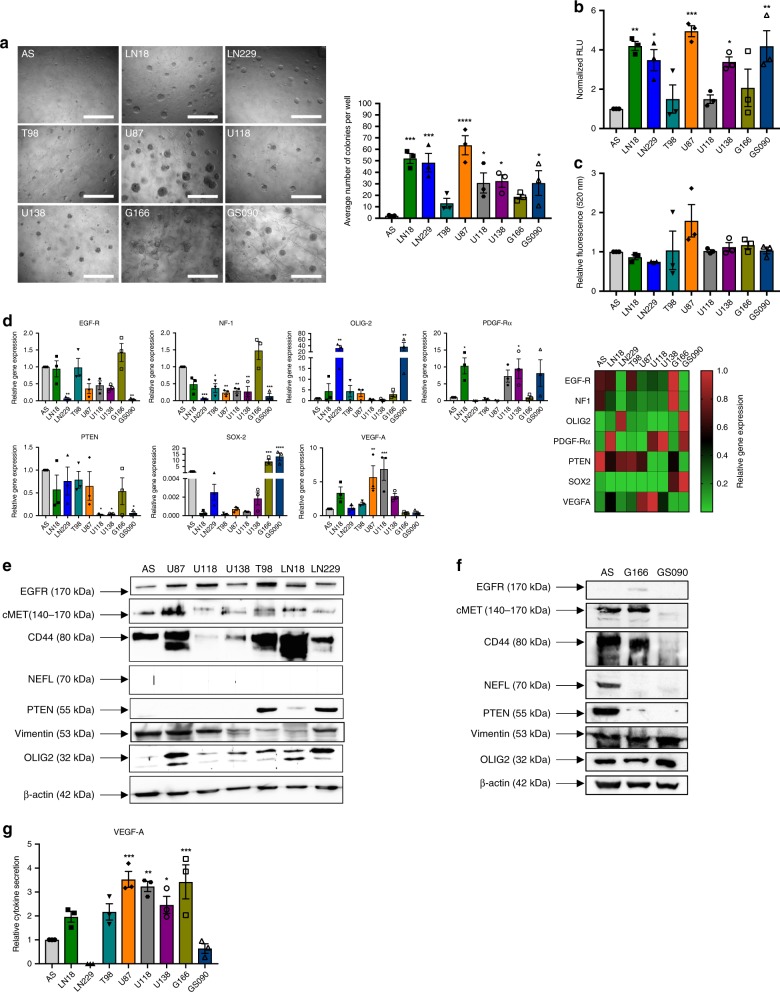
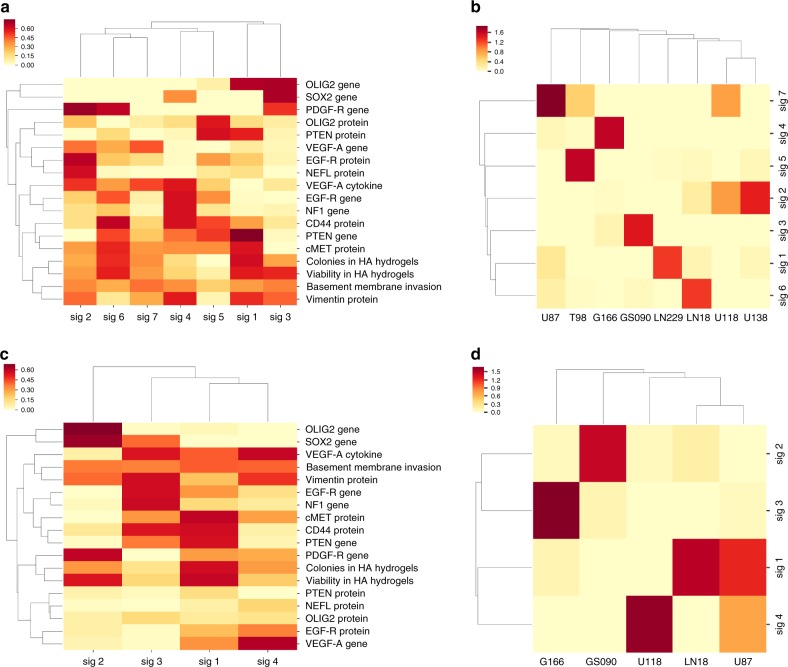
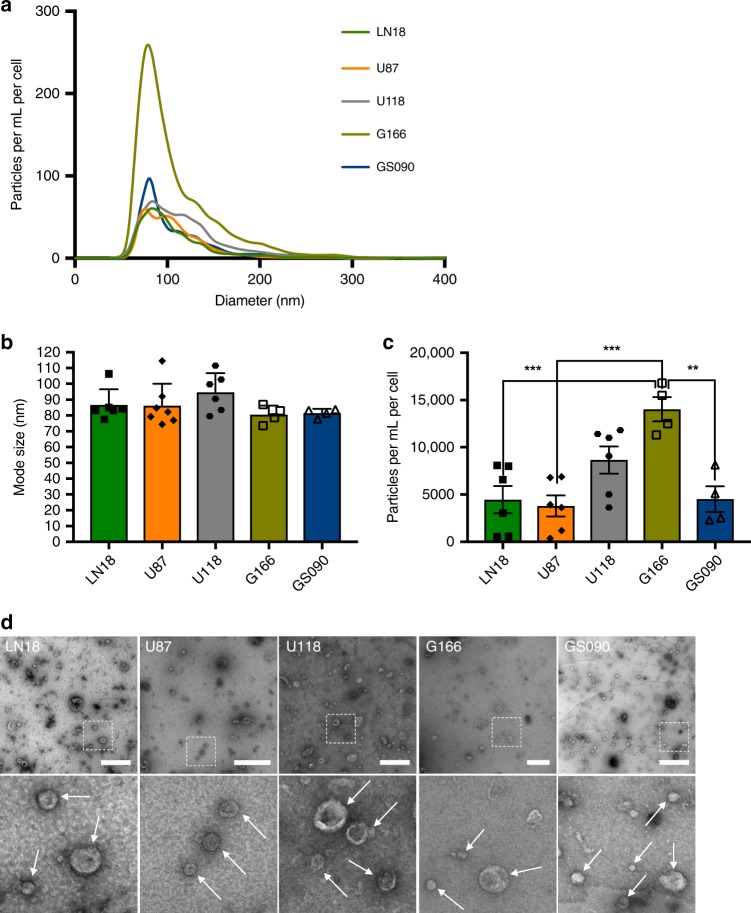
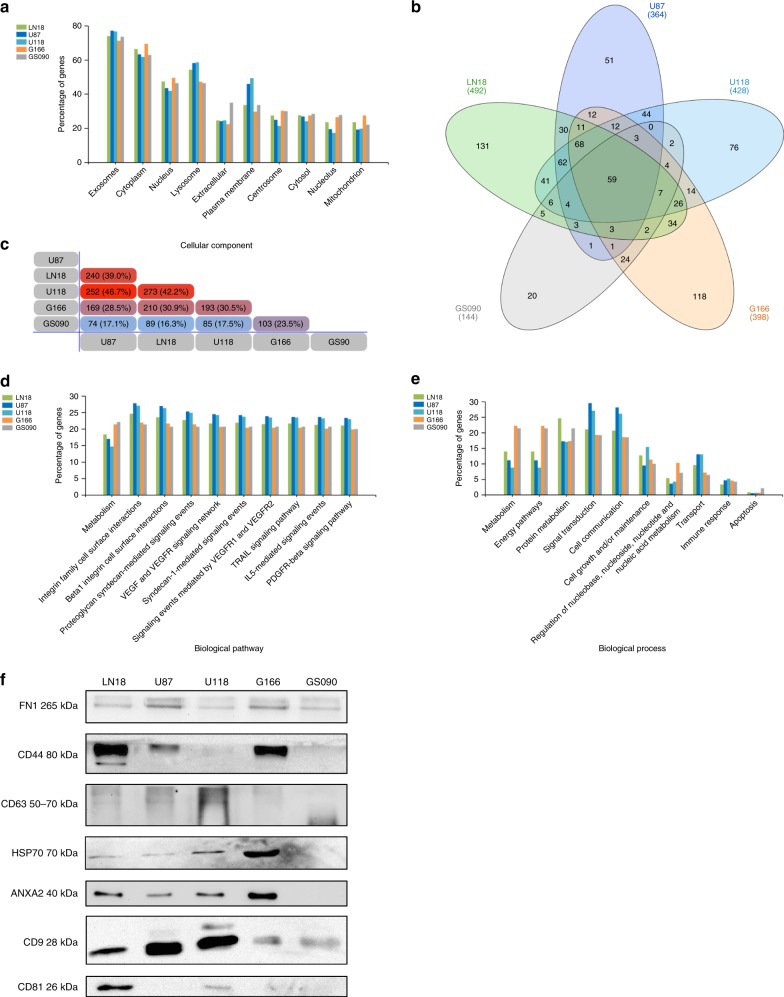
Glioblastoma (GBM) is one of the most aggressive solid tumors for which treatment options and biomarkers are limited. Small extracellular vesicles (sEVs) produced by both GBM and stromal cells are central in the inter-cellular communication that is taking place in the tumor bulk. As tumor sEVs are accessible in biofluids, recent reports have suggested that sEVs contain valuable biomarkers for GBM patient diagnosis and follow-up. The aim of the current study was to describe the protein content of sEVs produced by different GBM cell lines and patient-derived stem cells. Our results reveal that the content of the sEVs mirrors the phenotypic signature of the respective GBM cells, leading to the description of potential informative sEV-associated biomarkers for GBM subtyping, such as CD44. Overall, these data could assist future GBM in vitro studies and provide insights for the development of new diagnostic and therapeutic methods as well as personalized treatment strategies.

Keywords: Head and neck cancer; Tumour biomarkers.


Conflict of interest statement

Competing interestsG.G. is an Editorial Board Member of Communications Biology, but was not involved in the editorial review of, nor the decision to publish, this article. The remaining authors declare no competing interests.

Figures

Fig. 1
Fig. 1
Astrocytes (AS), GBM cell lines, and GBM patient-derived stem cells present different in vitro invasion capabilities and specific subtype marker expression. a AS and GBM cells invasiveness and colony formation abilities using a hyaluronic acid (HA)-based hydrogel assay. Cells were incubated within a HA hydrogel for 7 days. Colony counting was then performed. Scale bar = 400 µm. b AS and GBM cell viability in a HA hydrogel-based assay using the CellTiter-Glo® Luminescent Cell Viability Assay. c Invasion abilities of AS and GBM cells through an extracellular matrix-coated membrane. Cells were seeded in the top chamber and were allowed to invade the matrix for 24 h in presence or absence of FCS in the bottom chamber. Cells that have passed through the matrix were then detached, lysed, and labeled with CyQuant GR Dye. Fluorescence was then read (480/520 nm filter set). Data obtained in presence of FCS was normalized to data obtained without FCS. Representative images are shown. d qRT-PCR analysis of GBM subtype and aggressiveness marker expression in astrocytes, six different GBM cell lines and two different GBM patient-derived stem cells. GAPDH was used as an internal control. Data are shown as normalized to AS data. Heat-map representative of the qRT-PCR data where the data is normalized to the highest level of gene expression. e Western blotting analysis of GBM subtype and aggressiveness marker expression in AS and six different GBM cell lines. β-actin was used as an internal control. f Western blotting analysis of GBM subtype and aggressiveness marker expression in astrocytes and two different GBM patient-derived stem cells. β-actin was used as an internal control. g ELISA analysis of VEGF-A secretion by AS, six different GBM cell lines and two different GBM patient-derived stem cells. Representative images are shown. The mean ± SEM of n = 3 independent experiments is shown. *p < 0.05, **p < 0.01, ***p < 0.001, ****p < 0.0001 (ordinary one-way ANOVA)
Fig. 2
Fig. 2
Different groups of GBM cells can be defined based on invasiveness potential and marker expression data. a Clustering heatmap for each parameter shown in Fig. 1, based on the phenotype and marker expression data across all cell lines. Parameters have been clustered in seven different signatures (sig 1–7) in order to reduce the dimensionality of the data. b Clustering heatmap for GBM cells based on the signatures defined in a. GBM cells have been grouped based on this correlation analysis (U87/T98/G116/GS090/LN229/LN18/U118 & U138). c Clustering heatmap for each parameter shown in Fig. 1, based on the phenotype and marker expression data in LN18, U87, U118, G166, and GS090. Parameters have been clustered in four different signatures (sig 1–4) in order to reduce the dimensionality of the data. d Clustering heatmap for LN18, U87, U118, G166, and GS090 GBM cells based on the signatures defined in c. GBM cells have been grouped based on this correlation analysis (G166/GS090/U118/LN18 & U87)
Fig. 3
Fig. 3
sEV fractions produced by different GBM cell lines and patient-derived stem cells show variable concentrations and specific patterns of EV markers expression. a NTA of GBM cell-derived sEVs. sEV suspension was 1/50 diluted and infused into a Nanosight© NS300 instrument. Five captures of 60 s each were recorded. Particle concentration (particles/mL) and size (nm) were measured. Particles concentration was normalized to the number of cells (particles/mL/cell) at CM harvest. The mean of at least four independent experiments is shown. b Mode size (nm) distribution of GBM cell-derived sEVs. sEV mode sizes were determined by NTA. c Concentrations (particles/mL/cell) of GBM cell-derived sEVs. sEV concentrations were determined by NTA. d TEM detection of GBM cell-derived sEVs (×20k magnification and zoom). White arrows show sEVs. Representative pictures are shown. Scale bar = 500 µm. The mean ± SEM of at least n = 4 independent experiments is shown (LN18 n = 6, U87 n = 7, U118 n = 6, G166 n = 5, GS090 n = 4). *p < 0.05, **p < 0.01, ***p < 0.001, ****p < 0.0001(ordinary one-way ANOVA)
Fig. 4
Fig. 4
MS analysis reveals sEV proteomic content that mirrors GBM cell clustering signature and invasiveness in vitro. Protein hits were identified in GBM cell-derived sEVs via MS. Only the protein hits common to at least three biological repeats were considered for each cell line/stem cell (LN18 n = 3, U87 n = 3, U118 n = 4, G166 n = 5, GS090 n = 4). a Gene enrichment analysis for ‘Cellular component’ was performed based on the MS hits identified from each GBM cell-derived sEVs. b Venn diagram based on the identified MS hits. c Pairwise comparison diagram showing similarity between the proteome contents of the different GBM cell-derived sEVs. d Gene enrichment analysis for ‘Biological pathway’ was performed based on the MS hits identified from each GBM cell-derived sEVs. e Gene enrichment analysis for ‘Biological process’ was performed based on the MS hits identified from each GBM cell-derived sEVs. f Western blotting detection of fibronectin (FBN), CD44, CD63, HSP70, AnnexinA2 (ANXA2), CD9, and CD81 in GBM cell-derived sEVs

References

    1. Louis DN, et al. The 2016 World Health Organization Classification of Tumors of the Central Nervous System: a summary. Acta Neuropathol. 2016;131:803–820. doi: 10.1007/s00401-016-1545-1. - DOI - PubMed
    1. Verhaak RG, et al. Integrated genomic analysis identifies clinically relevant subtypes of glioblastoma characterized by abnormalities in PDGFRA, IDH1, EGFR, and NF1. Cancer Cell. 2010;17:98–110. doi: 10.1016/j.ccr.2009.12.020. - DOI - PMC - PubMed
    1. Mallawaaratchy DM, et al. Comprehensive proteome profiling of glioblastoma-derived extracellular vesicles identifies markers for more aggressive disease. J. Neuro-Oncol. 2017;131:233–244. doi: 10.1007/s11060-016-2298-3. - DOI - PMC - PubMed
    1. Phillips HS, et al. Molecular subclasses of high-grade glioma predict prognosis, delineate a pattern of disease progression, and resemble stages in neurogenesis. Cancer Cell. 2006;9:157–173. doi: 10.1016/j.ccr.2006.02.019. - DOI - PubMed
    1. Patel AP, et al. Single-cell RNA-seq highlights intratumoral heterogeneity in primary glioblastoma. Science. 2014;344:1396–1401. doi: 10.1126/science.1254257. - DOI - PMC - PubMed

Publication types

MeSH terms

Substances

LinkOut - more resources