. 2019 Aug 23:2:319.
doi: 10.1038/s42003-019-0555-7. eCollection 2019.

Dynamical modeling of multi-scale variability in neuronal competition

Affiliations

Dynamical modeling of multi-scale variability in neuronal competition

Benjamin P Cohen et al. Commun Biol. .

Abstract

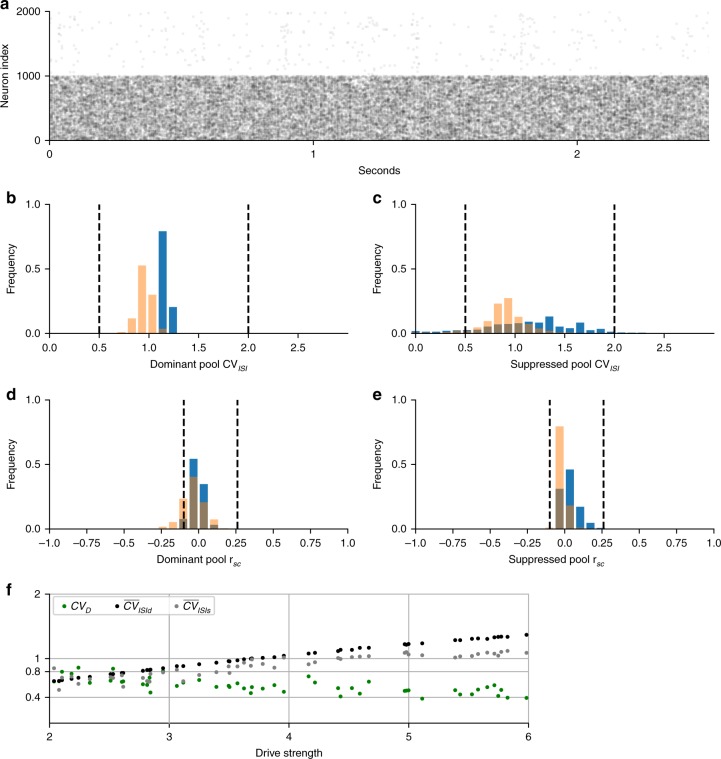
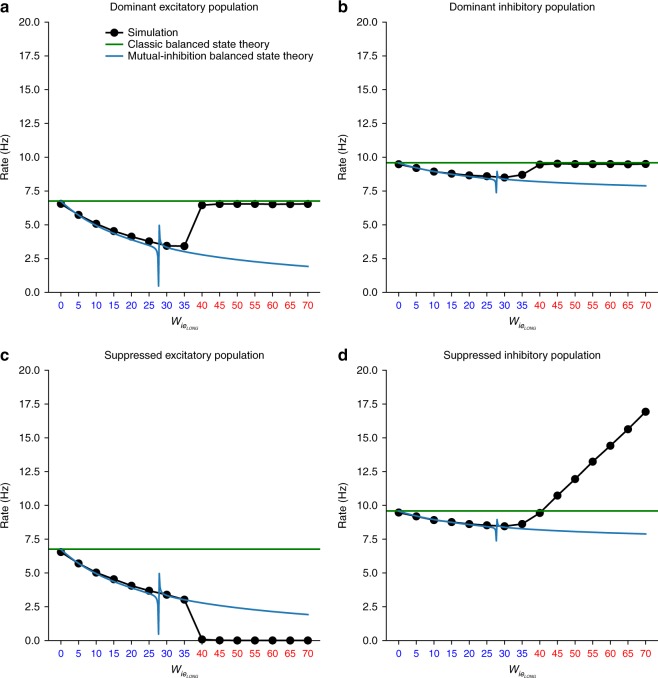
Variability is observed at multiple-scales in the brain and ubiquitous in perception. However, the nature of perceptual variability is an open question. We focus on variability during perceptual rivalry, a form of neuronal competition. Rivalry provides a window into neural processing since activity in many brain areas is correlated to the alternating perception rather than a constant ambiguous stimulus. It exhibits robust properties at multiple scales including conscious awareness and neuron dynamics. The prevalent theory for spiking variability is called the balanced state; whereas, the source of perceptual variability is unknown. Here we show that a single biophysical circuit model, satisfying certain mutual inhibition architectures, can explain spiking and perceptual variability during rivalry. These models adhere to a broad set of strict experimental constraints at multiple scales. As we show, the models predict how spiking and perceptual variability changes with stimulus conditions.

Keywords: Biophysical models; Computational biophysics; Perception.


Conflict of interest statement

Competing interestsThe authors declare no competing interests.

Figures

Fig. 1
Fig. 1
Three network architectures. a Unstructured network receives either a homogenous nonfluctuating drive (Case 1) or each half of the network receives independent stochastic (fluctuating) drive (heterogeneous drive, Case 2). b Discrete mutual-inhibition network consists of two pools of excitatory and inhibitory neurons tuned to a specific percept. The architecture of each pool is an unstructured network as in a and receives nonfluctuating drive to excitatory neurons only. Mutual inhibition model consists of long-range connections from excitatory neurons in one pool to inhibitory neurons in the other. c Continuum network consists of neurons arranged in excitatory and inhibitory rings with spatially structured coupling between all neuron types. Two sets of excitatory neurons on opposite sides of the ring (representing different percept tuning) receive nonfluctuating feedforward drive. Red arrow shows example of the spatial profile for excitatory-to-excitatory synaptic strength from a single presynaptic neuron. Strength is periodic and maximal at the presynaptic neuron (at red arrow)
Fig. 2
Fig. 2
Unstructured network does not comply with rivalry constraints. a Case 1: homogenous drive raster (excitatory neuron spiking across time) exhibits homogenous response. Case 2: heterogeneous drive (bf) b heterogeneous drive consists of independent stochastic processes for subsets of neurons within the unstructured network. c Excitatory neuron raster showing alternating activity levels between two pools in response to the heterogeneous input in b. d Levelt’s 4th proposition is not obeyed: percept durations increase with drive strength instead of decreasing. e Dominance time distribution of random network (as in c). Dominance duration coefficient of variation (CVD) depends on the report threshold (see Table 1: definitions). For example, CVD are 1.9, 0.61, and 0.34 for 0, 300, and 750 ms report thresholds, respectively. f Percept state variable (z-scored) reflects differences in the drives in b, supporting that the dominance duration statistics mirror the drive fluctuations
Fig. 3
Fig. 3
Psychophysics reproduced by discrete (blue) mutual inhibition and continuum (orange) networks. a Networks match Levelt’s 4th proposition; dominance duration decreases with drive strength. b Networks match Levelt’s 2nd and modified 2nd propositions (compare with Fig. 6 in ref. ). Consistent with this, the overall alternation rate decays symmetrically from equal dominance
Fig. 4
Fig. 4
Psychophysics variability reproduced by discrete (blue) mutual inhibition and continuum (orange) networks. a Excitatory neuron raster of discrete mutual inhibition network during rivalry showing stochastic dominance durations. b, c Gamma-like distribution of dominance durations with 300 ms report threshold (see Table 1). CVD and skewness, respectively, are given in parenthesis. Dashed lines in b, c are the empirical gamma distribution shape parameter from Robertson et al. during binocular rivalry using the scale parameter from our simulations. d Dominance duration standard deviation (σ) vs mean (μ) is well fit by regression line with slope CVD matching Cao et al. (discrete slope = 0.65, P-value < 10−314, n = 999 drive strengths sampled; continuum slope = 0.73, P-value < 10−314, n = 500 drive strengths sampled). e CVD computed at each drive strength stays within the experimentally observed range (dashed lines) across changes in drive but has a significant trend (P-value < 10−159, same samples as in d). Statistics (two-tailed P-values, etc.) for descriptive purpose of the modeled system and not rigorous hypothesis tests
Fig. 5
Fig. 5
Spiking variability in discrete mutual inhibition (blue) and continuum (orange) networks. ae Results from single realization of example systems (symmetric drive = 5). Distributions are across neurons and dashed lines are empirically observed bounds (see Table 1). a Excitatory neuron raster of discrete mutual inhibition network during rivalry showing stochastic spiking in dominant (neuron index 0–999) and suppressed (neuron index 1000–2000) populations. b, c Irregular spiking shown by the interspike-interval coefficient of variation (CVISI) distributions for dominant pool (b) and suppressed pool (c) excitatory neurons. d, e Asynchronous spiking of dominant pool (d) and suppressed pool (e) excitatory neurons shown by the distribution of spike-count correlations (rsc). f Spiking and perceptual variability as a function of drive strength obeying Levelt’s 4th proposition. Plot of CVD and the average CVISI across neurons in the dominant CV¯ISId or suppressed CV¯ISIs states. There was a significant linear trend for all measures (maximum P-value < 10−8, n = 49 drive strength samples). Measures remained within the empirical constraints as indicated by y-ticks. Statistics (two-tailed P-values, etc.) for descriptive purpose of the modeled system and not rigorous hypothesis tests
Fig. 6
Fig. 6
Transition from balanced to mixed balanced state across psychophysical states: a dominant pool excitatory population, b dominant pool inhibitory population, c suppressed pool excitatory population, and d suppressed pool inhibitory population. Black dots are simulation results. Blue lines are the two-pool mutual inhibition (four population) balanced state theory predictions. Green lines are the classic, single-pool (two population), balanced state theory predictions. Blue abscissa tick marks indicate the symmetric state and red indicate asymmetric state. Irregular spiking in the symmetric state is explained by mutual-inhibition balanced state theory but only the dominant state in the asymmetric state is explained by classic balanced state theory. The suppressed pool does not conform to balanced state theory although it still fires irregularly due to irregular input from dominant pool. Transition from symmetric to asymmetric state is anticipated by a singularity in the theory indicated by the discontinuity in the blue lines

References

    1. Longtin A. Neuronal noise. Scholarpedia. 2013;8:1618. doi: 10.4249/scholarpedia.1618. - DOI
    1. Faisal AA, Selen LPJ, Wolpert DM. Noise in the nervous system. Nat. Rev. Neurosci. 2008;9:292–303. doi: 10.1038/nrn2258. - DOI - PMC - PubMed
    1. Softky WR, Koch C. Cortical cells should fire regularly, but do not. Neural Comput. 1992;4:643–646. doi: 10.1162/neco.1992.4.5.643. - DOI
    1. Churchland MM, et al. Stimulus onset quenches neural variability: a widespread cortical phenomenon. Nat. Neurosci. 2010;13:369–378. doi: 10.1038/nn.2501. - DOI - PMC - PubMed
    1. Tolhurst DJ, Movshon JA, Dean AF. The statistical reliability of signals in single neurons in cat and monkey visual cortex. Vis. Res. 1983;23:775–85. doi: 10.1016/0042-6989(83)90200-6. - DOI - PubMed