. 2019 Aug 27:8:e47498.
doi: 10.7554/eLife.47498.

Increased expression of heme-binding protein 1 early in Alzheimer's disease is linked to neurotoxicity

Affiliations

Increased expression of heme-binding protein 1 early in Alzheimer's disease is linked to neurotoxicity

Oleksandr Yagensky et al. Elife. .

Abstract

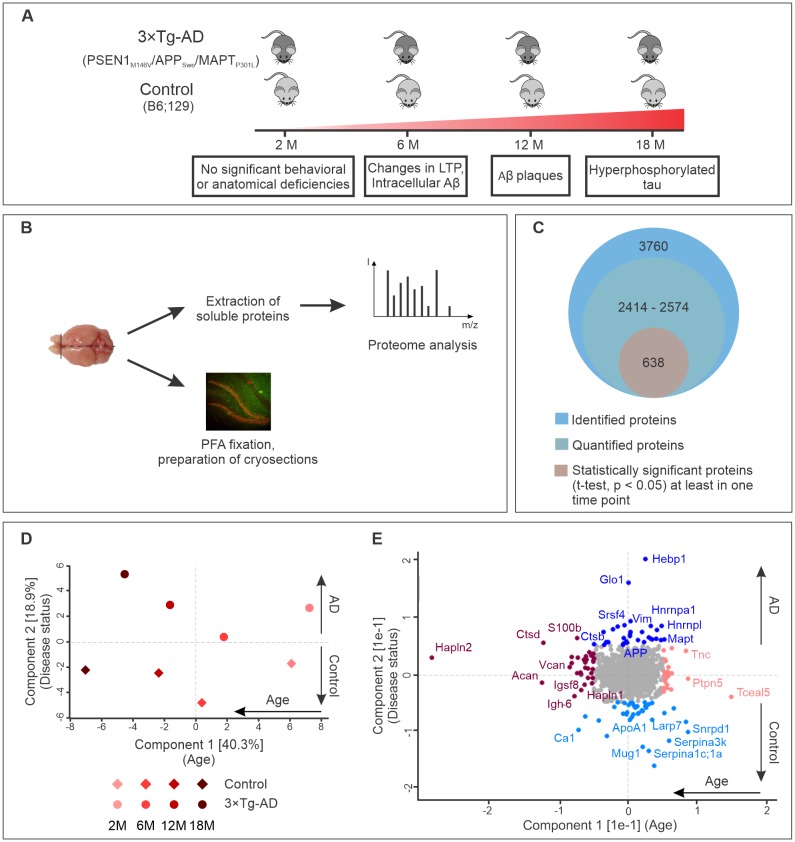
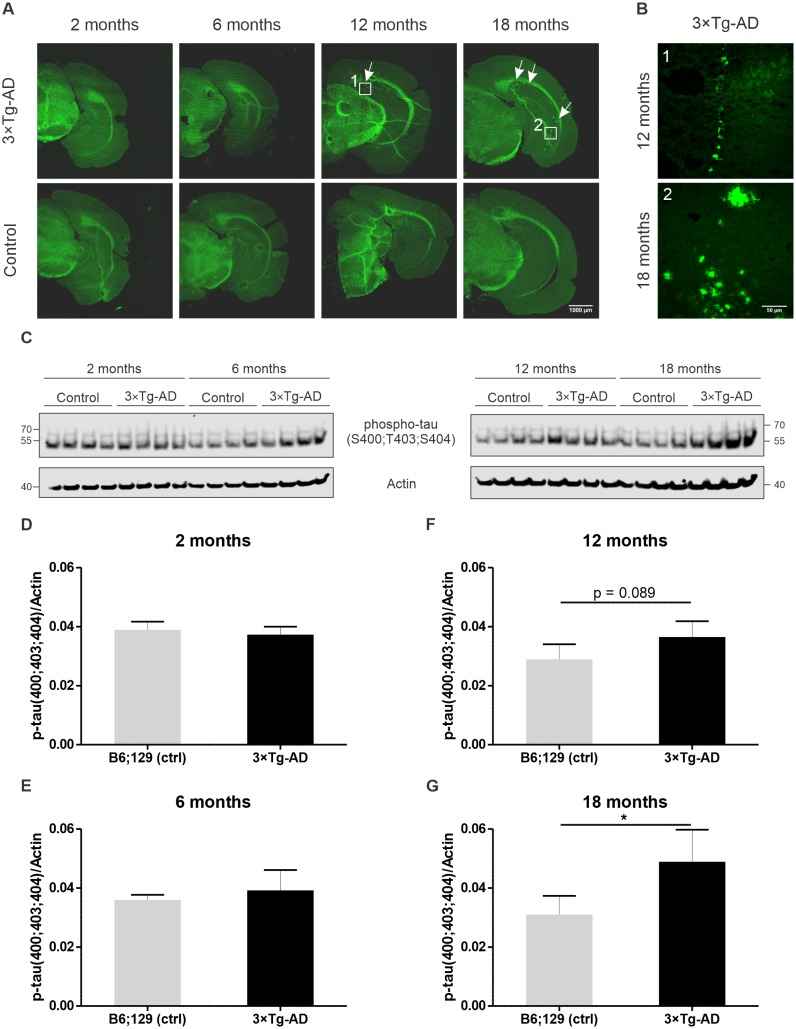
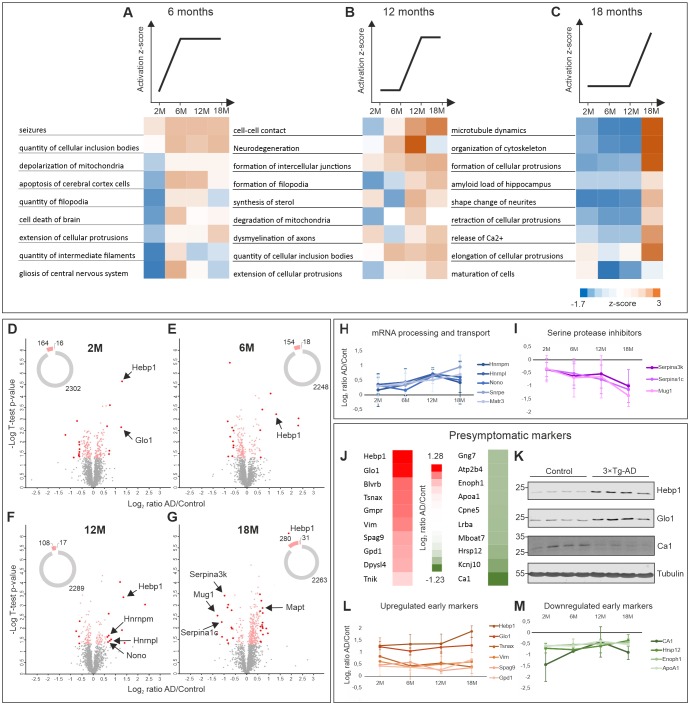
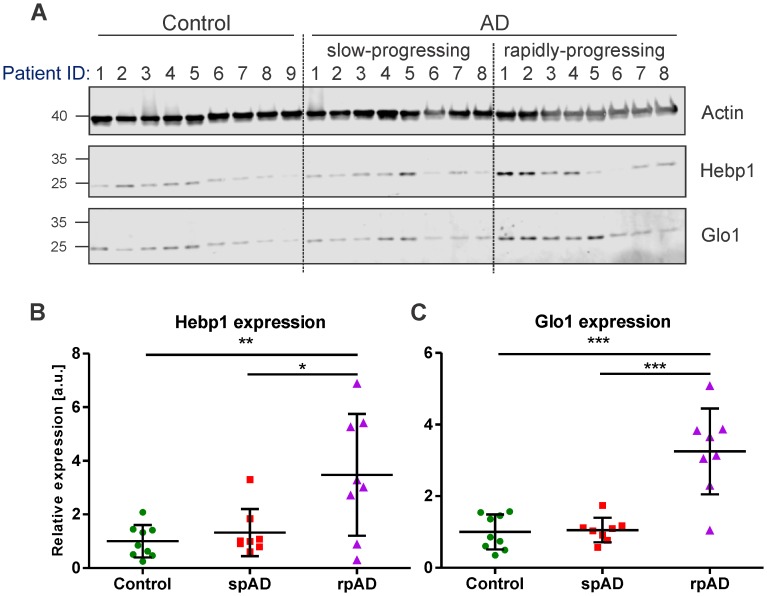
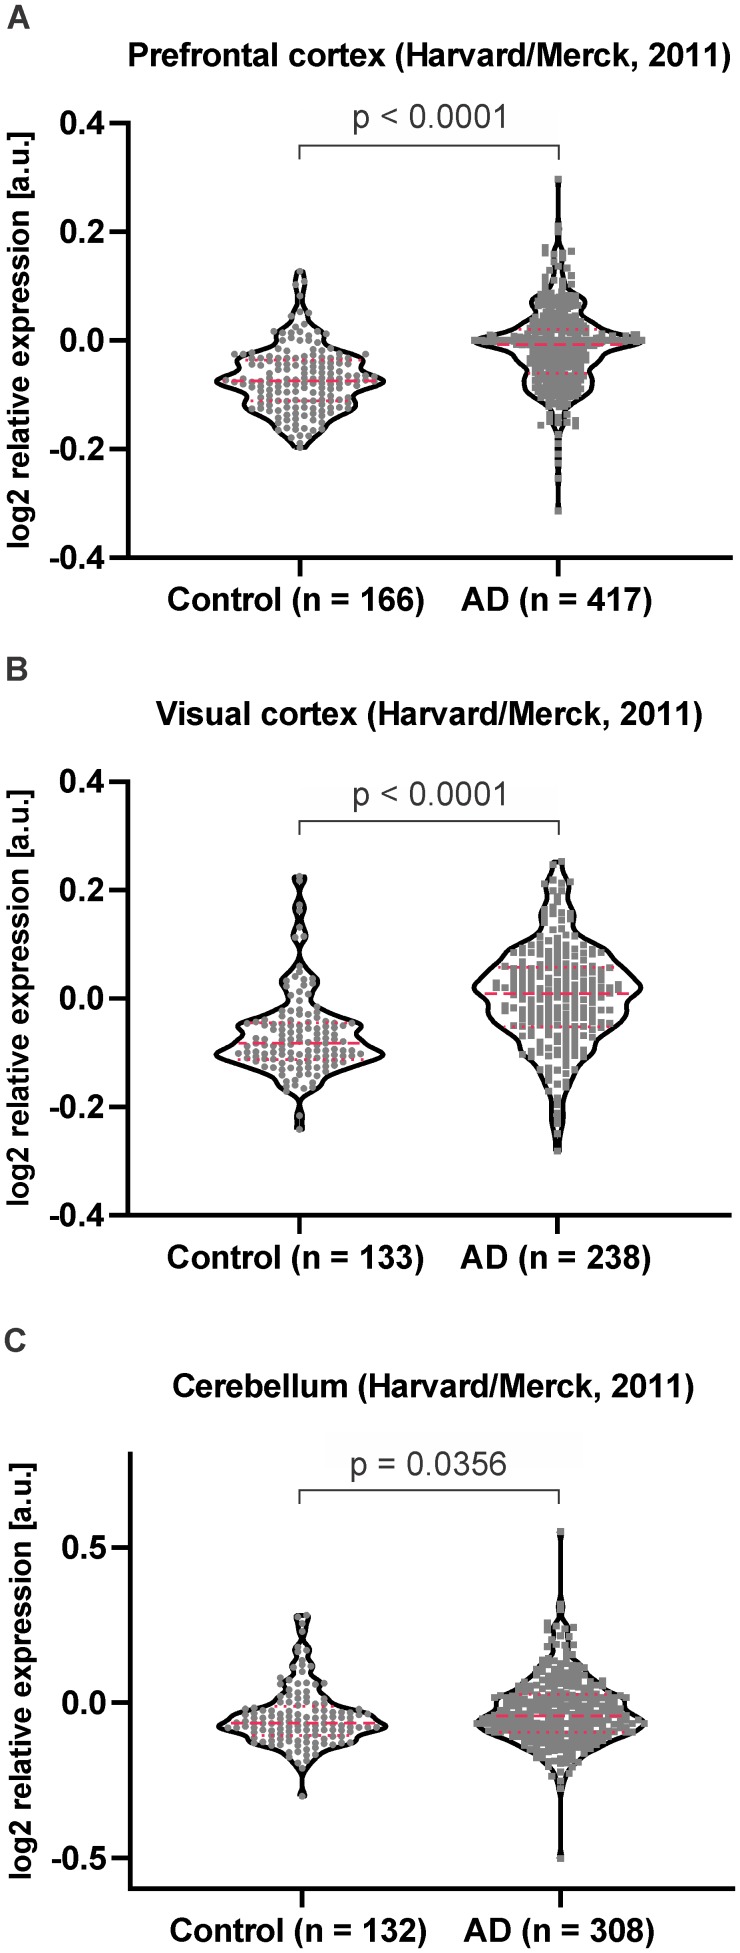
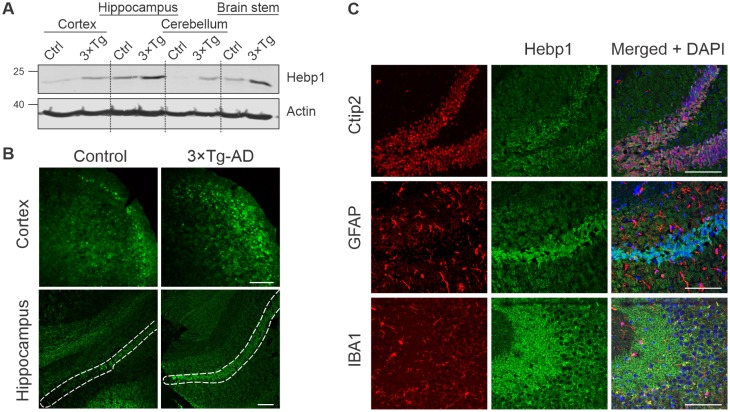
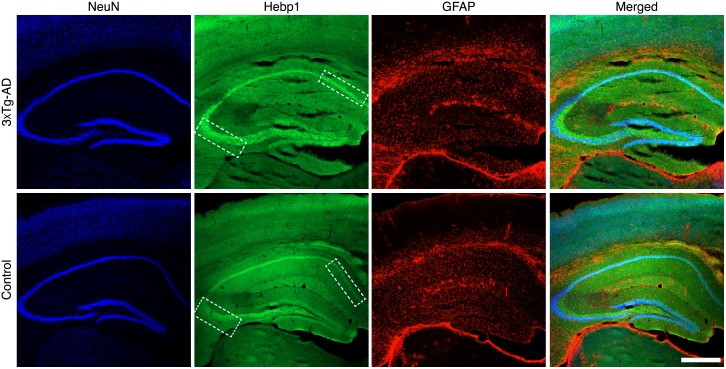
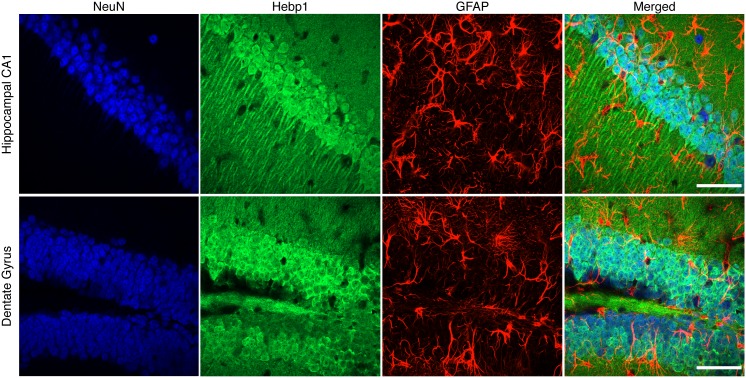
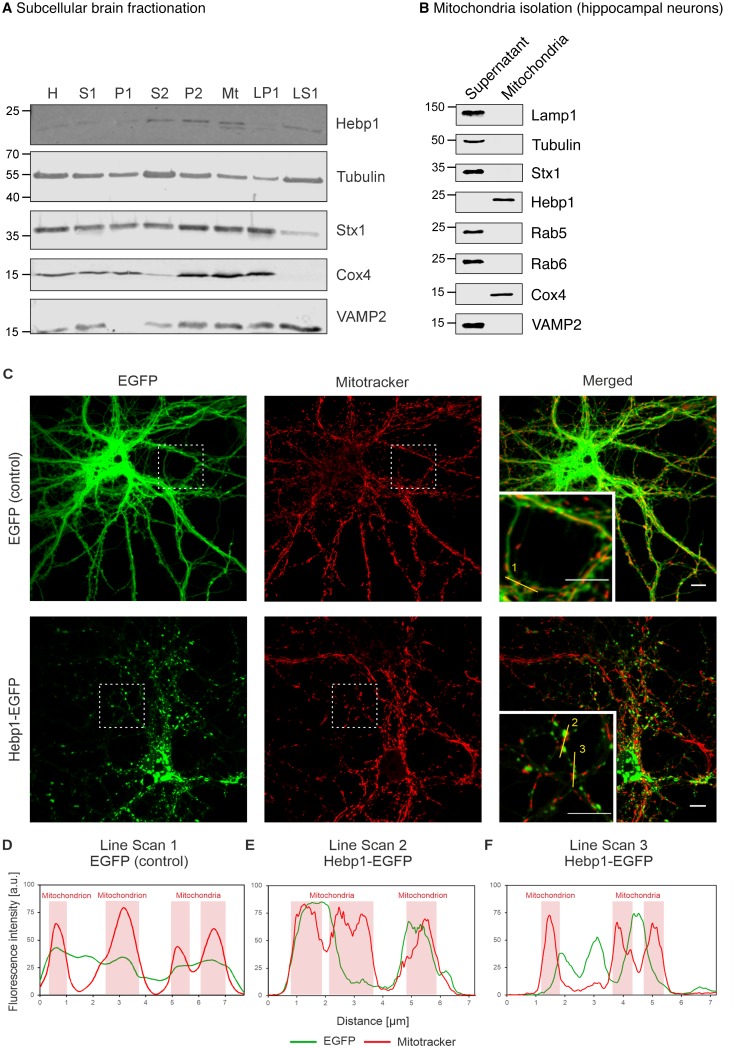
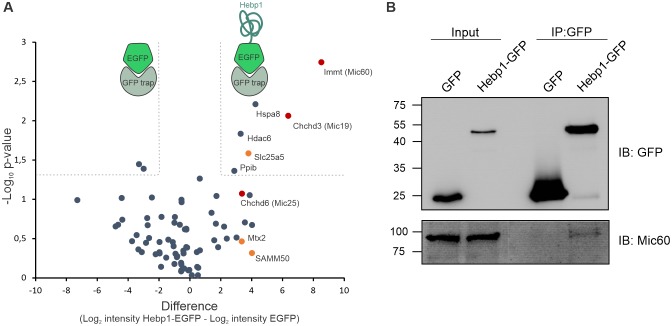
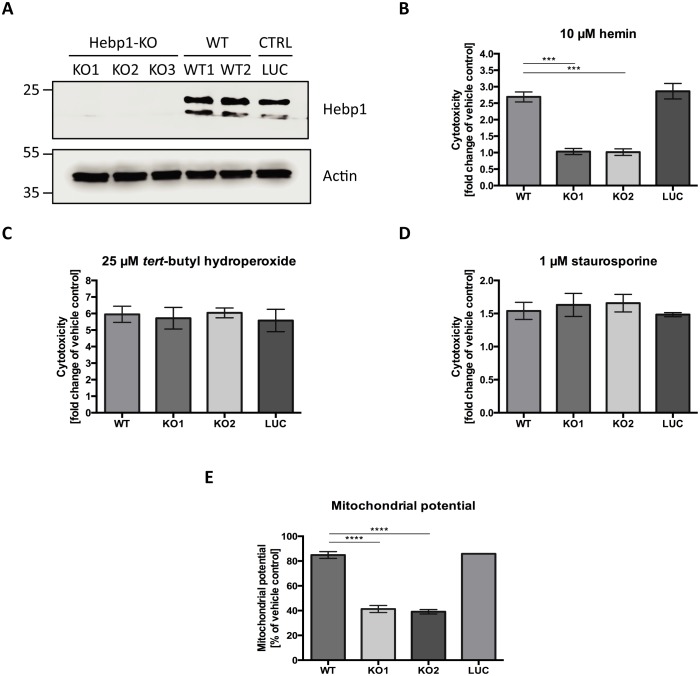
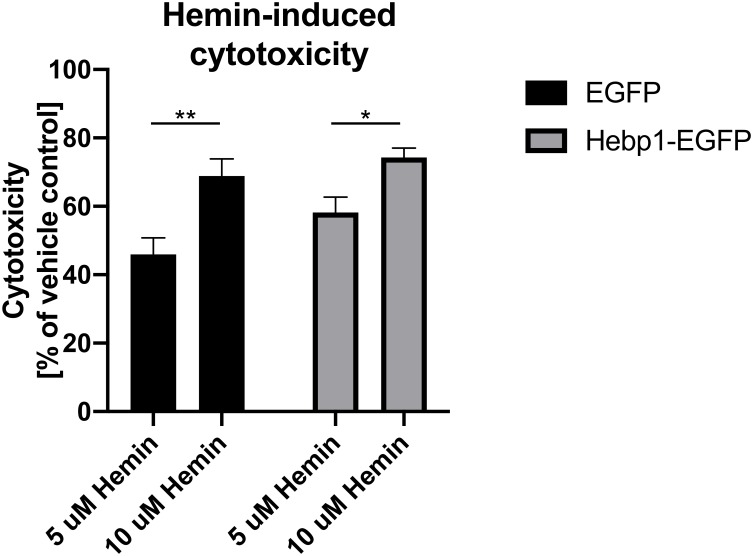
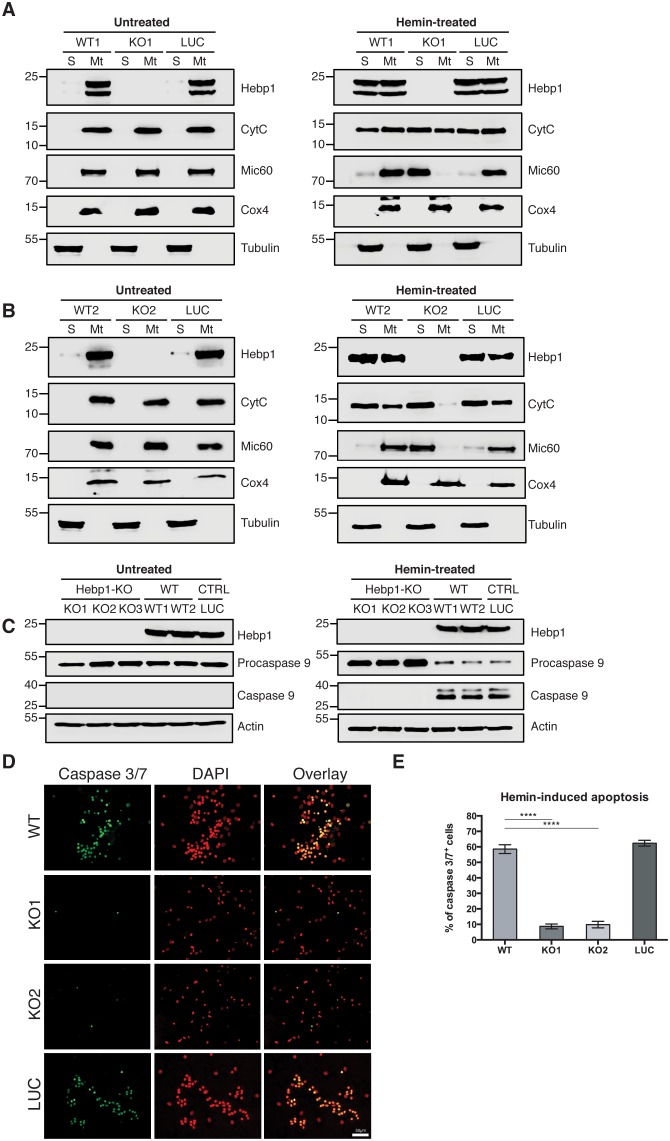
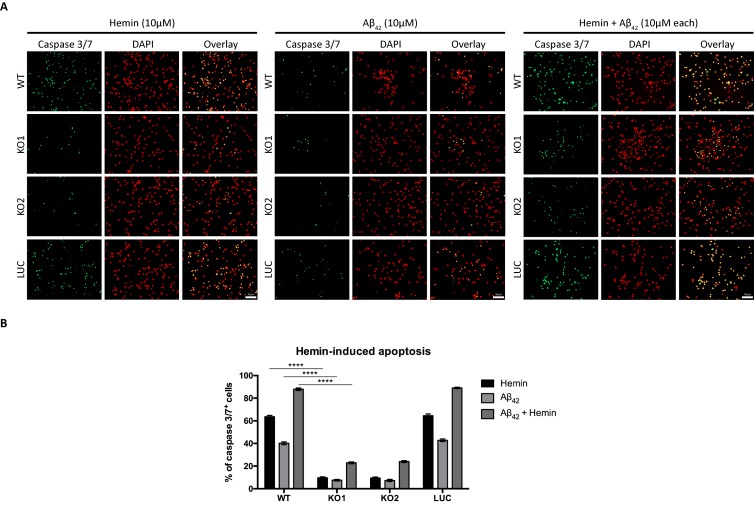
Alzheimer's disease is the most prevalent neurodegenerative disorder leading to progressive cognitive decline. Despite decades of research, understanding AD progression at the molecular level, especially at its early stages, remains elusive. Here, we identified several presymptomatic AD markers by investigating brain proteome changes over the course of neurodegeneration in a transgenic mouse model of AD (3×Tg-AD). We show that one of these markers, heme-binding protein 1 (Hebp1), is elevated in the brains of both 3×Tg-AD mice and patients affected by rapidly-progressing forms of AD. Hebp1, predominantly expressed in neurons, interacts with the mitochondrial contact site complex (MICOS) and exhibits a perimitochondrial localization. Strikingly, wildtype, but not Hebp1-deficient, neurons showed elevated cytotoxicity in response to heme-induced apoptosis. Increased survivability in Hebp1-deficient neurons is conferred by blocking the activation of the mitochondrial-associated caspase signaling pathway. Taken together, our data highlight a role of Hebp1 in progressive neuronal loss during AD progression.

Keywords: Alzheimer's disease; Hebp1; human; mouse; neuron; neuroscience; rat.


Conflict of interest statement

OY, MK, SG, TR, SZ, IZ, WH, HU, JC No competing interests declared

Figures

Figure 1.
Figure 1.. Progression of Alzheimer’s disease at molecular level in the triple transgenic mouse model (PSEN1M146V/APPSwe/MAPTP301L).
(A) Disease progression in 3×Tg-AD mice and corresponding time points (2, 6, 12, 18 months) of sample collection. Four biological replicates per group were collected at each time point. (B) Experimental workflow and sample processing. Half of the collected brain sample was used for preparation of the cryosections for immunohistochemistry. Soluble proteins of the other half were extracted for proteomics analysis. (C) Number of identified, quantified and statistically significant proteins in the dataset. (D) Principal component analysis of soluble brain proteome of 3×Tg-AD and control mice based on their protein expression profile. Principal component one segregates mice by age and accounts for 40.3% of variability in the dataset, while principal component two clusters mice according to their disease status (18.9% of variance). (E) Proteins driving the differences in proteomes between aged, young, diseased and control mice depicted in brown, pink, navy and light blue colors, respectively.
Figure 1—figure supplement 1.
Figure 1—figure supplement 1.. Assessment of pathology in 3×Tg-AD mice used in this study.
(A) Thioflavin S staining of brain sections from 3×Tg-AD and control mice was performed for each analyzed time point to monitor the aggregation of fibrillar material with β-pleated sheet conformation. Accumulation of Aβ plaques assayed by thioflavin S staining at each analyzed time point in 3×Tg-AD and control mice. Representative images of coronal sections including the hippocampal formation with the subiculum were acquired. White arrows indicate exemplary Aβ plaques. (B) High magnification images of Aβ plaques in 12 and 18-month-old 3×Tg-AD mice. (C) Assessment of tau phosphorylation at sites S400/T403/S404 by immunoblotting. Soluble fractions of brain proteins obtained from one of the sagittal halves of harvested mouse whole brains (four animals per background and timepoint) were used for the analysis. (D–G) Relative quantification of tau phosphorylation. Slight upregulation of phospho-tau can be observed at the time point 12 months in 3×Tg-AD mice. Significantly different levels of tau phosphorylation were detected at the late stage of the disorder (18 months). All bar charts represent mean ± SD. Statistical significance in the datasets was assessed by Student’s t-test: *p value < 0.05.
Figure 1—figure supplement 2.
Figure 1—figure supplement 2.. Technical reproducibility between biological replicates.
Pearson correlation between biological quadruplicates for each condition and time point.
Figure 2.
Figure 2.. Comparative proteome analysis of 3×Tg-AD and control samples at different stages of AD.
(A, B, C) Activation of biological processes at different stages of the disease assessed by Ingenuity Pathway Analysis (IPA). Heat maps represent activation z-score change over the course of disease progression and indicate pathways that are activated at 6M (A), 12M (B) and 18M (C). Data were obtained from four biological replicates per group for each time point. Z-score is calculated based on experimental protein expression data (log2 AD/control ratio) and the theoretical information stored in the IPA Knowledge Base. Positive value of z-score indicates an activation of biological pathway or function. Distribution of the quantified proteins at 2M (D), 6M (E), 12M (F) and 18M (G) based on log2 ratio AD/Control and p-value (t-test) by time point. The pie charts represent the number of quantified non-regulated proteins (grey), significantly different proteins between 3×Tg-AD and control samples, t-test p-value 0.05 (pink) and significantly regulated proteins with more than 50% expression change in comparison to the control (red). (H–I) Dynamics of protein expression over the course of AD progression for a selection of the most regulated proteins based on their function. Proteins involved in mRNA processing and transport (H) that are upregulated over time and serine protease inhibitors (I) that are downregulated. (J–M) Putative presymptomatic protein markers of the disease. (J) Top 10 significantly up- and downregulated proteins in 3×Tg-AD mice at presymptomatic time point (2M). (K) Immunoblot analysis of most regulated hits. Soluble fractions of brain proteins were analyzed from four 2-month-old control and 3×Tg-AD mice animals, respectively. Hebp1 and Glo1 levels were consistently elevated in the transgenic animals as compared to wild type controls. Ca1 levels were reduced in transgenic animals. Presymptomatic markers that remain up- (L) or downregulated (M) across the AD progression.
Figure 2—figure supplement 1.
Figure 2—figure supplement 1.. Analysis of upstream regulators.
(A) Top five upstream regulators identified by ingenuity pathway analysis (IPA) of complete proteome dataset (log23×Tg-AD vs. control) at each time point. MAPT (tau), APP and PSEN1 were identified as top upstream regulators. (B) Regulated proteins downstream of MAPT, APP and PSEN1 largely overlap (109). (C) Enrichment analysis (IPA) of overlapping proteins reveals their strong association with mitochondrial dysfunction, cell death and oxidative stress. Data are shown for 18-month-old animals. Orange line indicates the p-value cut-off, p<0.05.
Figure 3.
Figure 3.. Hebp1 and Glo1 exhibit increased expression in brains of patients with rapidly-progressing forms of AD.
(A) Immunoblot analysis of Hebp1 and Glo1 expression in slow-progressing (spAD) and rapidly-progressing (rpAD) AD cases and age-matched controls. Samples from nine control, eight slow-progressing AD and eight rapidly-progressing AD patients were used in this study. Detailed information on the patients is presented in Table 2. Quantification of (B) Hebp1 and (C) Glo1 levels in human samples. Error bars in graphs represent mean ± SD. Statistical significance in the datasets was assessed by one-way ANOVA followed by Bonferroni’s multiple comparisons test for individual pairs of samples (α = 0.05): *p<0.025, **p<0.01, and ***p<0.0001.
Figure 3—figure supplement 1.
Figure 3—figure supplement 1.. HEBP1 expression in publicly available transcriptome databases of Alzheimer’s disease.
In silico analysis of HEBP1 mRNA expression in AD patients and matched controls based on publicly available data from Harvard Brain Tissue Resource Center (HBTRC) deposited on GeneNetwork (www.genenetwork.org) (see Materials and methods for details). HEBP1 expression in prefrontal cortex (A), primary visual cortex (B) and cerebellum (C) is significantly elevated in AD patients. Violin plots represent all analyzed values. Dashed and dotted red lines indicate median and the 25th or 75th percentile, respectively. Number of patients per group is indicated at the x-axes on the graphs. Mann-Whitney test was used to assess statistical significance.
Figure 4.
Figure 4.. Analysis of Hebp1 expression in the brain of 3×Tg-AD mice.
(A) Expression of Hebp1 in 12-month-old control and 3×Tg-AD mice by brain region. (B) Hebp1 immunostaining of the fronto-temporal cortex depicting primary motor and somatosensory areas and hippocampus (coronal sections). CA1 region is marked with the white dashed line. (C) Co-staining of Hebp1 with markers of CA1 and dentate gyrus neurons (Ctip2), astrocytes (GFAP) and microglia (IBA-1) in the hippocampus of 3×Tg-AD mice. Hepb1 is expressed predominantly in Ctip2-positive cells of hippocampus (neurons). All images were acquired from 12-month-old control or 3×Tg-AD mice. Scale bar is 100 µm. All data shown are representative of results obtained from three independent experiments.
Figure 4—figure supplement 1.
Figure 4—figure supplement 1.. Expression of Hebp1 in brains of control and 3×Tg-AD mice.
Immunostaining of Hebp1 in the hippocampal region of 3×Tg-AD (27-month-old) and control (24-month-old) mice. Boxed regions in CA1 and dentate gyrus show representative regions where Hebp1 expression was elevated in 3×Tg-AD but not control mice. Scale bar is 500 µm.
Figure 4—figure supplement 2.
Figure 4—figure supplement 2.. Expression of Hebp1 is localized to neurons.
High magnification views of the hippocampus and dentate gyrus brain regions stained with Hebp1, NeuN and GFAP. Hebp1 staining coincides with NeuN but not GFAP. Scale bar is 50 µm.
Figure 5.
Figure 5.. Hebp1 demonstrates perimitochondrial localization in neurons.
(A) Brain fractionation was performed as described before (Huttner et al., 1983). Hebp1 was identified in crude mitochondria fraction (Mt). Fraction annotation: H – homogenate, S1 – supernatant 1, P1 – pellet 1, S2 – supernatant 2 (fraction of soluble proteins), P2 – pellet 2 (synaptosomes), Mt – mitochondria, LP1 – lysate pellet 1 (plasma membrane fraction of synaptosomes), LS1 – lysate supernatant 1 (soluble fraction of synaptosomes). 20 µg of each fraction were loaded on the gel, except for LS1 (6 µg). (B) Mitochondria were isolated from cultured hippocampal neurons as described previously (Wieckowski et al., 2009). Hebp1 was only detected in isolated mitochondria together with Cox4 while markers for endo-lysosomal, synaptic and plasma membrane compartments (Lamp1, tubulin, Stx1, Rab5, Rab6 and VAMP2) were exclusively present in the supernatant. (C) Localization analysis of mitochondria (mitotracker), Hebp1-EGFP and EGFP alone in cultured rat hippocampal neurons (DIV14). Hebp1 puncta is associated with mitochondria. Representative line scans (golden lines in the inserts; location of the numbers correspond to the starting point of each analysis) were traced for EGFP control (D) and Hebp1-EGFP (E–F). Line scan analyses indicate that at least some of the Hebp1-EGFP puncta appear to be contacting mitochondria (E–F). Scale bar is 10 µm. All data shown are representative of results obtained from three independent experiments.
Figure 6.
Figure 6.. Hebp1 interactome reveals its association with mitochondrial contact site complex (MICOS).
(A) Hebp1 interactome obtained by mass spectrometry analysis of proteins co-immunoprecipitated from primary cortical neurons with Hebp1-EGFP or EGFP (negative control). Enrichment of mitochondria contacts site complex (MICOS) proteins (red) or MICOS-associated proteins (orange). Dashed line represents a cut-off for significantly different proteins between Hebp1-EGFP and control pulldown with at least 4-fold change. (B) Validation of Hebp1-Mic60 interaction by immunoblotting. All data shown are representative of results obtained from three independent experiments.
Figure 7.
Figure 7.. Hebp1 mediates neurotoxicity upon heme overload.
(A) Knockout of Hebp1 in neurons by CRISPR/Cas9. (B) Measurement of cytotoxicity using the MultiTox-Glo reagent (Promega) was performed 24 hr after stimulation with 10 µM hemin or vehicle. Hebp1-deficient neurons are resistant to heme-mediated cytotoxicity. Wildtype, control and Hebp1-deficient neurons demonstrate similar elevated cytotoxicity in response to 3 hr treatment with 25 µM tert-butyl hydroperoxide (C) and 1 µM staurosporine (D). (E) Hemin treatment induces significantly higher reduction of mitochondrial potential in Hebp1-deficient neurons in comparison to wildtype and control neurons. Mitochondrial potential was measured using the Mitochondrial Membrane Potential Assay kit (Cell Signaling). All bar charts represent mean ± SEM. Statistical significance in the datasets was assessed by one-way ANOVA followed by Student’s t-test comparison for individual pairs of samples: ***p<0.005 and ****p<0.001. All data shown are representative of results obtained from three independent experiments.
Figure 7—figure supplement 1.
Figure 7—figure supplement 1.. Cytotoxicity is influenced by hemin concentrations rather than cellular levels of Hebp1.
Hippocampal neurons (DIV1) were infected with lentiviruses expressing either EGFP alone or Hebp1-EGFP. Seven days after transduction, the neurons were treated with 5 or 10 µM of hemin or vehicle only. Cell toxicity was assessed 24 hr after the treatment using the RealTime-Glo assay (Promega). The results shown were obtained from six independent experiments. Error bars in graphs represent mean ± SEM. Statistical significance in the datasets was assessed by two-way ANOVA followed with Bonferroni corrections for individual pairs of samples: *p<0.05 and **p<0.005.
Figure 8.
Figure 8.. Neuronal cell death occurs by triggering mitochondrial-dependent apoptotic pathway in Hebp1-expressing neurons.
Western blot analyses of (A and B) CytC and Mic60 leakages and (C) caspase 9 activation in Hebp1-deficient, wildtype and control neurons. Wildtype and control neurons exhibited high levels of activated caspase 9 concomitant with mitochondrial release of CytC and Mic60 into the cytosol (S). Hebp1 release was also coupled with leakage of CytC and Mic60 in these cells. In contrast, Hebp1-deficient neurons displayed no apparent activation of caspase 9 despite leakages of CytC and Mic60 from neuronal mitochondria (Mt). (D) Wildtype, control and Hebp1-deficient neurons were treated with 10 µM hemin for 24 hr. Apoptotic cells were visualized by fluorescence staining corresponding to caspase 3/7 activation (see Materials and methods). Hebp1-deficient neurons demonstrated resistance to apoptosis upon heme overload, whereas wildtype and control neurons exhibited high levels of caspase 3/7 activity. (E) Quantification of the data represented by the images shown in (D). All bar charts represent mean ± SEM. Statistical significance in the datasets was assessed by one-way ANOVA followed by Student’s t-test comparison for individual pairs of samples: ****p<0.001. All data shown are representative of results obtained from three independent experiments.
Figure 9.
Figure 9.. Knockout of Hebp1 in neurons is neuroprotective against hemin and/or Aβ42-induced neuronal cell death.
(A) Wildtype, control and Hebp1-deficient neurons were treated with 10 µM hemin or 10 µM Aβ42 oligomers or both simultaneously (10 µM each). Apoptotic cells were observed for caspase 3/7 activation via fluorescence staining (see Materials and methods). Hebp1-deficient neurons showcased resistance to apoptosis upon heme and/or Aβ42 overload, with wildtype and control neurons exhibiting opposing effects of highly elevated caspase 3/7 activity. (B) Quantification of the data represented by the images shown in (A). All bar charts represent mean ± SEM. Statistical significance in the datasets was assessed by two-way ANOVA followed with Bonferroni corrections for individual pairs of samples: ****p<0.001. All data shown are representative of results obtained from three independent experiments.

References

    1. Alkallas R, Fish L, Goodarzi H, Najafabadi HS. Inference of RNA decay rate from transcriptional profiling highlights the regulatory programs of Alzheimer's disease. Nature Communications. 2017;8:909. doi: 10.1038/s41467-017-00867-z. - DOI - PMC - PubMed
    1. Atamna H. Heme, iron, and the mitochondrial decay of ageing. Ageing Research Reviews. 2004;3:303–318. doi: 10.1016/j.arr.2004.02.002. - DOI - PubMed
    1. Atamna H, Brahmbhatt M, Atamna W, Shanower GA, Dhahbi JM. ApoHRP-based assay to measure intracellular regulatory heme. Metallomics. 2015;7:309–321. doi: 10.1039/C4MT00246F. - DOI - PMC - PubMed
    1. Atamna H, Boyle K. Amyloid-beta peptide binds with heme to form a peroxidase: relationship to the cytopathologies of Alzheimer's disease. PNAS. 2006;103:3381–3386. doi: 10.1073/pnas.0600134103. - DOI - PMC - PubMed
    1. Atamna H, Frey WH. A role for heme in Alzheimer's disease: heme binds amyloid beta and has altered metabolism. PNAS. 2004;101:11153–11158. doi: 10.1073/pnas.0404349101. - DOI - PMC - PubMed

Publication types