. 2019 Nov;254(Pt B):113058.
doi: 10.1016/j.envpol.2019.113058. Epub 2019 Aug 14.

Dairy farm soil presents distinct microbiota and varied prevalence of antibiotic resistance across housing areas

Affiliations

Dairy farm soil presents distinct microbiota and varied prevalence of antibiotic resistance across housing areas

Jinxin Liu et al. Environ Pollut. 2019 Nov.

Abstract

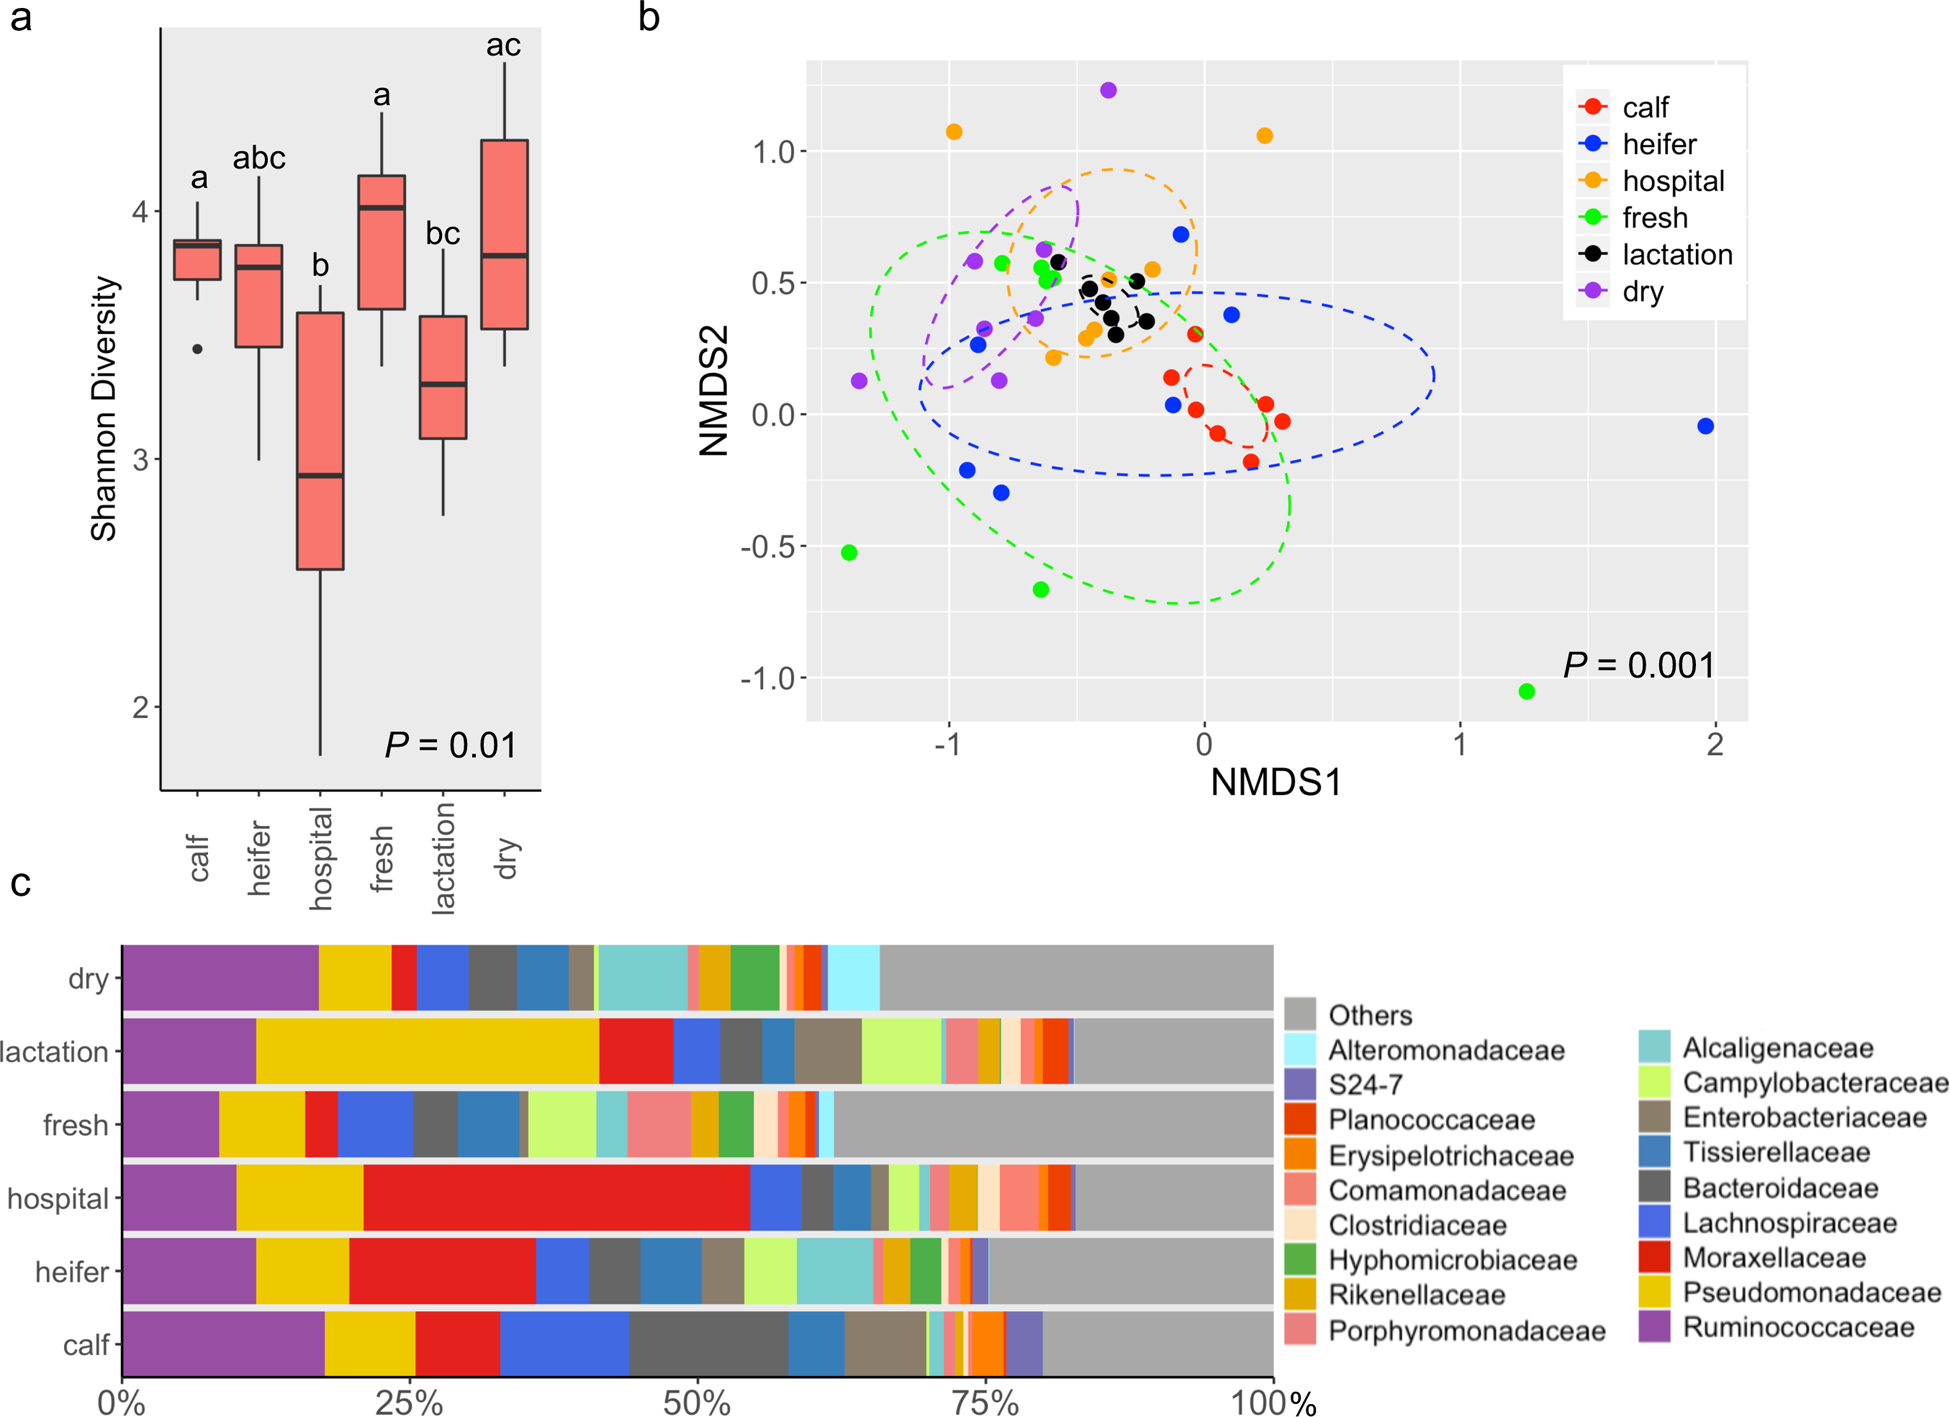
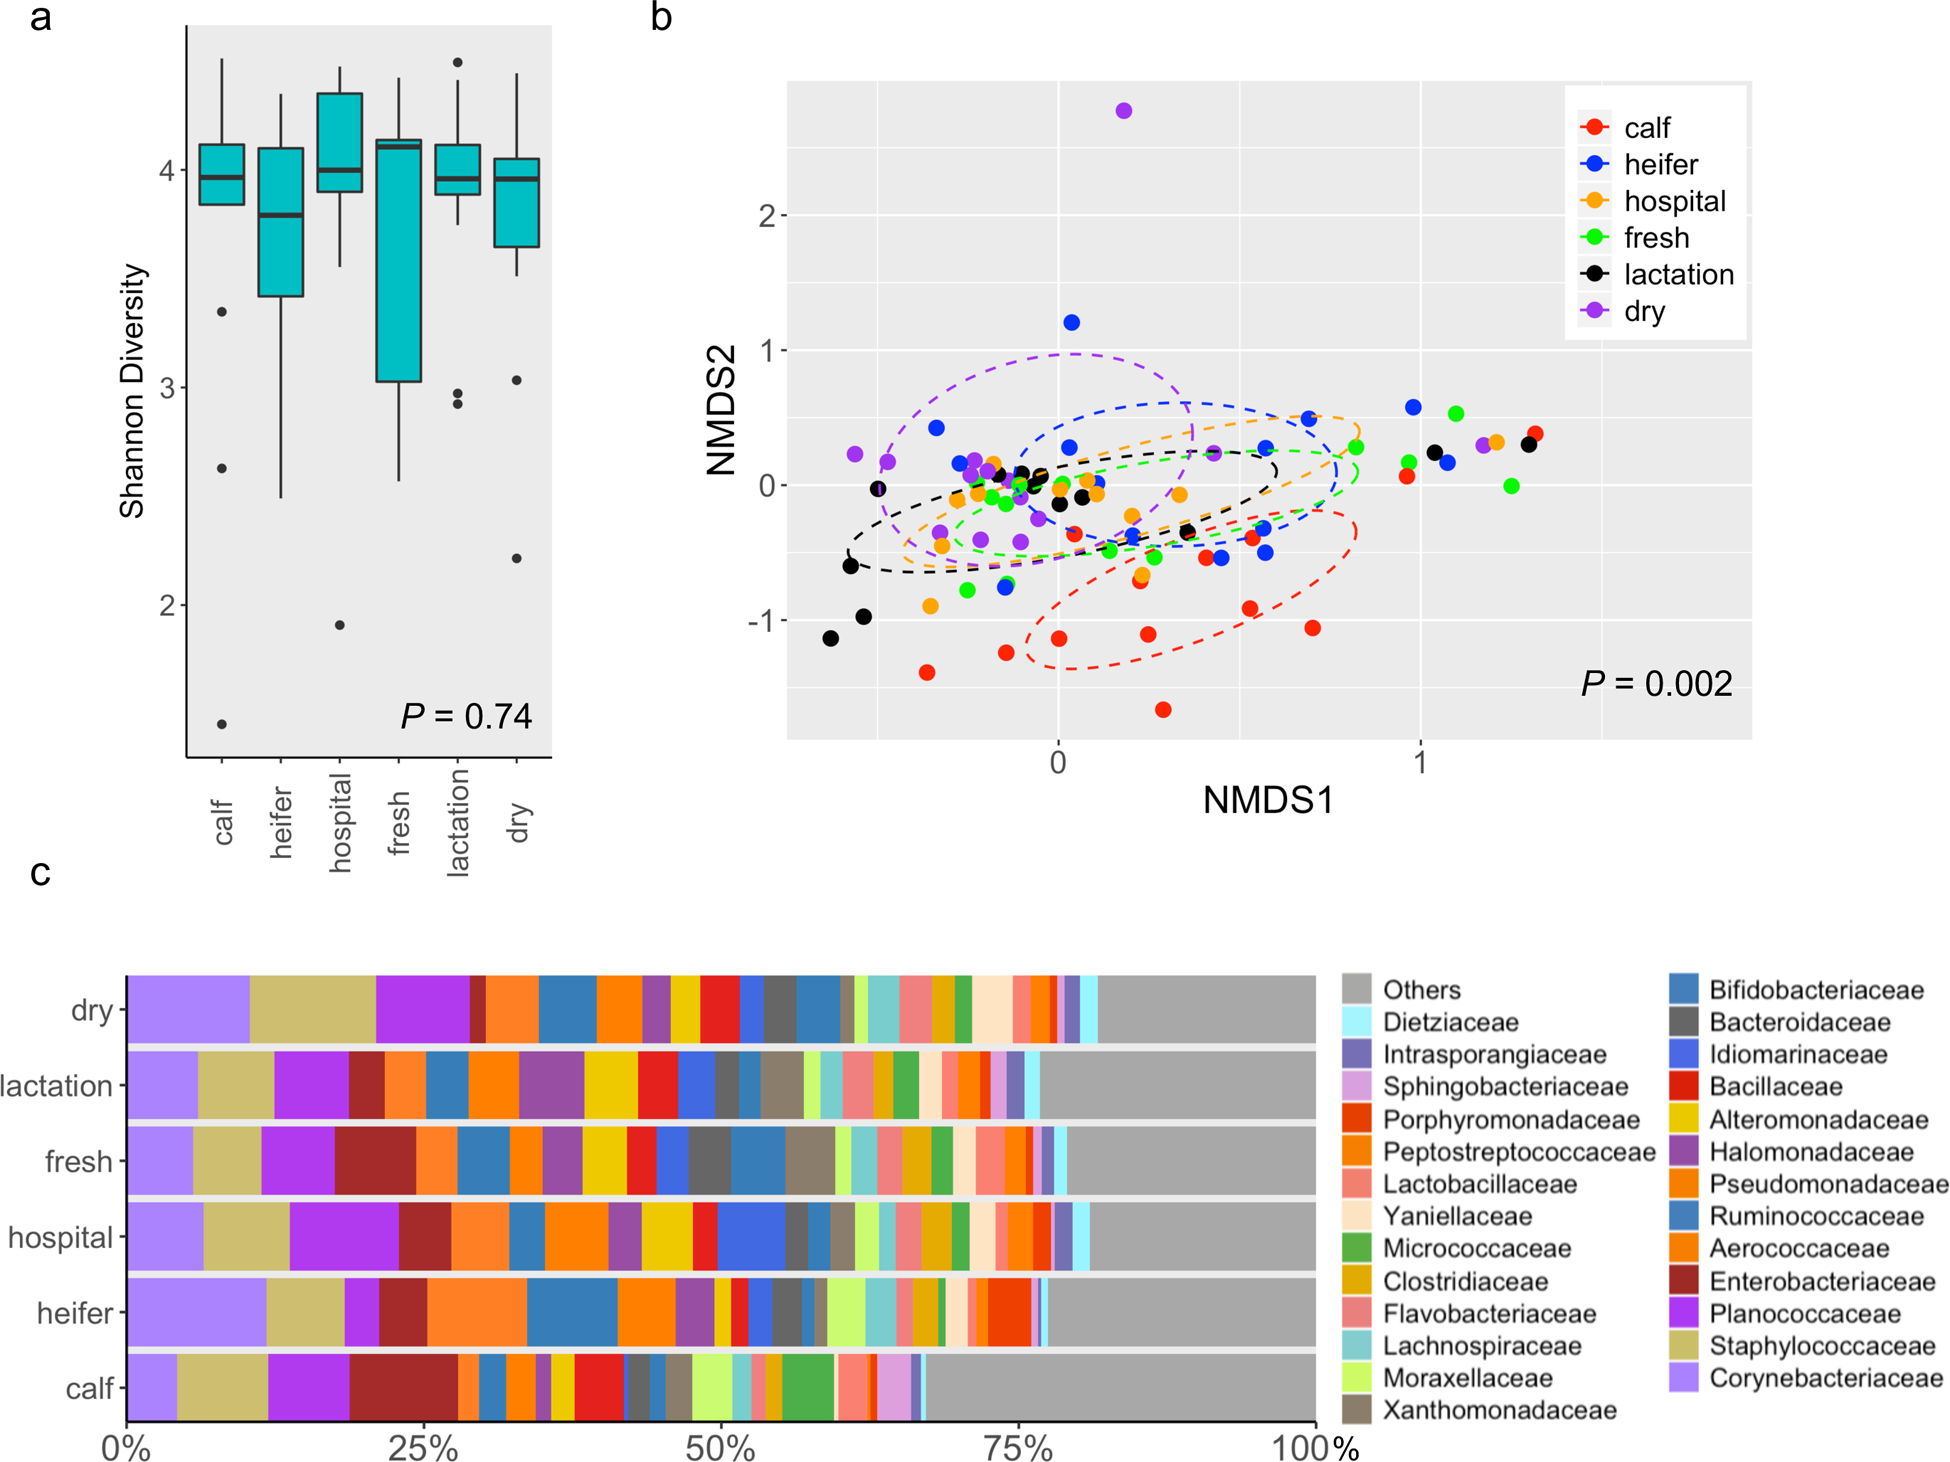
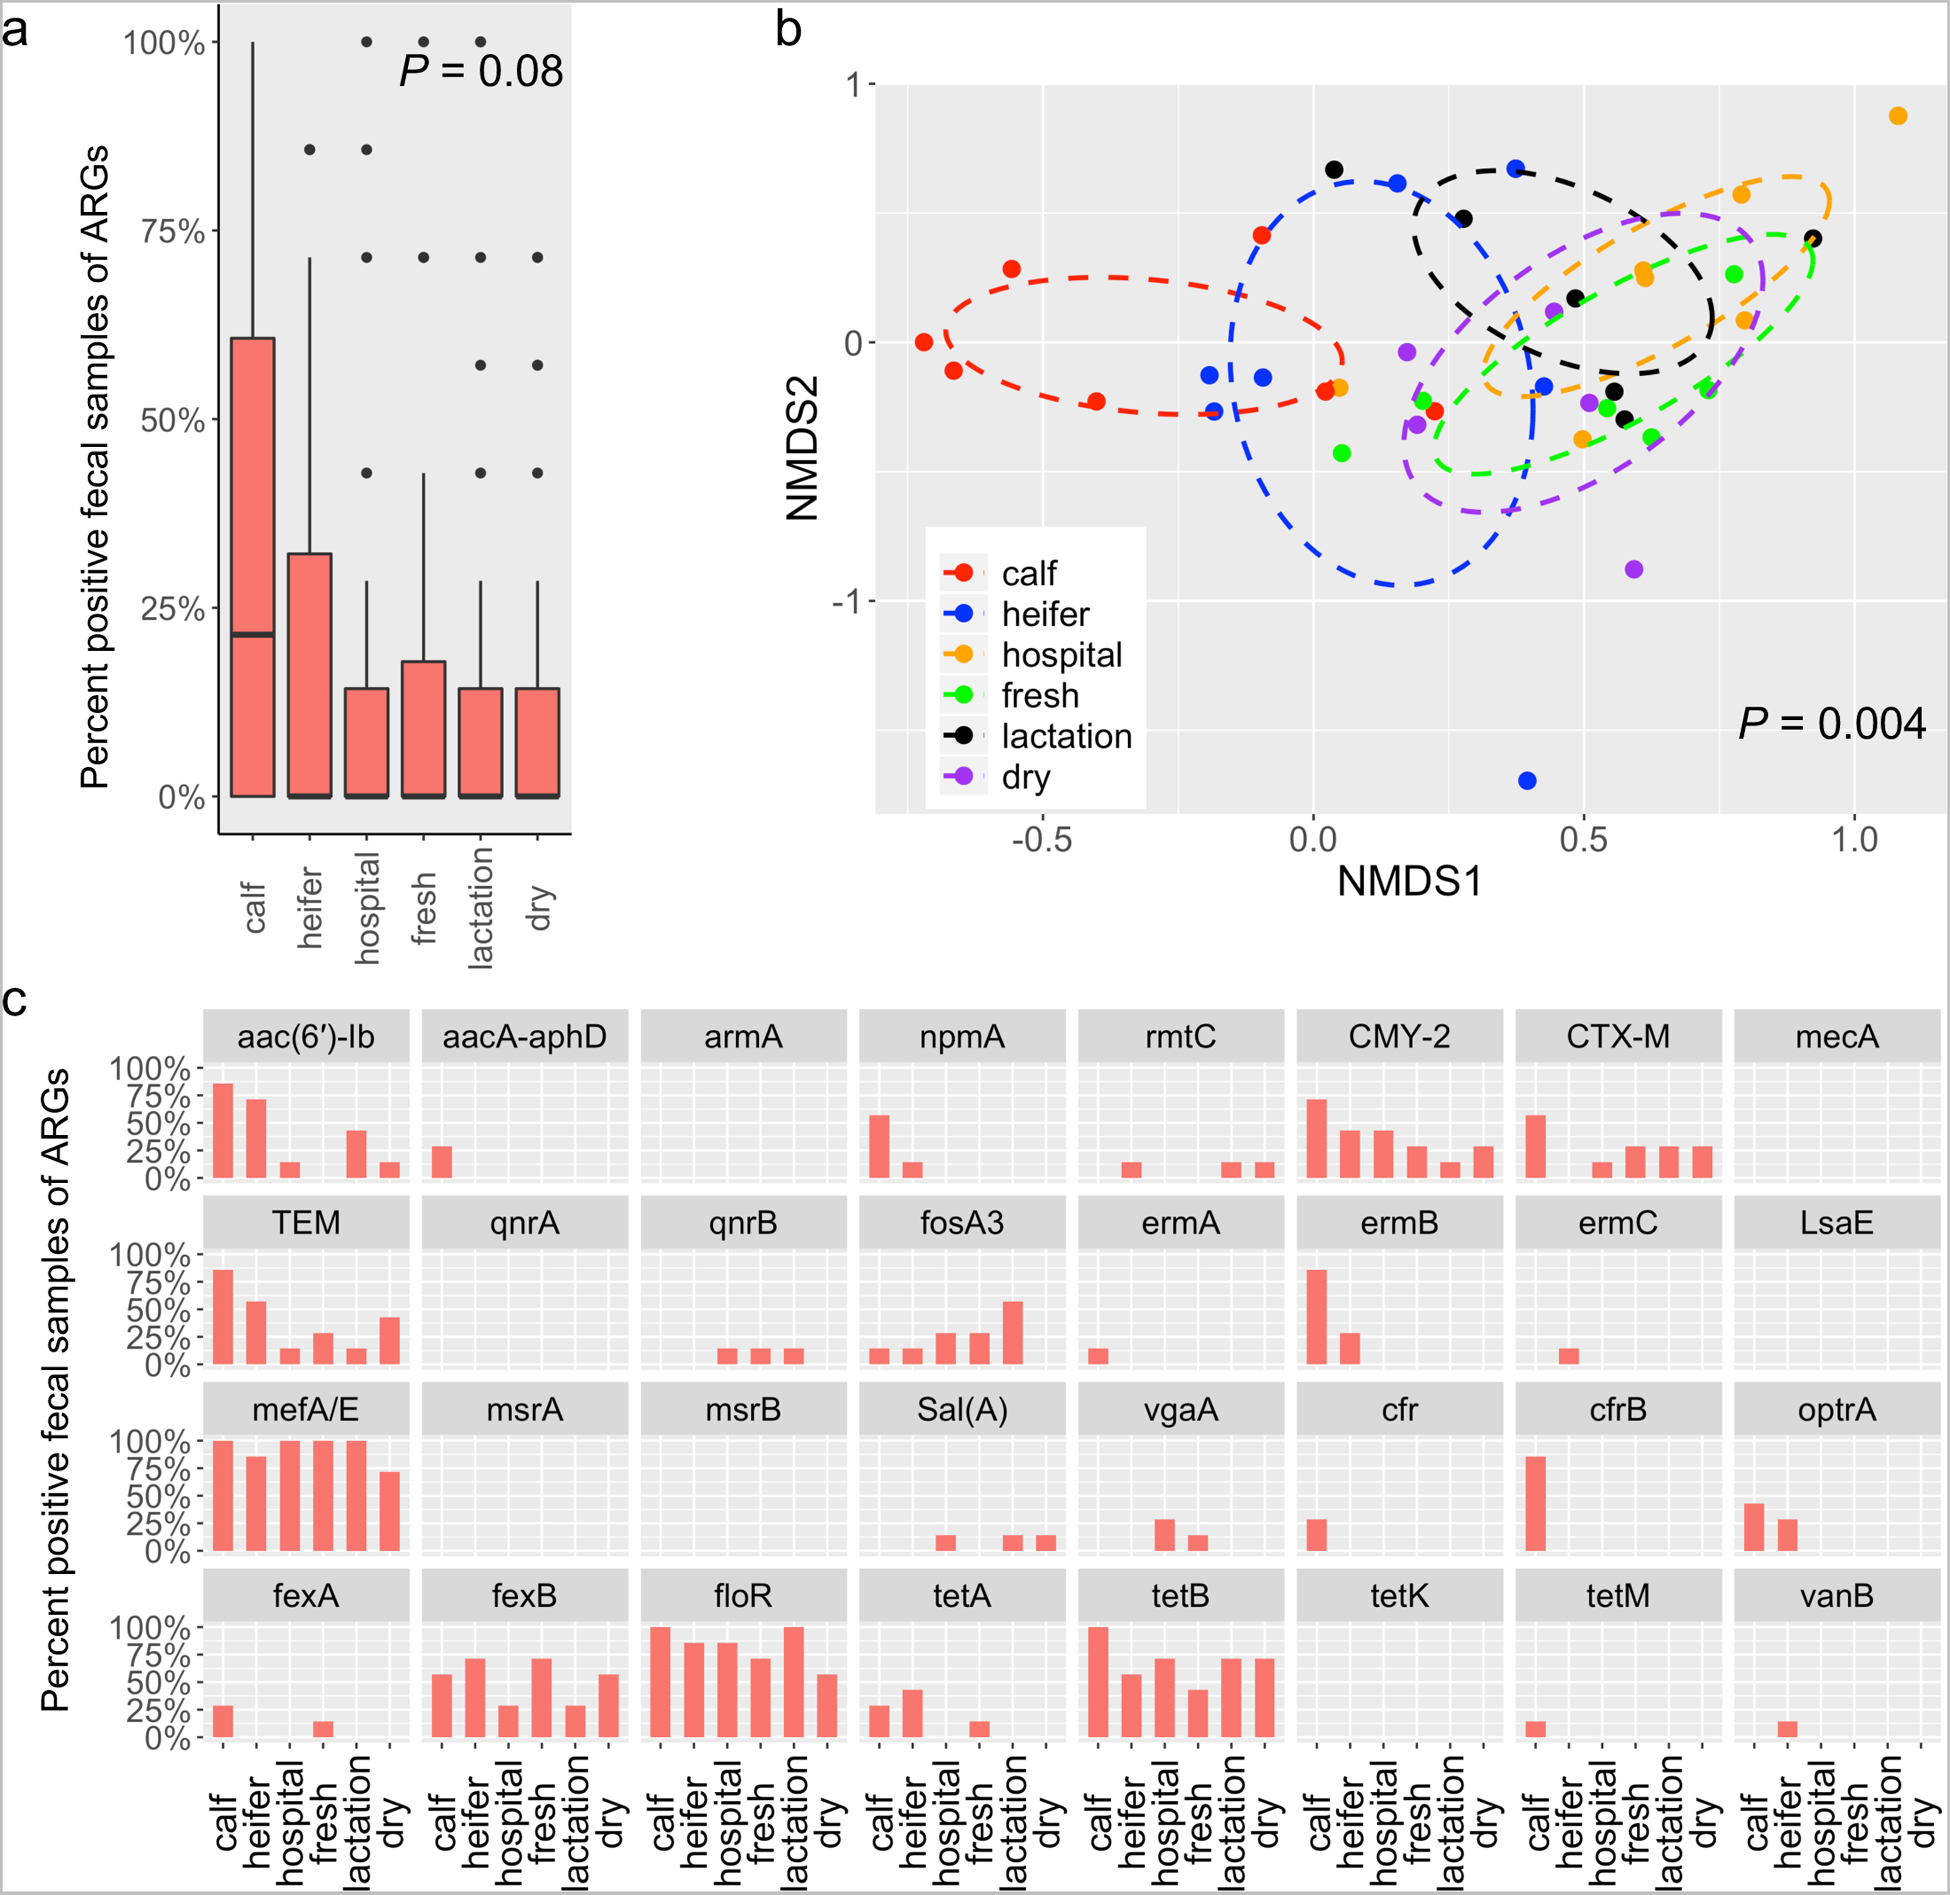
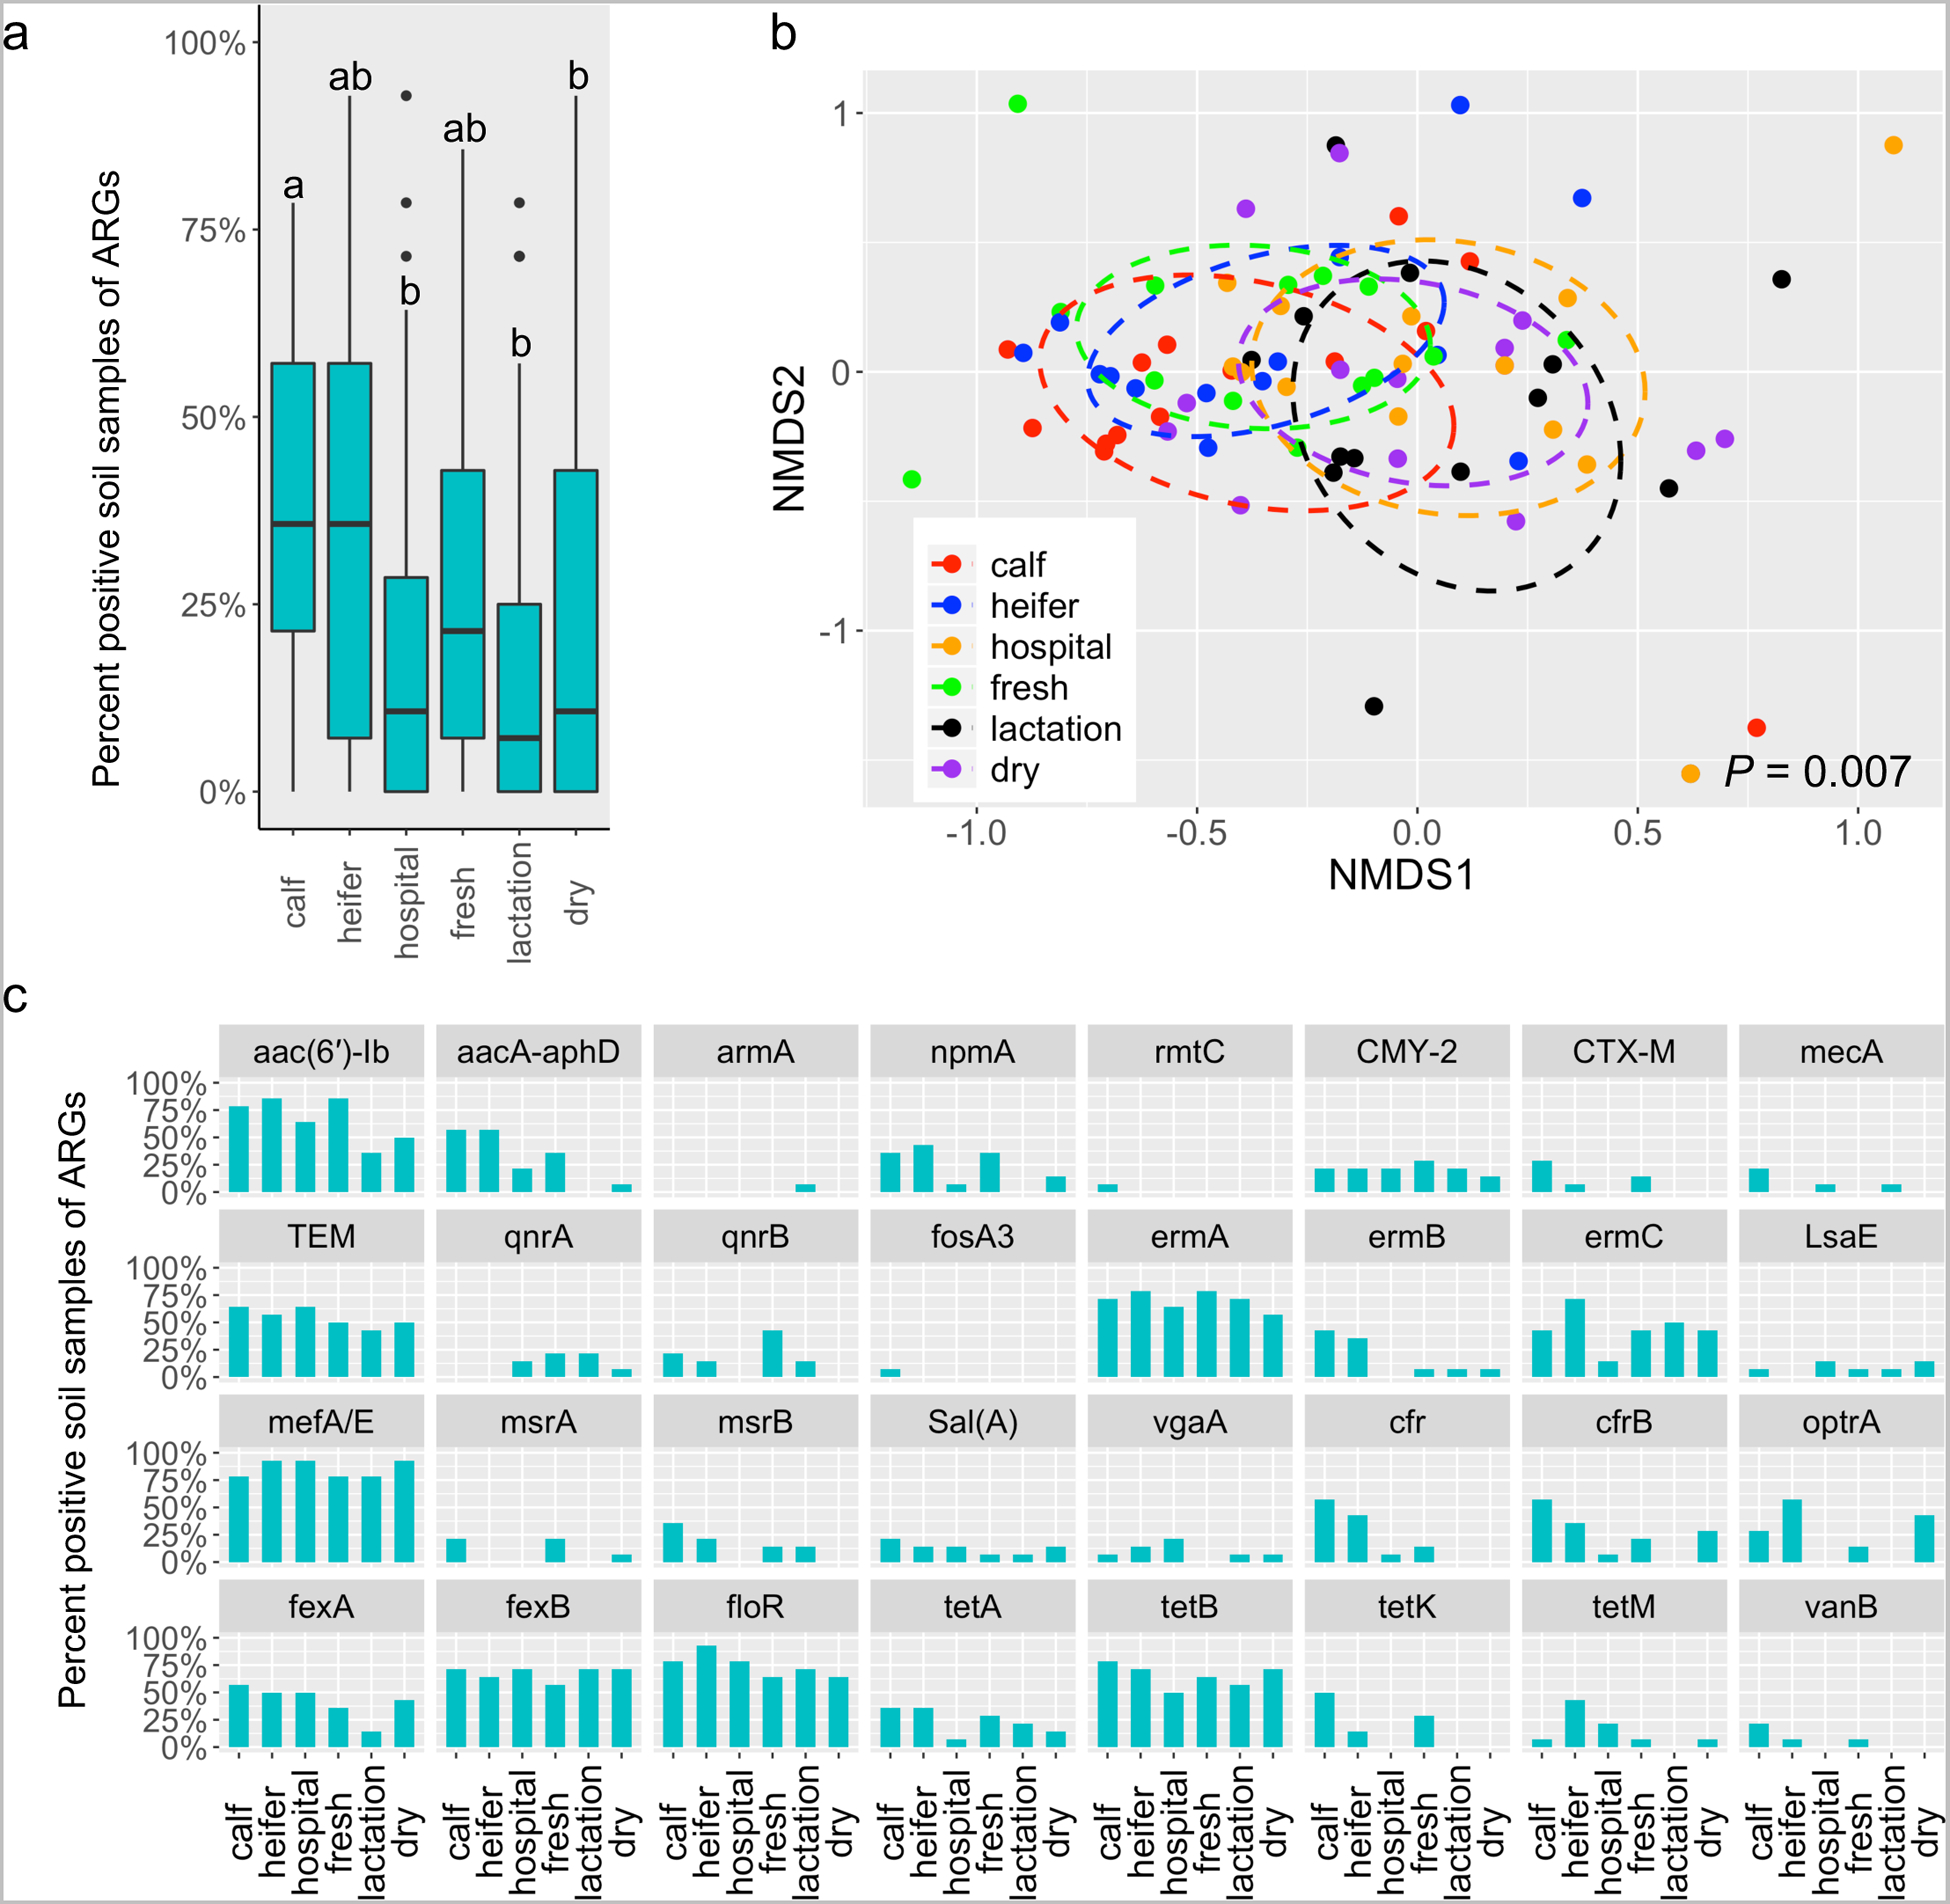
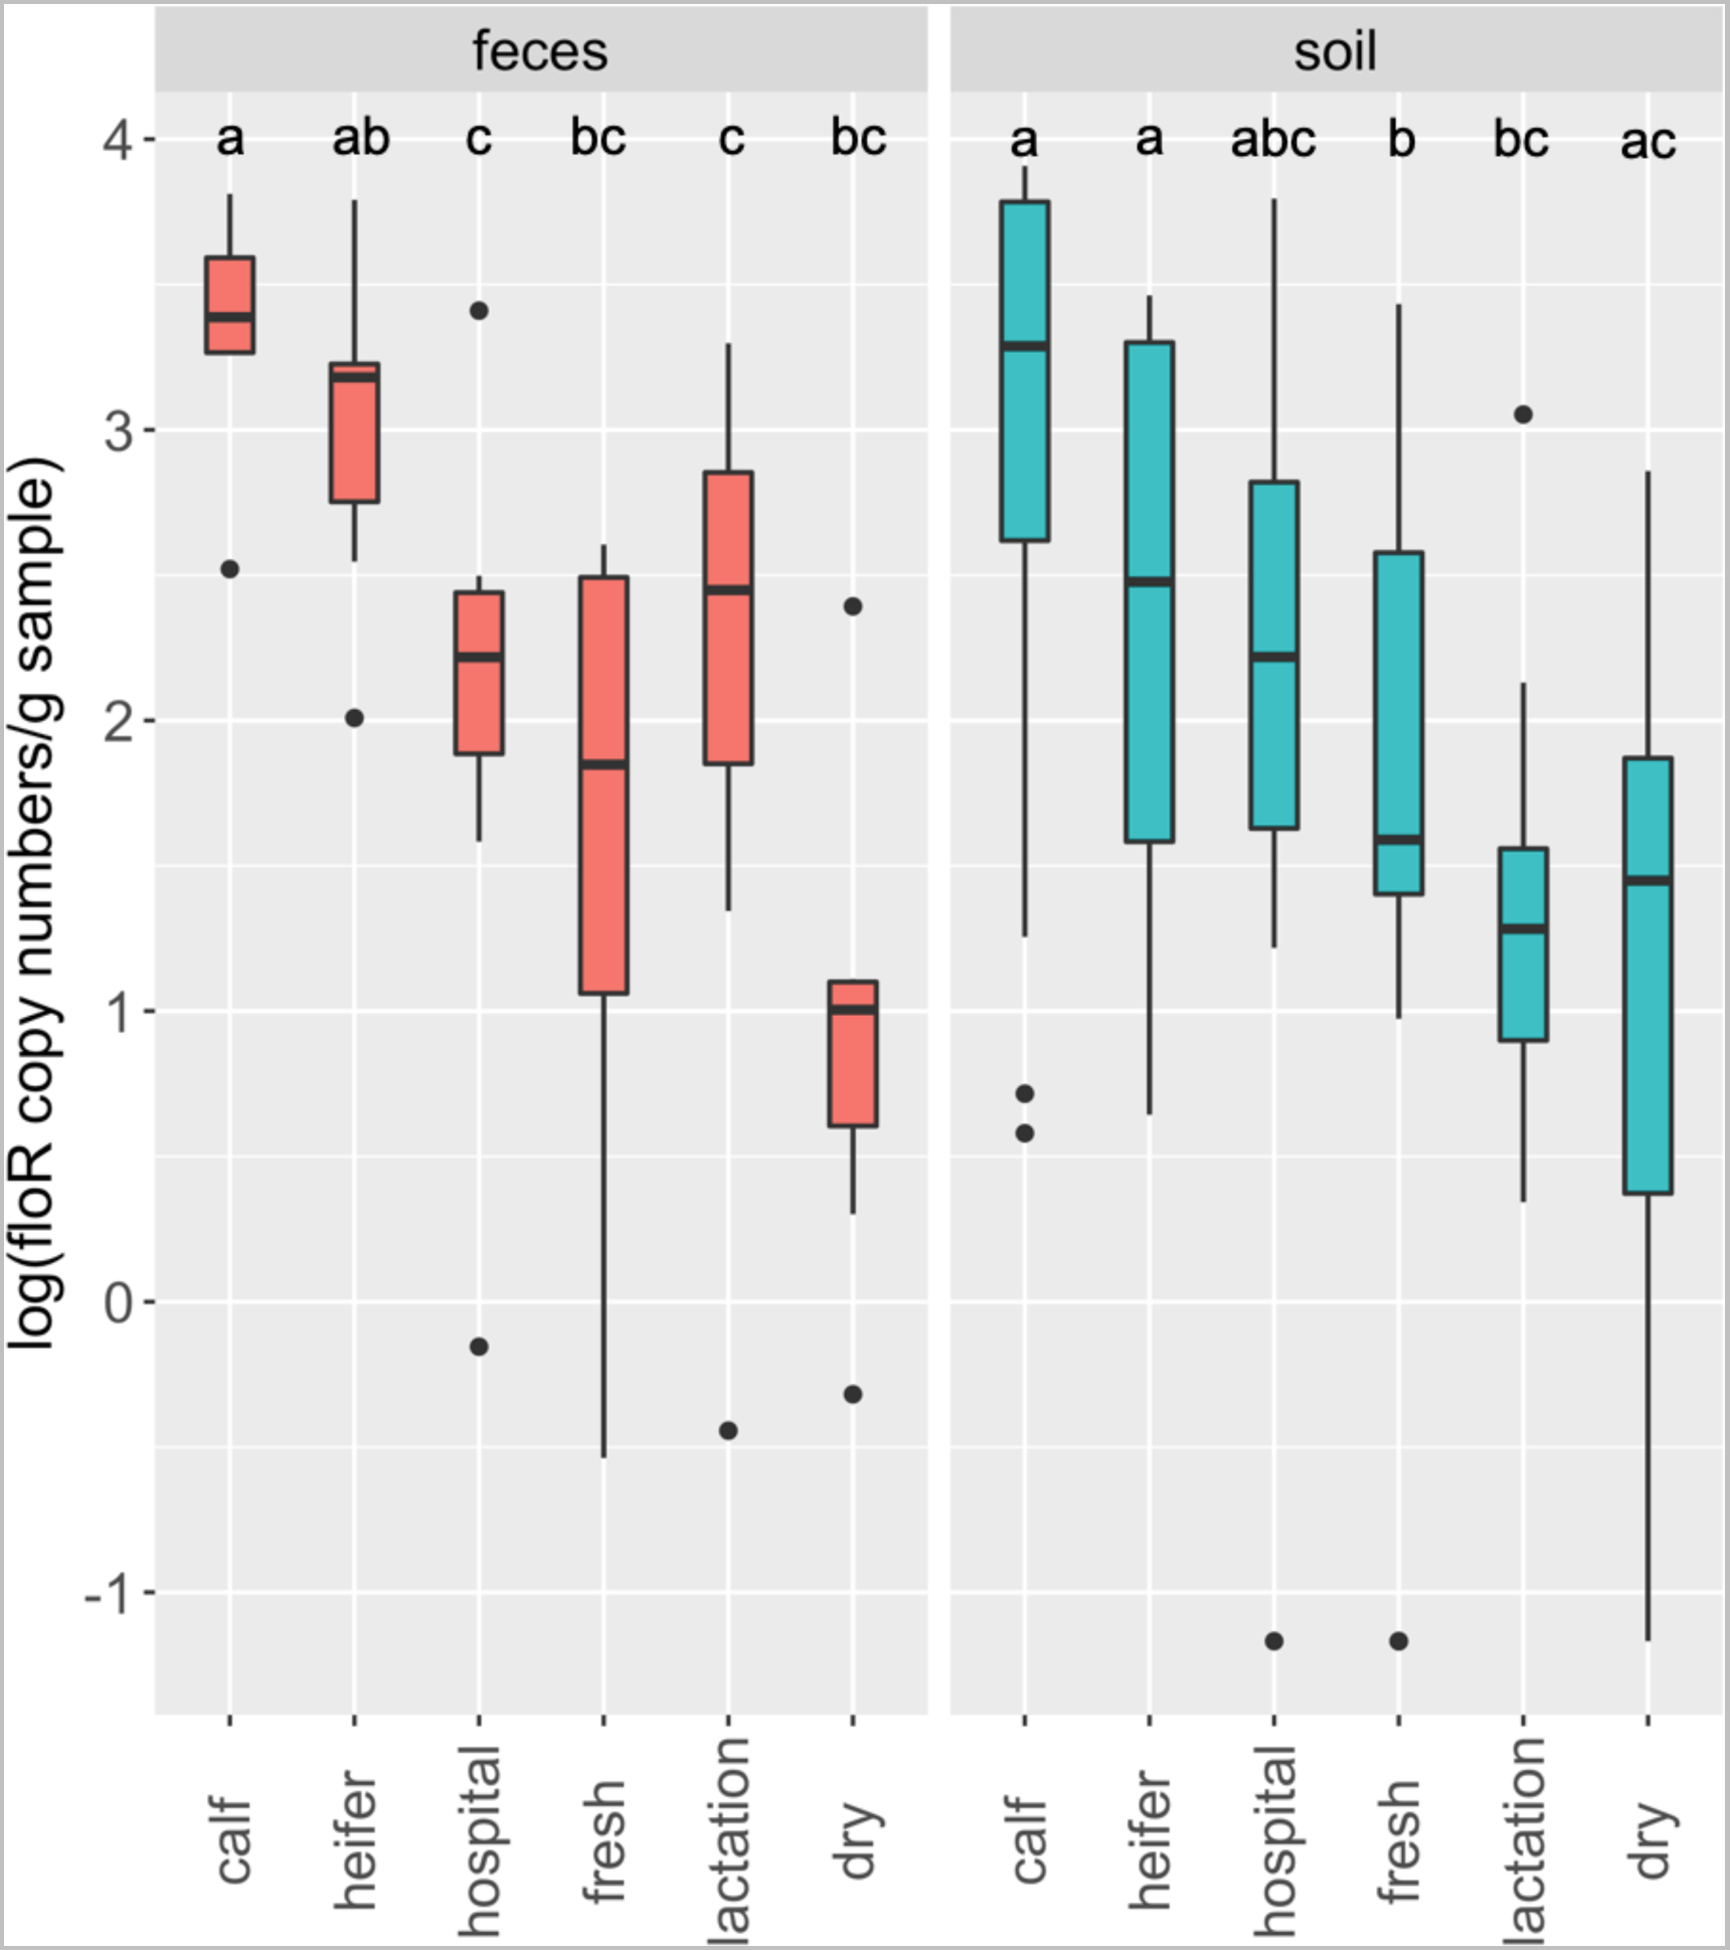
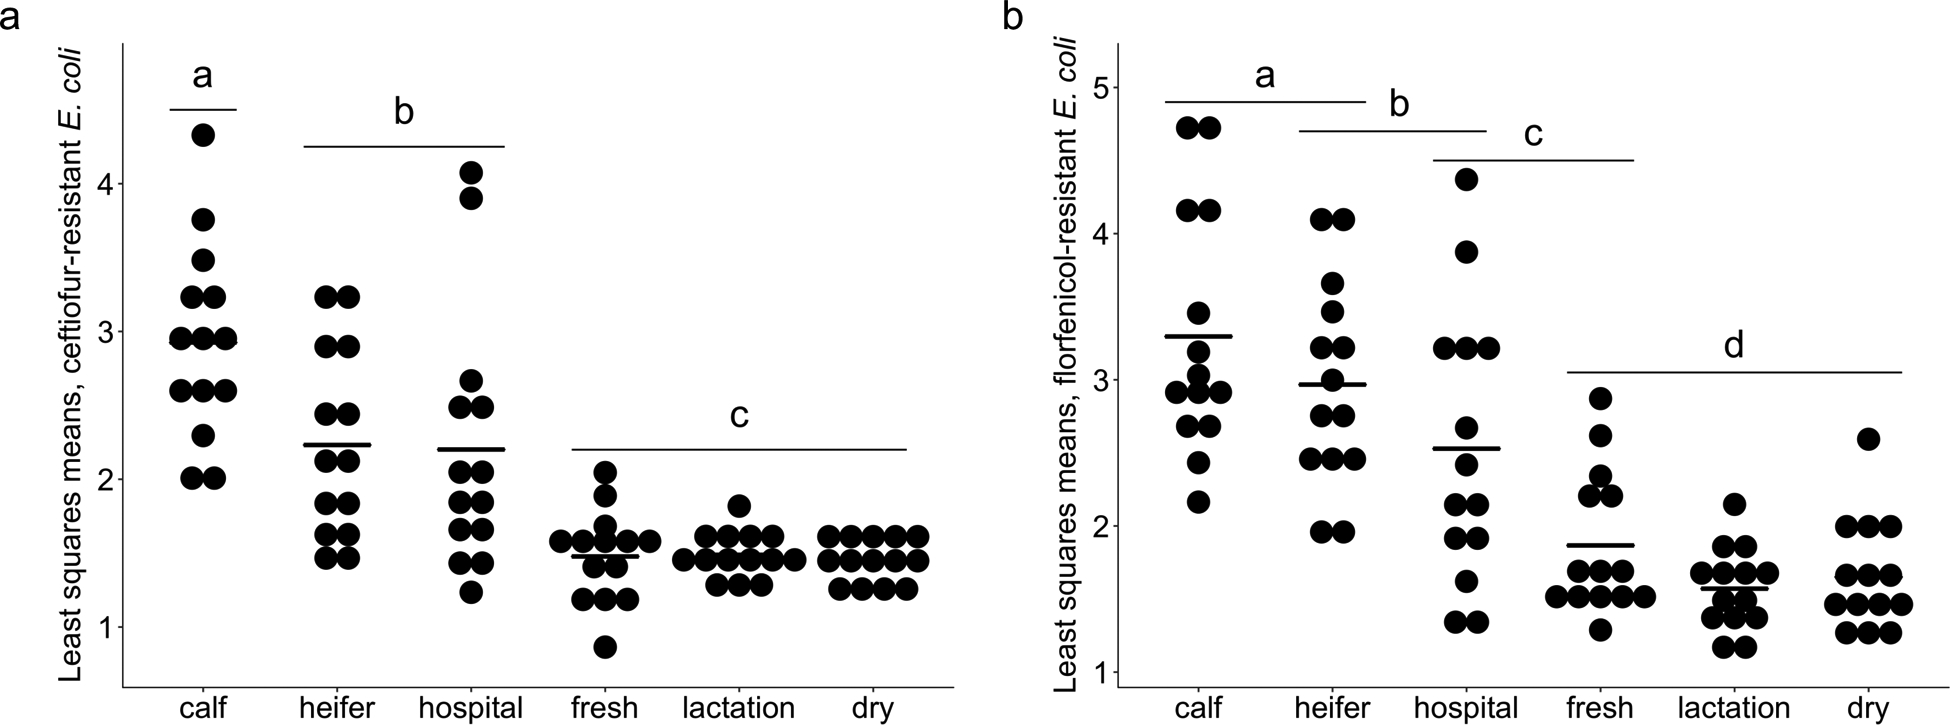
Dairy cattle of different ages experience different living conditions and varied frequency of antibiotic administration that likely influence the distribution of microbiome and resistome in ways that reflect different risks of microbial transmission. To assess the degree of variance in these distributions, fecal and soil samples were collected from six distinct housing areas on commercial dairy farms (n = 7) in Washington State. 16S rRNA gene sequencing indicated that the microbiota differed between different on-farm locations in feces and soil, and in both cases, the microbiota of dairy calves was often distinct from others (P < 0.05). Thirty-two specific antibiotic resistance genes (ARGs) were widely distributed on dairies, of which several clinically relevant ARGs (including cfr, cfrB, and optrA) were identified for the first time at U.S. dairies. Overall, ARGs were observed more frequently in feces and soil from dairy calves and heifers than from hospital, fresh, lactation and dry pens. Droplet-digital PCR demonstrated that the absolute abundance of floR varied greatly across housing areas and this gene was enriched the most in calves and heifers. Furthermore, in an extended analysis with 14 dairies, environmental soils in calf pens had the most antibiotic-resistant Escherichia coli followed by heifer and hospital pens. All soil E. coli isolates (n = 1,905) are resistant to at least 4 different antibiotics, and the PFGE analysis indicated that florfenicol-resistant E. coli is probably shared across geographically-separated farms. This study identified a discrete but predictable distribution of antibiotic resistance genes and organisms, which is important for designing mitigation for higher risk areas on dairy farms.

Keywords: Antibiotic resistance; Calf; Dairy farm; Discrete distribution; Housing areas; Soil.


Figures

Fig. 1
Fig. 1
The fecal microbiota of dairy cattle differs across housing areas. (a) Boxplots of alpha diversity as measured by Shannon diversity index. The Shannon index values were presented as the median (central black horizontal line); the lower and upper hinges correspond to the 25th and 75th percentiles. Outliers are displayed as small black circles. This design applies to all the following boxplots in this study. The data were analyzed by a Kruskal-Wallis test followed by the pairwise Mann-Whitney U-tests for multiple comparisons. Different letters indicate statistically significant groups. (b) 3-D NMDS of dairy fecal samples based on Bray-Curtis matrices (stress = 0.16). The centroid of each ellipse represents the group mean, and the shape was defined by the covariance within each group; this design applies to all the following NMDS plots in this study. The data were analyzed by PERMANOVA followed by pairwise permutation MANOVAs for multiple comparisons. (c) Bar plot depicting the relative abundance of bacterial families over time; bacterial families which has a relative abundance less than 1% were grouped into “Others”.
Fig. 2
Fig. 2
The soil microbiota differs across housing areas on dairy farms. (a) Boxplots of alpha diversity as measured by Shannon diversity index. (b) 3-D NMDS of dairy soil samples based on Bray-Curtis matrices (stress = 0.14). (c) Bar plot depicting the relative abundance of bacterial families over time; bacterial families which has a relative abundance less than 1% were grouped into “Others”.
Fig. 3
Fig. 3
The prevalence of targeted ARGs in fecal samples vary across housing areas. (a) Boxplots of detection rate of ARGs grouped by housing regions. The detection rate was calculated as the ratio of PCR-positive samples divided by total samples. This was applied to all the following analyses in this study. (b) 3-D NMDS ordination of fecal samples based on Jaccard matrices (stress = 0.13). (c) Bar plot depicting the detection rate of individual ARGs across housing areas.
Fig. 4
Fig. 4
The prevalence of targeted ARGs in soil samples vary across housing areas. (a) Boxplots of detection rate of ARGs grouped by housing regions. Different letters indicate statistically significant groups. (b) 3-D NMDS ordination of soil samples based on Jaccard matrices (stress = 0.14). (c) Bar plot depicting the detection rate of individual ARGs across housing areas.
Fig. 5
Fig. 5
The absolute abundance of floR across housing areas in both fecal and soil samples. The data were analyzed by a Kruskal-Wallis test followed by the pairwise Mann-Whitney U-tests for multiple comparisons. Different letters indicate statistically significant groups.
Fig. 6
Fig. 6
Least-squares mean Log10 CFU counts for (a) ceftiofur-resistant and (b) florfenicol-resistant E. coli. Dots represent individual farms and bolded line segments represent least-squares mean for housing type. Different letters indicate statistically significant groups based on a Tukey-Kramer multiple comparison test (P < 0.05).

References

    1. Aarestrup FM, 2015. The livestock reservoir for antimicrobial resistance: a personal view on changing patterns of risks, effects of interventions and the way forward. Philos Trans R Soc Lond B Biol Sci 370, 20140085. - PMC - PubMed
    1. Adhikari B, Besser TE, Gay JM, Fox LK, Davis MA, Cobbold RN, Berge AC, Hancock DD, 2009. The role of animal movement, including off-farm rearing of heifers, in the interherd transmission of multidrug-resistant Salmonella. Journal of Dairy Science 92, 4229–4238. - PubMed
    1. Anderson MJ, Walsh DCI, 2013. PERMANOVA, ANOSIM, and the Mantel test in the face of heterogeneous dispersions: What null hypothesis are you testing? Ecological Monographs 83, 557–574.
    1. Blair JM, Webber MA, Baylay AJ, Ogbolu DO, Piddock LJ, 2015. Molecular mechanisms of antibiotic resistance. Nat Rev Microbiol 13, 42–51. - PubMed
    1. Blickwede M, Schwarz S, 2004. Molecular analysis of florfenicol-resistant Escherichia coli isolates from pigs. J Antimicrob Chemother 53, 58–64. - PubMed