

Patients with Type 2 Diabetes Exhibit a More Mineralized Deep Cartilage Layer Compared with Nondiabetic Controls: A Pilot Study
- PMID: 31455093
- PMCID: PMC8808878
- DOI: 10.1177/1947603519870853
Patients with Type 2 Diabetes Exhibit a More Mineralized Deep Cartilage Layer Compared with Nondiabetic Controls: A Pilot Study
Abstract
Objective: To assess differences in biochemical composition of the deep cartilage layer in subjects with type 2 diabetes mellitus (T2DM) and nondiabetic controls using UTE (ultra-short echo time) T2* mapping and to investigate the association of vascular health and UTE T2* measurements.
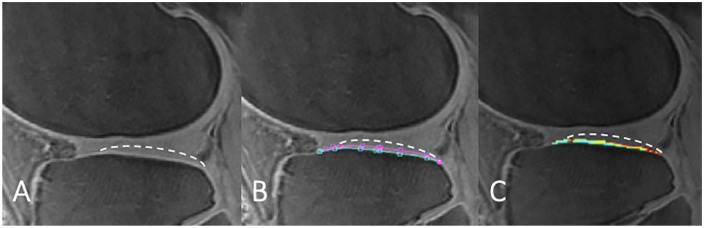
Design: Ten subjects with T2DM matched for age, sex, and body mass index with 10 nondiabetic controls. A 3D UTE sequence with 6 echo times was acquired using 3T magnetic resonance imaging of the knee. For UTE T2* analysis, the deep cartilage layer was segmented and analyzed in 5 compartments (patella, medial, and lateral femur and tibia). The ankle brachial index (ABI) was obtained in all subjects. Linear regression analyses were used to assess associations of T2DM and UTE T2* relaxation times and the associations of ABI measurements and UTE measurements.
Results: Compared with nondiabetic controls, T2DM subjects had significantly lower mean T2*-UTE in the patella (mean difference 4.87 ms; 95% confidence interval [CI] 1.09-8.65; P = 0.015), the lateral tibia (mean difference 2.26 ms; 95% CI 0.06-4.45; P = 0.045), and the lateral femur (mean difference 4.96 ms; 95% CI 0.19-9.73; P = 0.043). Independent of diabetic status, subjects with higher ABI values, indicating better vascular health, had higher T2*-UTE of the patella (coefficient 15.2; 95% CI 3.3-21.4; P = 0.017), the medial tibia (coefficient 9.8; 95% CI 1.0-18.6; P = 0.031), and the lateral femur (coefficient 18.8; 95% CI 3.3-34.3; P = 0.021).
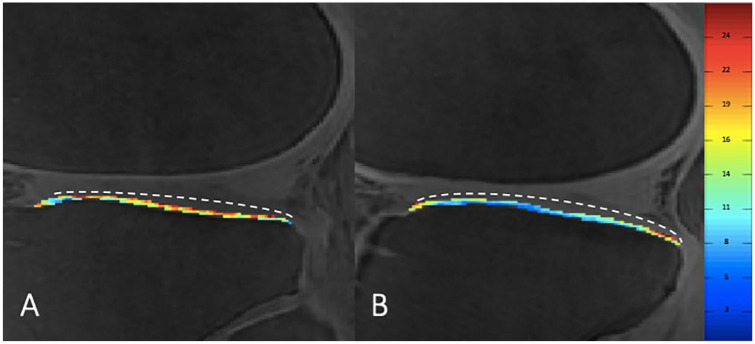
Conclusions: T2*-UTE measurements of the deep cartilage layer were consistently lower in subjects with T2DM and in subjects with impaired vascular health, likely indicating increased mineralization of this layer.
Keywords: MRI; diabetes; knee.
Conflict of interest statement
Figures

Similar articles
-
Articular Cartilage Assessment Using Ultrashort Echo Time MRI: A Review.Front Endocrinol (Lausanne). 2022 May 26;13:892961. doi: 10.3389/fendo.2022.892961. eCollection 2022. Front Endocrinol (Lausanne). 2022. PMID: 35692400 Free PMC article. Review.
-
Association of diabetes mellitus and biochemical knee cartilage composition assessed by T2 relaxation time measurements: Data from the osteoarthritis initiative.J Magn Reson Imaging. 2018 Feb;47(2):380-390. doi: 10.1002/jmri.25766. Epub 2017 May 26. J Magn Reson Imaging. 2018. PMID: 28556419 Free PMC article.
-
Feasibility of ultrashort echo time (UTE) T2* cartilage mapping in the hip: a pilot study.Acta Radiol. 2022 Jun;63(6):760-766. doi: 10.1177/02841851211011563. Epub 2021 Apr 29. Acta Radiol. 2022. PMID: 33926266
-
Comparing the Effect of Mechanical Loading on Deep and Superficial Cartilage Using Quantitative UTE MRI.J Magn Reson Imaging. 2024 Jun;59(6):2048-2057. doi: 10.1002/jmri.28980. Epub 2023 Sep 20. J Magn Reson Imaging. 2024. PMID: 37728325
-
Quantitative Magnetic Resonance Imaging UTE-T2* Mapping of Cartilage and Meniscus Healing After Anatomic Anterior Cruciate Ligament Reconstruction.Am J Sports Med. 2014 Aug;42(8):1847-56. doi: 10.1177/0363546514532227. Epub 2014 May 8. Am J Sports Med. 2014. PMID: 24812196 Free PMC article.
Cited by
-
High levels of glycated haemoglobin (HbA1c) are associated with lower knee joint cartilage quality and higher knee joint symptoms in healthy individuals.Eur J Appl Physiol. 2025 Mar;125(3):885-894. doi: 10.1007/s00421-024-05646-5. Epub 2024 Nov 1. Eur J Appl Physiol. 2025. PMID: 39482452
-
Preliminary study on the assessment of early cartilage degeneration by quantitative ultrashort echo time magnetic resonance imaging in vivo.Quant Imaging Med Surg. 2022 Jul;12(7):3803-3812. doi: 10.21037/qims-21-1181. Quant Imaging Med Surg. 2022. PMID: 35782245 Free PMC article.
-
Ultrashort Echo Time Magnetic Resonance Imaging Techniques: Met and Unmet Needs in Musculoskeletal Imaging.J Magn Reson Imaging. 2022 Jun;55(6):1597-1612. doi: 10.1002/jmri.28032. Epub 2021 Dec 28. J Magn Reson Imaging. 2022. PMID: 34962335 Free PMC article. Review.
-
Making the invisible visible-ultrashort echo time magnetic resonance imaging: Technical developments and applications.Appl Phys Rev. 2022 Dec;9(4):041303. doi: 10.1063/5.0086459. Appl Phys Rev. 2022. PMID: 36467869 Free PMC article. Review.
-
Articular Cartilage Assessment Using Ultrashort Echo Time MRI: A Review.Front Endocrinol (Lausanne). 2022 May 26;13:892961. doi: 10.3389/fendo.2022.892961. eCollection 2022. Front Endocrinol (Lausanne). 2022. PMID: 35692400 Free PMC article. Review.
References
-
- Guariguata L, Whiting DR, Hambleton I, Beagley J, Linnenkamp U, Shaw JE. Global estimates of diabetes prevalence for 2013 and projections for 2035. Diabetes Res Clin Pract. 2014;103:137-49. - PubMed
-
- Centers for Diseases Control and Prevention. National diabetes statistics report. Estimates of diabetes and its burden in the United States. Available from: https://www.cdc.gov/diabetes/pdfs/data/statistics/national-diabetes-stat...
-
- Bijlsma JW, Berenbaum F, Lafeber FP. Osteoarthritis: an update with relevance for clinical practice. Lancet. 2011;377:2115-26. - PubMed
