. 2019 Oct;18(20):2713-2726.
doi: 10.1080/15384101.2019.1656476. Epub 2019 Aug 27.

α-Fodrin is required for the organization of functional microtubules during mitosis

Affiliations

α-Fodrin is required for the organization of functional microtubules during mitosis

Rohith Kumar Nellikka et al. Cell Cycle. 2019 Oct.

Abstract

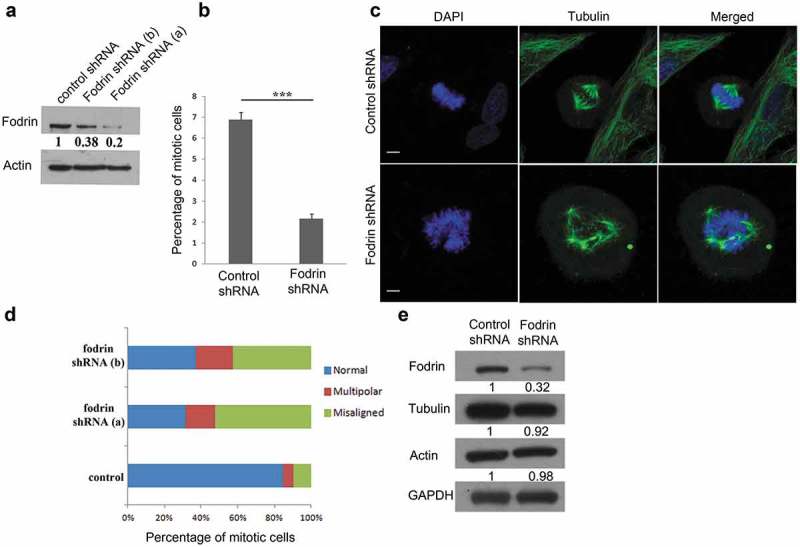
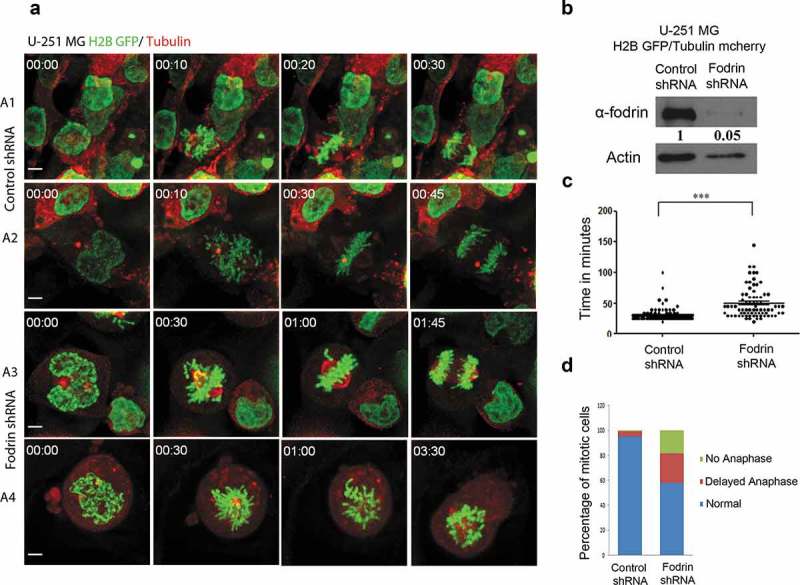
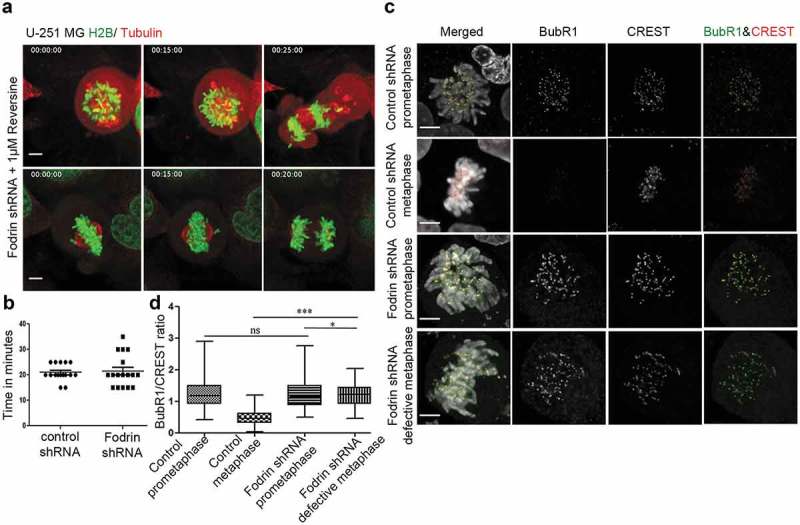
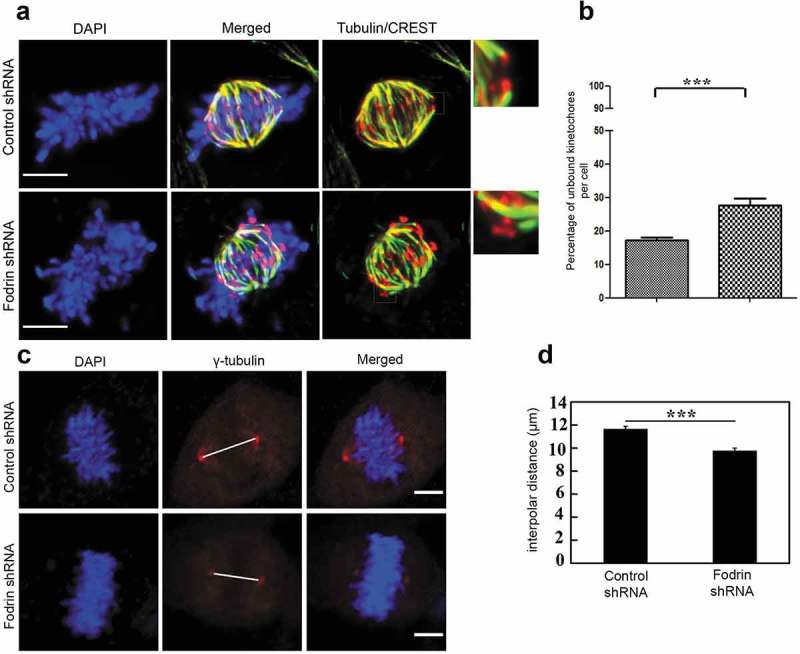
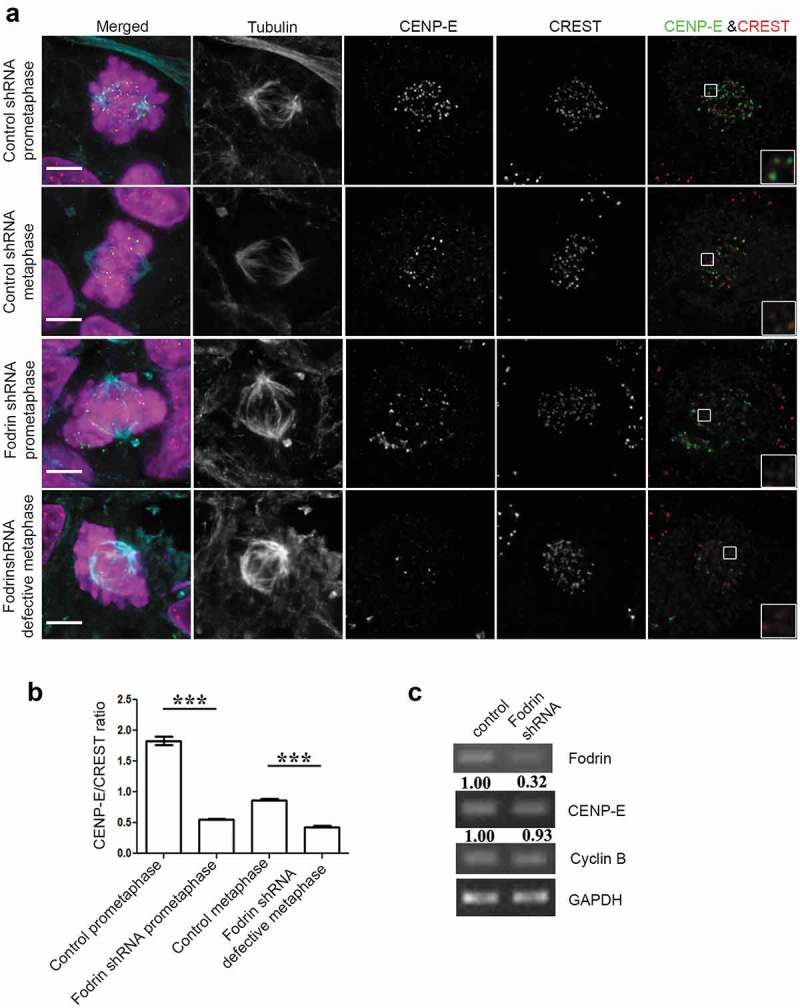
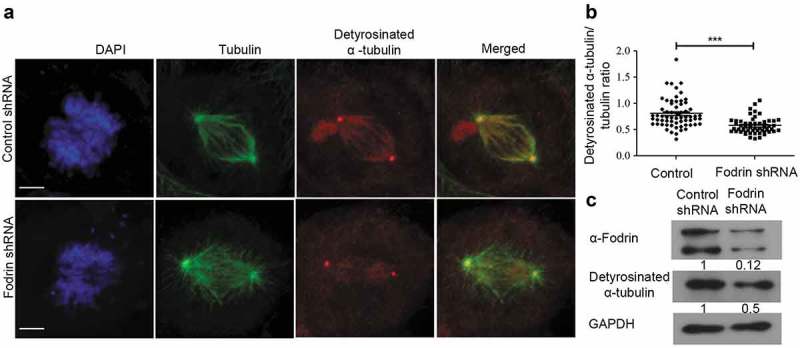
The cytoskeleton protein α-fodrin plays a major role in maintaining structural stability of membranes. It was also identified as part of the brain γ-tubulin ring complex, the major microtubule nucleator. Here, we investigated the requirement of α-fodrin for microtubule spindle assembly during mitotic progression. We found that α-fodrin depletion results in abnormal mitosis with uncongressed chromosomes, leading to prolonged activation of the spindle assembly checkpoint and a severe mitotic delay. Further, α-fodrin repression led to the formation of shortened spindles with unstable kinetochore-microtubule attachments. We also found that the mitotic kinesin CENP-E had reduced levels at kinetochores to likely account for the chromosome misalignment defects in α-fodrin-depleted cells. Importantly, we showed these cells to exhibit reduced levels of detyrosinated α-tubulin, which primarily drives CENP-E localization. Since proper microtubule dynamics and chromosome alignment are required for completion of normal mitosis, this study reveals an unforeseen role of α-fodrin in regulating mitotic progression. Future studies on these lines of observations should reveal important mechanistic insight for fodrin's involvement in cancer.

Keywords: CENP-E; SAC; detyrosinated tubulin; mitosis; spindle; α-Fodrin.


Figures

Figure 1.
Figure 1.
Depletion of α-fodrin leads to abnormal mitosis. (a) Blot showing downregulation of α-fodrin in U-251 MG cell line using single shRNA targeted against fodrin (shRNA a) and mixture of 3 shRNA (shRNA b) with actin as loading control. (b) U-251 MG cells were subjected to α-fodrin downregulation using shRNA for 96 h and cells were fixed using ice cold methanol. They were then stained with α-tubulin antibody and nuclei were stained with DAPI. Quantitative analysis of the percentage of mitotic cells in control and fodrin shRNA-treated cells using shRNA a. (c) Mitotic abnormalities observed in case of fodrin depleted cells using shRNA b. The experiment was repeated thrice. (d) Quantitative analysis of the percentage of normal, misaligned and multipolar cells in control and fodrin shRNA-treated cells. N = 125 and the experiment was repeated thrice. (e) Western blot showing no change in tubulin and actin levels upon fodrin depletion by shRNA with a GAPDH as loading control. For statistical analysis, Student's t-test was carried out and * represents p < 0.05 and *** represents p < 0.001. Scale bar represents 5 μm.
Figure 2.
Figure 2.
α-fodrin depletion causes delayed mitotic progression. U-251 MG H2B-GFP Tubulin-mcherry cells were transfected with either control or fodrin shRNA and post 96 h, live cell imaging was performed and time taken for progression from nuclear envelope breakdown (NEB) to onset of anaphase was calculated. (a) Different time frames of live cell imaging for control and fodrin silenced cells. (b) Blot showing more than 90% downregulation of fodrin in U-251 MG H2B GFP/Tubulin mCherry cells using shRNA a. (c) Graph depicting the time taken in minutes for NEB to onset of anaphase. N = 119 for control and N = 76 for fodrin-depleted cells. Experiment repeated thrice. (d) Bar graph depicting the percentage of cells undergoing normal, delayed and arrested mitotic progression. Sixty minutes and more time taken for nuclear envelope breakdown (NEB) to onset of anaphase was arbitrarily taken as delayed. Cells that stayed more than 3 h or more in metaphase were considered as arrested. Student's t-test was performed and *** stands for p < 0.001. Scale bar represents 5 μm.
Figure 3.
Figure 3.
Activation of spindle assembly checkpoint upon α-fodrin depletion. U-251MG H2B-GFP/Tubulin-mcherry cells were subjected to fodrin downregulation using fodrin shRNA for 96 h as in Figure 2 and they were imaged in 60X objective for 10 h using Nikon Ti epifluorescence microscope with stage saturated with 5% CO2 and maintained at 37°C. When the cells showed abnormalities, they were treated with 1 μM Reversine and imaged for further 6 h. (a) Mitotic cells with abnormalities exit mitosis upon reversine treatment. (b) Graph depicting duration for NEB to anaphase onset in control and fodrin shRNA-treated cells after reversine treatment. N = 16 for control and N = 17 for fodrin-depleted cells. (c) Immunofluorescence imaging of control and fodrin depleted cells. Cells were stained for BubR1 and CREST while DAPI was used for staining of the nucleus. They were then imaged in 60X objective using Zeiss epifluorescence microscope. (d) Box and whiskers plot depicting the increased level of BubR1 localization at the kinetochores of defective metaphases in fodrin downregulated U-251 MG cells. Fifteen kinetochores per cell were taken. A small (however significant) decrease was seen from fodrin-depleted prometaphase cells to defective metaphase cells. Total number of kinetochores N = 200 for downregulated fodrin metaphase condition, N = 250 for other condition. All experiments were repeated thrice. *** stands for p ≤ 0.001 and * stands for p ≤ 0.05. Scale bar represents 5 μm.
Figure 4.
Figure 4.
Depletion of α-fodrin hampers microtubule kinetochore attachment. (a) Immunostaining for tubulin and CREST using 100X objective of Zeiss epifluorescence microscope to determine the microtubule bound kinetochores. The smaller panels in the right side show the zoomed in images of the square boxes of microtubule bound kinetochore in case of control and microtubule unbound kinetochore in case of fodrin-depleted cells. (b) Graph depicting increased percentage of microtubule unbound kinetochore in fodrin downregulated U-251 MG cells. N = 14 for control, N = 15 for fodrin-depleted cells. (c) Immunofluorescence imaging of γ-tubulin in control cells and fodrin shRNA-treated cells to determine interpolar distance. The length of the line between the two centrosomes was considered as the spindle length. (d) Interpolar distance was calculated between the two centrosomes stained by γ-tubulin and measured using ImageJ. N = 50. shRNA treatment conditions are same as in Figure 2. All experiments were repeated thrice. *** stands for p ≤ 0.001. Scale bar represents 5 μm.
Figure 5.
Figure 5.
Fodrin depletion reduces localization of CENP-E at the kinetochore region. (a) U-251 MG cells were subjected to α-fodrin downregulation using shRNA for 96 h and cells were fixed using paraformaldehyde. They were then stained for CREST, CENP-E and tubulin. Scale bar represents 5 μm. Insets show zoomed in portion of CENP-E and CREST staining which clearly suggest a decrease in CENP-E in fodrin-depleted condition. (b) Bar graph representing the CENP-E to CREST ratio. N = 125. (c) Total RNA was prepared from α-fodrin-depleted U-251 MG cells and subjected to qPCR using primers against α-fodrin, GAPDH, Cyclin B and CENP-E. shRNA treatment condition was same as in Figure 2. All experiments were repeated thrice. *** stands for p ≤ 0.001.
Figure 6.
Figure 6.
Effect of α-fodrin silencing on post-translationally modified tubulin. (a) U-251 MG cells were subjected to α-fodrin downregulation using shRNA same as in Figure 2 for 96 h. Cells were fixed using methanol and stained for detyrosinated α-tubulin and α-tubulin. Scale bar represents 5 μm. (b) Graph representing the detyrosinated α-tubulin to α-tubulin ratio. N = 30. (c) Western blot showing fodrin downregulation in absence of calpain inhibitor and levels of detyrosinated α-tubulin with GAPDH as loading control. The lower band in fodrin blot detects cleaved fodrin as is found in most of the fodrin treatments. All experiments were repeated thrice. *** stands for p ≤ 0.001.

References

    1. Zhang R, Zhang C, Zhao Q, et al. Spectrin: structure, function and disease. Sci China Life Sci. 2013;56:1076–1085. - PubMed
    1. Machnicka B, Grochowalska R, Bogusławska DM, et al. Spectrin-based skeleton as an actor in cell signaling. Cell Mol Life Sci. 2012;69:191–201. - PMC - PubMed
    1. Ipsaro JJ, Mondragón A.. Structural basis for spectrin recognition by ankyrin. Blood. 2010;115:4093–4101. - PMC - PubMed
    1. Mutha S, Langston A, Bonifas JM, et al. Biochemical identification of alpha-fodrin and protein 4.1 in human keratinocytes. J Invest Dermatol. 1991;97:383–388. - PubMed
    1. Kim SS, Shetty K, Katuri V, et al. TGF-beta signaling pathway inactivation and cell cycle deregulation in the development of gastric cancer: role of the beta-spectrin, ELF. Biochem Biophys Res Commun. 2006;344:1216–1223. - PMC - PubMed

MeSH terms