. 2019 Aug 28;20(1):677.
doi: 10.1186/s12864-019-6033-2.

Evidence for a non-canonical JAK/STAT signaling pathway in the synthesis of the brain's major ion channels and neurotransmitter receptors

Affiliations

Evidence for a non-canonical JAK/STAT signaling pathway in the synthesis of the brain's major ion channels and neurotransmitter receptors

Kathryn M Hixson et al. BMC Genomics. .

Abstract

Background: Brain-derived neurotrophic factor (BDNF) is a major signaling molecule that the brain uses to control a vast network of intracellular cascades fundamental to properties of learning and memory, and cognition. While much is known about BDNF signaling in the healthy nervous system where it controls the mitogen activated protein kinase (MAPK) and cyclic-AMP pathways, less is known about its role in multiple brain disorders where it contributes to the dysregulated neuroplasticity seen in epilepsy and traumatic brain injury (TBI). We previously found that neurons respond to prolonged BDNF exposure (both in vivo (in models of epilepsy and TBI) and in vitro (in BDNF treated primary neuronal cultures)) by activating the Janus Kinase/Signal Transducer and Activator of Transcription (JAK/STAT) signaling pathway. This pathway is best known for its association with inflammatory cytokines in non-neuronal cells.

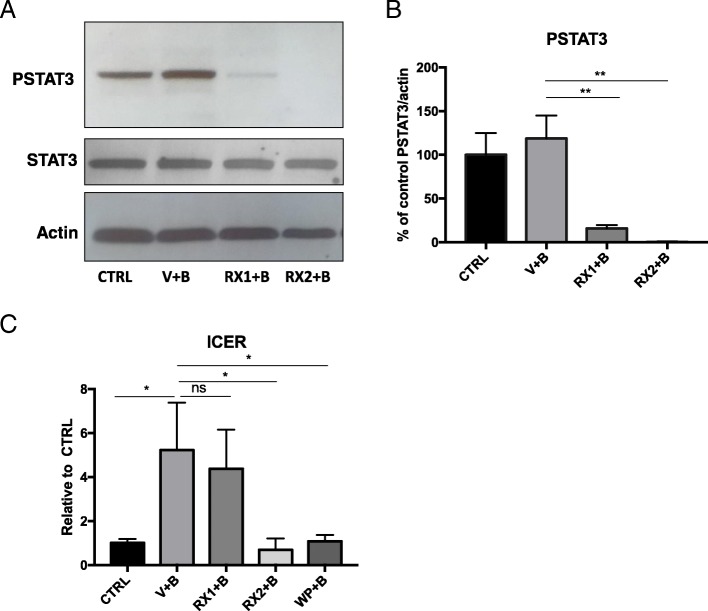
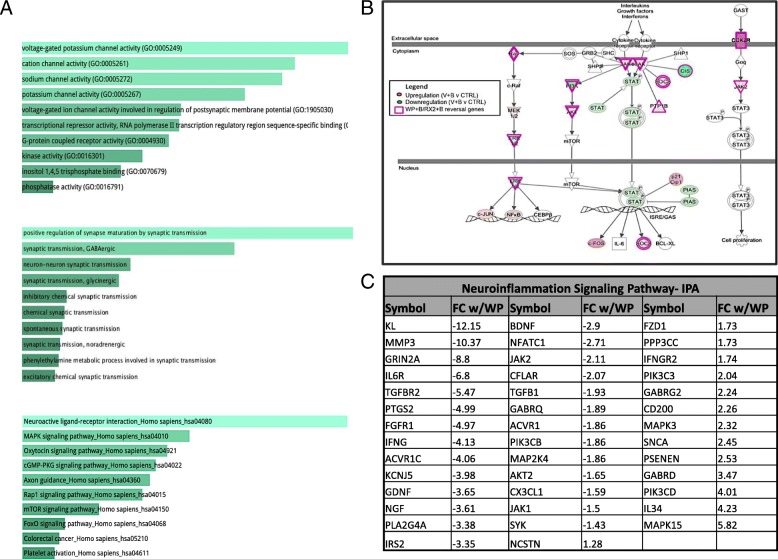
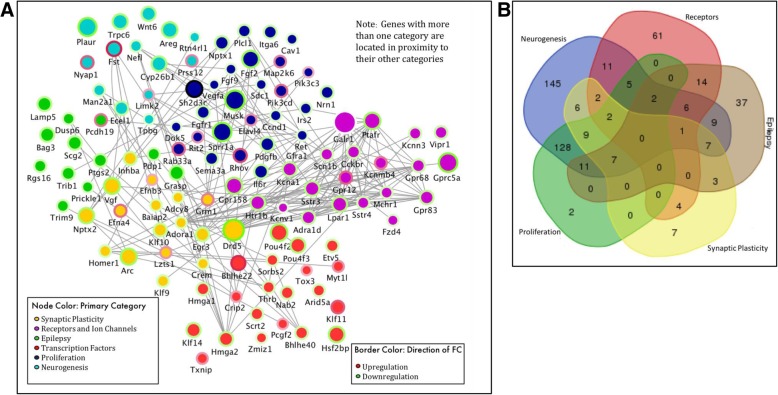
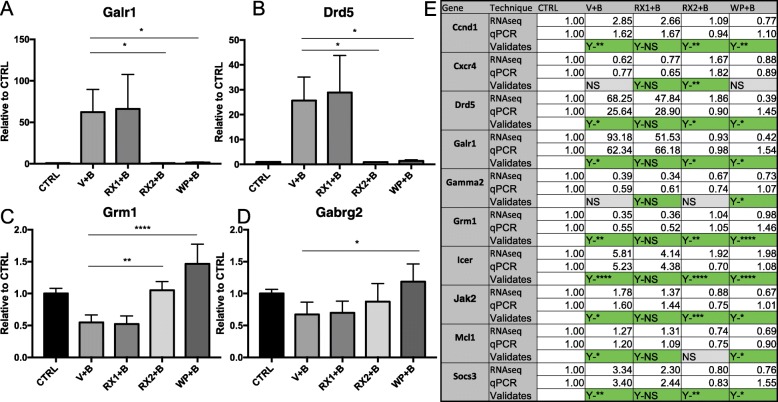
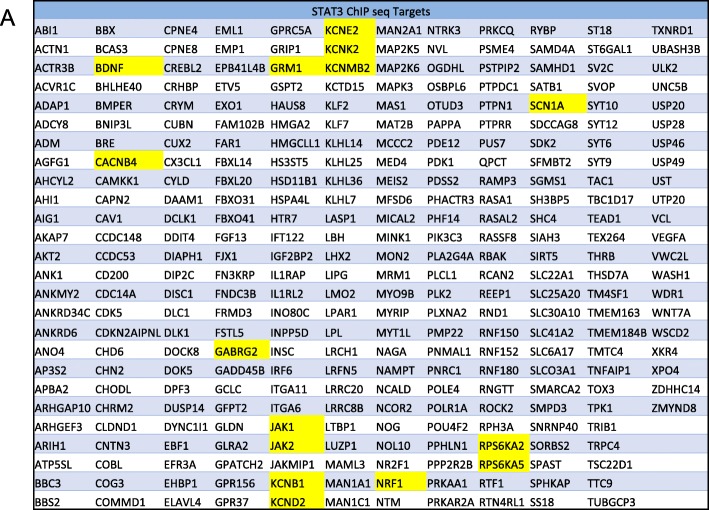
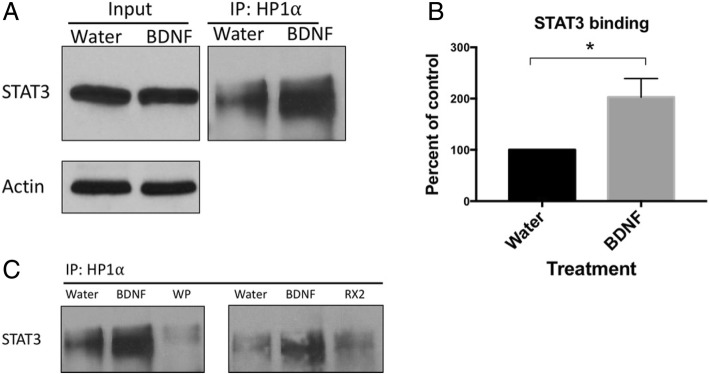
Results: Here, using deep RNA-sequencing of neurons exposed to BDNF in the presence and absence of well characterized JAK/STAT inhibitors, and without non-neuronal cells, we determine the BDNF transcriptome that is specifically regulated by agents that inhibit JAK/STAT signaling. Surprisingly, the BDNF-induced JAK/STAT transcriptome contains ion channels and neurotransmitter receptors coming from all the major classes expressed in the brain, along with key modulators of synaptic plasticity, neurogenesis, and axonal remodeling. Analysis of this dataset has revealed a unique non-canonical mechanism of JAK/STATs in neurons as differential gene expression mediated by STAT3 is not solely dependent upon phosphorylation at residue 705 and may involve a BDNF-induced interaction of STAT3 with Heterochromatin Protein 1 alpha (HP1α).

Conclusions: These findings suggest that the neuronal BDNF-induced JAK/STAT pathway involves more than STAT3 phosphorylation at 705, providing the first evidence for a non-canonical mechanism that may involve HP1α. Our analysis reveals that JAK/STAT signaling regulates many of the genes associated with epilepsy syndromes where BDNF levels are markedly elevated. Uncovering the mechanism of this novel form of BDNF signaling in the brain may provide a new direction for epilepsy therapeutics and open a window into the complex mechanisms of STAT3 transcriptional regulation in neurological disease.

Keywords: BDNF; Epilepsy; HP1α; JAK/STAT; Neurons; RNAseq.


Conflict of interest statement

There are no conflicts of interest for any of the authors on this manuscript.

Figures

Fig. 1
Fig. 1
Schematic of experimental design and analysis. a Timeline representation of the drug treatment protocol, including the 1 h drug or DMSO (vehicle, V) pretreatment (initiated at − 1 h), administration of aqueous BDNF (B) or water (vehicle) treatment (Time = 0 h) and time of cell collection and RNA extraction (4 h). b 6-well plate showing each one of the 5 treatment groups and the abbreviations by which they will be referred to in the text: DMSO+Water (CTRL), DMSO+BDNF (V + B), 100 nM Ruxolitinib+BDNF (RX1 + B), 10 μM Ruxolitinib+BDNF (RX2 + B), 10 μM WP1066 + BDNF (WP + B). c Diagram represents the approach taken to identify differential gene expression (DEG) in response to JAK/STAT pathway inhibition. BDNF through its receptors activates multiple signaling pathways (represented by blue arrows) that impact transcription. Differential expression analysis comparing V + B vs. CTRL treatment groups (green box) will reveal the total set of genes that are regulated by BDNF-induced intracellular signaling pathways. To identify BDNF DEGs that are specific to JAK/STAT signaling, comparisons are made between the groups pretreated with JAK inhibitors (RX1 + B, RX2 + B, WP + B) and the group pretreated with vehicle (V + B) (purple box); DEGs from this comparison (where JAK/STAT inhibition reverses BDNF stimulation or inhibition) are thought to be associated with the JAK/STAT pathway
Fig. 2
Fig. 2
JAK/STAT inhibitors reverse BDNF-induced gene expression. a TOP: Venn diagram representation of all protein-coding genes in the rat genome (in accordance with Strand NGS notation) with all differentially expressed genes (DEGs) between primary neurons treated with DMSO+BDNF vs. DMSO+Water. BOTTOM: Venn diagram representation of all DEGs in DMSO+Water vs. DMSO+BDNF (BDNF, Red, 2869), WP1066 + BDNF vs. DMSO+BDNF (WP1066,Orange, 5170 total) and 10 μM Ruxo+BDNF vs. DMSO+BDNF (RX2, Blue, 5393 total genes). b Receptor and Ion Channel expression is altered by BDNF and rescued by JAK inhibition. TOP: List of Ion Channels and Receptor Subunits whose expression is altered by 4-h BDNF treatment. Color represents direction and degree of fold change (Red: up, Green: down) sorted by receptor or channel type. BOTTOM: Receptor and Ion Channel reversal in expression by addition of WP or RX2 (white receptors are not affected by JAK/STAT inhibitors). Response to BDNF in presence of WP was used as the basis for coloring receptors depicted in the diagram. Red: Upregulated, Green: Downregulated. c Heatmap of all DEGs (columns) associated with Epilepsy (IPA) that are affected by exposure to BDNF. DW: DMSO+Water, DB: DMSO+BDNF, RX1: 100 nM Ruxo+BDNF, RX2:10 μM Ruxo+BDNF, WP: 10 μM WP1066 + BDNF. Green: low expression, red: high expression
Fig. 3
Fig. 3
RX1 and RX2 reduce levels of phospho-STAT3 but only RX2 blocks ICER induction. a Representative Western Blot analysis of whole-cell protein extracts from primary neurons 9 DIV pretreated with100nM Ruxolitinib (RX1), 10uM Ruxo (RX2), or DMSO for 1 h before the addition of BDNF. Cells were collected 30 min after BDNF administration and probed with anti pSTAT3, STAT3 and β-Actin. b Quantitation of signals from densitometry is displayed as mean percent change (±SEM) relative to the DMSO+Water control group (**p < 0.01). Ruxolitinib significantly reduces the levels of P-STAT3 with no change in total STAT3. c Graphical representation of results from real-time PCR analysis using specific Taqman probe and primers. RNA was extracted from cells collected 4 h after BDNF administration. Transcript levels are shown as the mean values (±SEM) of the ratio relative to the DMSO+Water control group for Icer n = 6. Note, that while RX1 blocks pSTAT3, it does not block the effect of BDNF treatment on ICER induction, while WP and RX2 do
Fig. 4
Fig. 4
Pathway Enrichment and Gene Ontology analysis of the overlapping RX2/WP dataset. a Pathways and functions enriched in the list of 1559 genes altered by WP and 10 μM Ruxo (RX2). Gene Ontology and KEGG enrichment analysis performed using EnrichR. b Genes involved in the canonical JAK/STAT signaling pathway with functional representation. Genes are colored by degree of fold change 9 with BDNF alone (see panel legend). Purple border signifies that WP + B and RX2 + B reverse effects of BDNF on gene expression. c List of DEGs involved in neuroinflammatory signaling and degree of fold change of WP + B vs V + B. Listed in order of FC most negative to most positive
Fig. 5
Fig. 5
Functional Network of DEGs involved in epileptogenic-related processes. a Node color represents primary category, determined by order indicated in panel legend. Node size indicates degree of fold change (FC). Border color indicates direction of FC. Gray lines show functional connectivity determined by GeneMania in Cytoscape. Location in network roughly determined by category and multiple associations with neighboring and other categories. (Genes located near the center are involved in multiple categories). b Venn diagram of genes contained in network diagram in A demonstrating overlap of the genes in each category, neurogenesis (blue), receptors (red), epilepsy (gray), synaptic plasticity (yellow), and proliferation (green). Gene associations provided by IPA
Fig. 6
Fig. 6
qRT-PCR validation of BDNF regulated genes in presence of JAK/STAT inhibitors. Primary neurons 9 DIV were pretreated with100nM Ruxolitinib (RX1), 10uM Ruxo (RX2), 10uM WP1066 (WP) or DMSO for 1 h before the addition of BDNF. a-d Graphical representation of selected results of real time PCR analysis using Taqman probe and primers. RNA was extracted from cells collected 4 h after BDNF administration. mRNA levels are shown as the mean values (±SEM) of the ratio relative to DMSO+Water control group for a Galr1 n = 3, b Drd5 n = 3, c Grm1 n = 4, d Gabrg2 n = 4. e Compilation of all genes tested for validation with qRT-PCR represented alphabetically. Values are the ratio relative to DMSO+Water for RNAseq (top row) and qRT-PCR (2nd row) for comparison. Indication of a validating result (3rd row) is marked in green. Results marked with Yes(Y) followed by the level of significance indicate a significant result consistent with RNA-seq. Yes- Not significant (Y-NS) seen in all the RX1 is the expected result consistent with our RNA-seq findings. Measurements that did not reach significance are marked in gray as Not Significant (NS). Significance was tested using One-Way ANOVA followed by Tukey’s test for multiple comparisons. (*p < 0.05, **p < 0.01, ***p < 0.0005, ****p < .0001)
Fig. 7
Fig. 7
The WP + B/RX2 + B overlapping datasets contain previously validated STAT3 ChIP-sequencing target genes. List of all WP + B/RX2 + B genes (308) that are validated STAT3 ChIP-seq targets (as determined by Zhang, et.al, 2013) in alphabetical order. Highlighted in yellow are genes of special interest
Fig. 8
Fig. 8
Binding of HP1⍺ to STAT3 is enhanced by BDNF signaling in neurons. a Representative Western Blot image of coimmunoprecipitation assays using whole-cell extracts of 9-DIV primary cortical neurons treated (30 min) with Water or 0.7 nM BDNF. Protein was precipitated with a specific HP1⍺ antibody (Cell Signaling Technologies #2616) and the elution analyzed by SDS-PAGE. Membrane was immunoblotted with an anti-STAT3 antibody (Cell Signaling Technologies #4904) to detect co-association of HP1⍺ with STAT3, (n = 4). b Quantitation of STAT3 association with HP1⍺ from dataset in “A”. c Representative Western Blot image: Inhibitors of JAK/STAT signaling (WP1066 (WP) and Ruxolitinib 2 (RX2)) reduce HP1α antibody precipitation of STAT3. Data was normalized to βactin levels which did not change upon BDNF treatment, * = p < 0.05

References

    1. Danzer SC. Contributions of adult-generated granule cells to hippocampal pathology in temporal lobe epilepsy: a neuronal bestiary. Brain Plast. 2018;3(2):169–181. - PMC - PubMed
    1. Sutula T, Cascino G, Cavazos J, Parada I, Ramirez L. Mossy fiber synaptic reorganization in the epileptic human temporal lobe. Ann Neurol. 1989;26(3):321–330. - PubMed
    1. Mathern GW, Babb TL, Leite JP, Pretorius K, Yeoman KM, Kuhlman PA. The pathogenic and progressive features of chronic human hippocampal epilepsy. Epilepsy Res. 1996;26(1):151–161. - PubMed
    1. Kullmann DM, Asztely F, Walker MC. The role of mammalian ionotropic receptors in synaptic plasticity: LTP, LTD and epilepsy. Cell Mol Life Sci. 2000;57(11):1551–1561. - PMC - PubMed
    1. Brooks-Kayal AR, Shumate MD, Jin H, Rikhter TY, Coulter DA. Selective changes in single cell GABA a receptor subunit expression and function in temporal lobe epilepsy. Nat Med. 1998;4(10):1166–1172. - PubMed

MeSH terms