

Injection practices in 2011-2015: a review using data from the demographic and health surveys (DHS)
- PMID: 31455315
- PMCID: PMC6712605
- DOI: 10.1186/s12913-019-4366-9
Injection practices in 2011-2015: a review using data from the demographic and health surveys (DHS)
Abstract
Background: Reuse of injection devices to give healthcare injections decreased from 39.8 to 5.5% between 2000 and 2010, but trends since 2011 have not been described. We reviewed results of Demographic and Health Surveys (DHS) to describe injection practices worldwide from 2011 to 2015.
Methods: We searched the DHS Internet site for data published on injection practices conducted in countries from 2011 to 2015, extracted information on frequency (number of healthcare injections per person in the last 12 months) and safety (proportion of syringes and needles taken from a new, unopened package). We compared gender groups and WHO regions in terms of frequency and safety. For countries with data available, we compared injection practices 2004-2010 and 2011-2015.
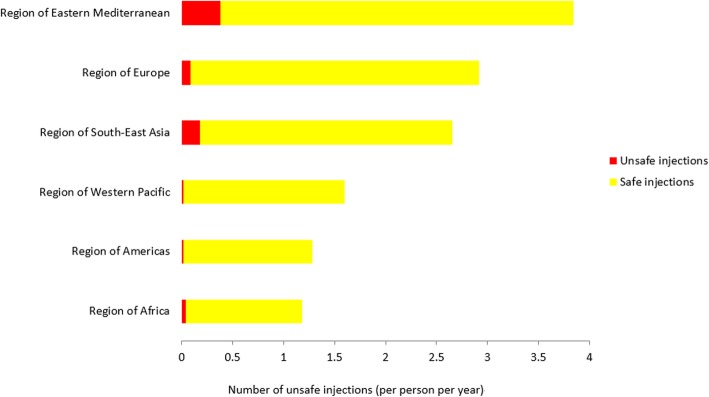
Results: Since 2011, 40 of 92 countries (43%) that conducted DHS surveys reported on injection practices. On average, the frequency of injection was 1.64 per person per year (from 3.84 in WHO Eastern Mediterranean region to 1.18 in WHO African region). Among those, 96.1% of injections reportedly used new injection devices (from 90.2% in the WHO Eastern Mediterranean region to 98.8% in the WHO Western Pacific region). On average, women received more injections per year (1.85) than men (1.41). Among 16 (40%) countries with data in 2004-2010 and 2011-2015, 69% improved in terms of safety. The annual number of unsafe injections reduced in 81% of countries. In Pakistan, the number of unsafe injections was the highest and did not decrease between 2006 and 2012.
Conclusions: Injection practices have continued to improve in most countries worldwide, although the Eastern Mediterranean region in particular still faces unsafe practices that are not improving. Further efforts are needed to eliminate unsafe injection practices in health care settings, including through the use of reuse-prevention devices. Despite some limitations, DHS is an easily available method to measure progress over time.
Keywords: DHS; Demographic and health surveys; Healthcare injection; Injection device; Injection practice; Needle; Syringe; Unsafe injection.
Conflict of interest statement
The authors declare that they have no competing interests.
Figures
References
Publication types
MeSH terms
Grants and funding
LinkOut - more resources
Full Text Sources
