. 2019 Oct 2;39(40):7853-7871.
doi: 10.1523/JNEUROSCI.1364-19.2019. Epub 2019 Aug 27.

Transient Hypoxemia Disrupts Anatomical and Functional Maturation of Preterm Fetal Ovine CA1 Pyramidal Neurons

Affiliations

Transient Hypoxemia Disrupts Anatomical and Functional Maturation of Preterm Fetal Ovine CA1 Pyramidal Neurons

Evelyn McClendon et al. J Neurosci. .

Abstract

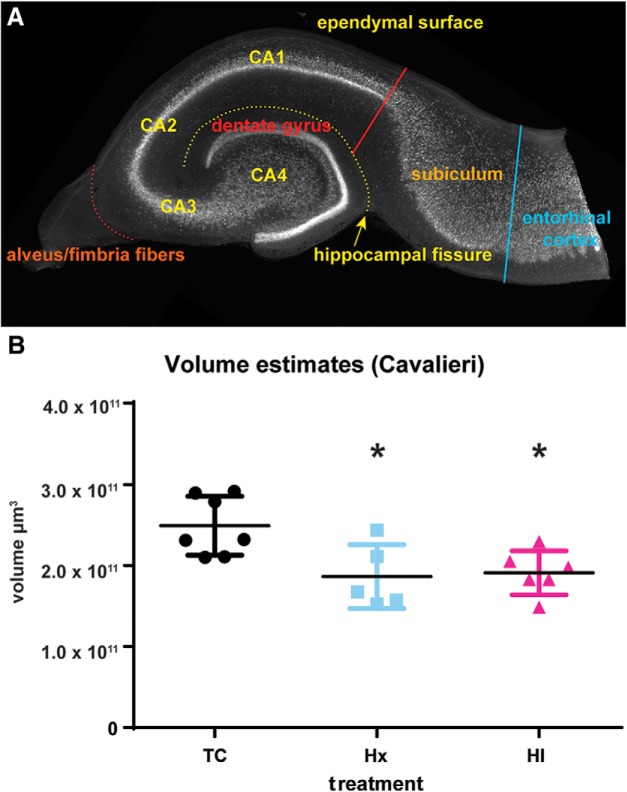
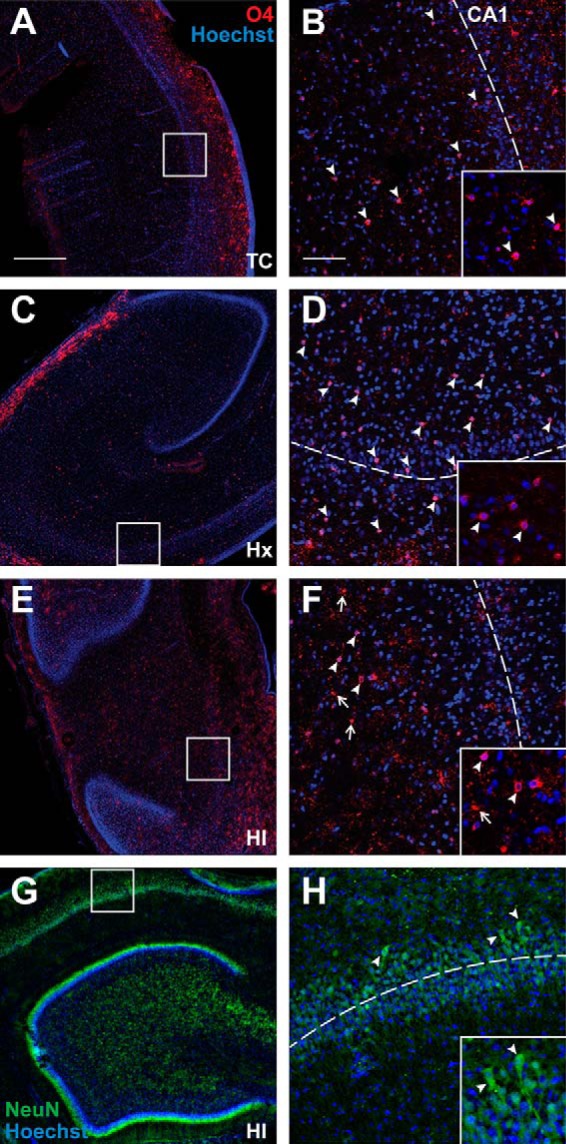
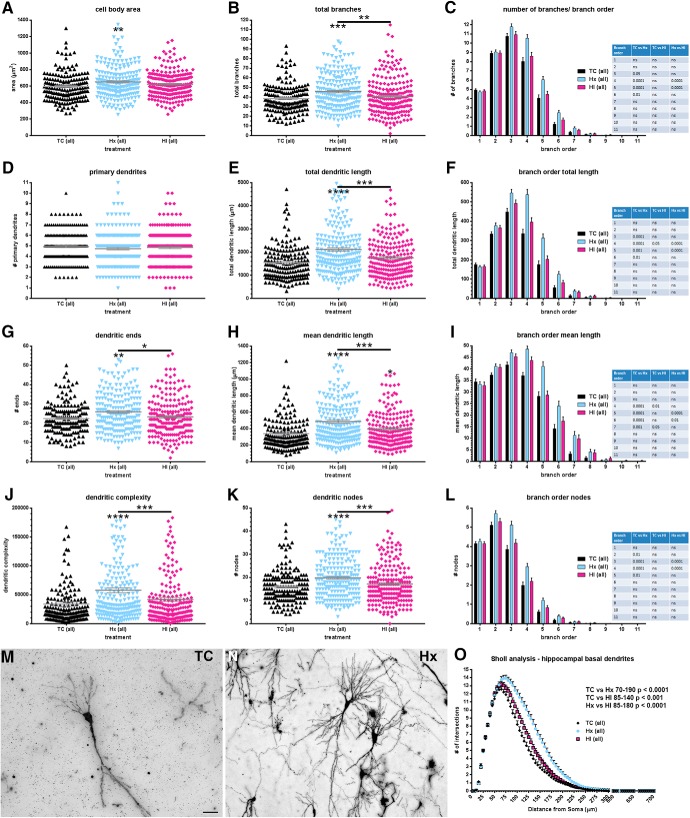
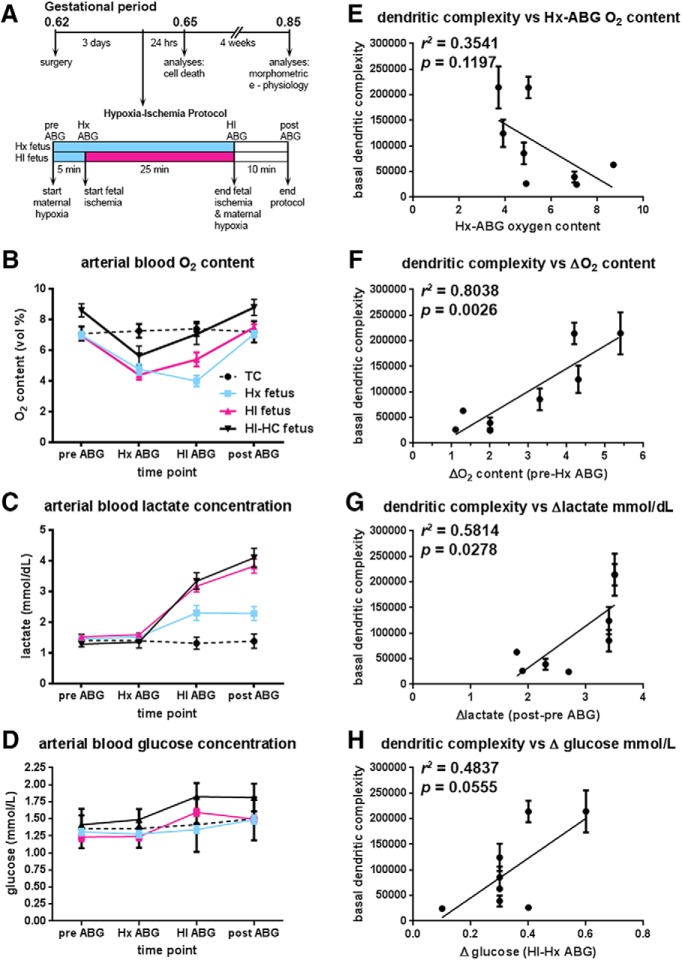
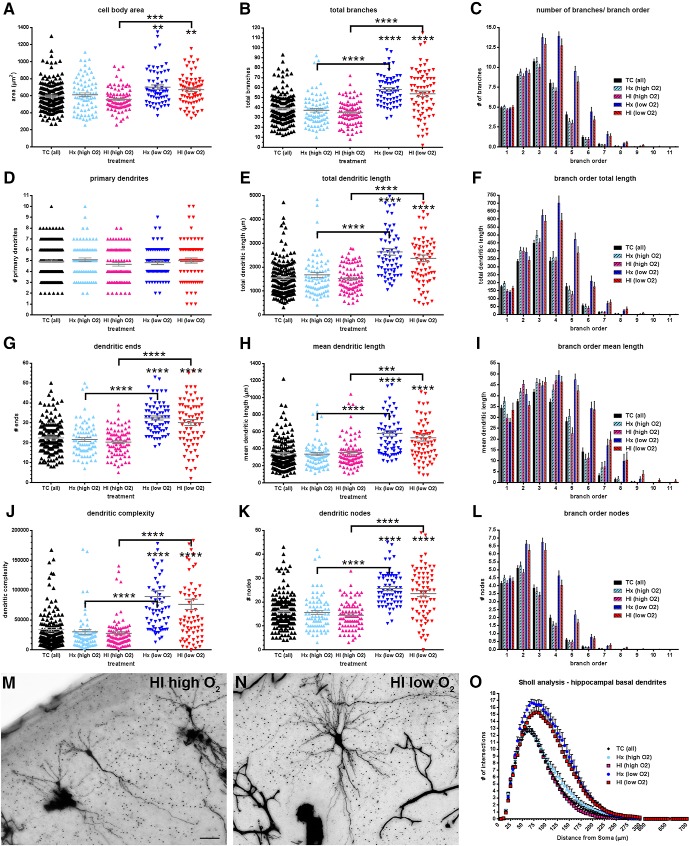
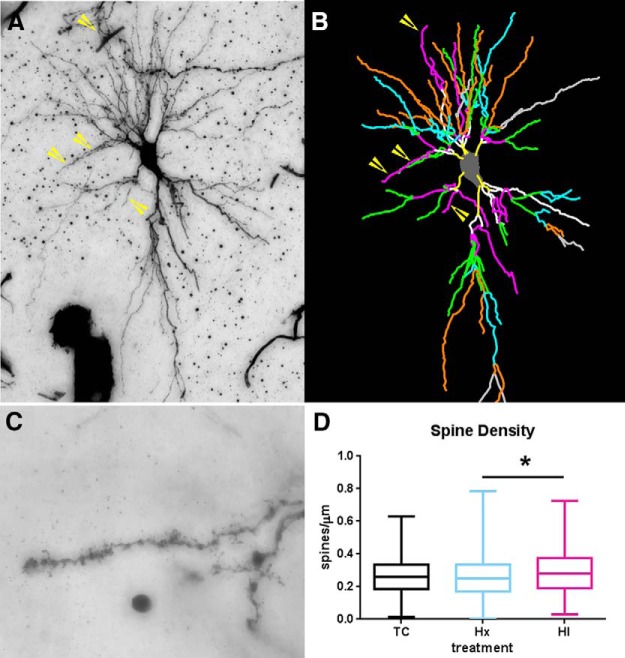
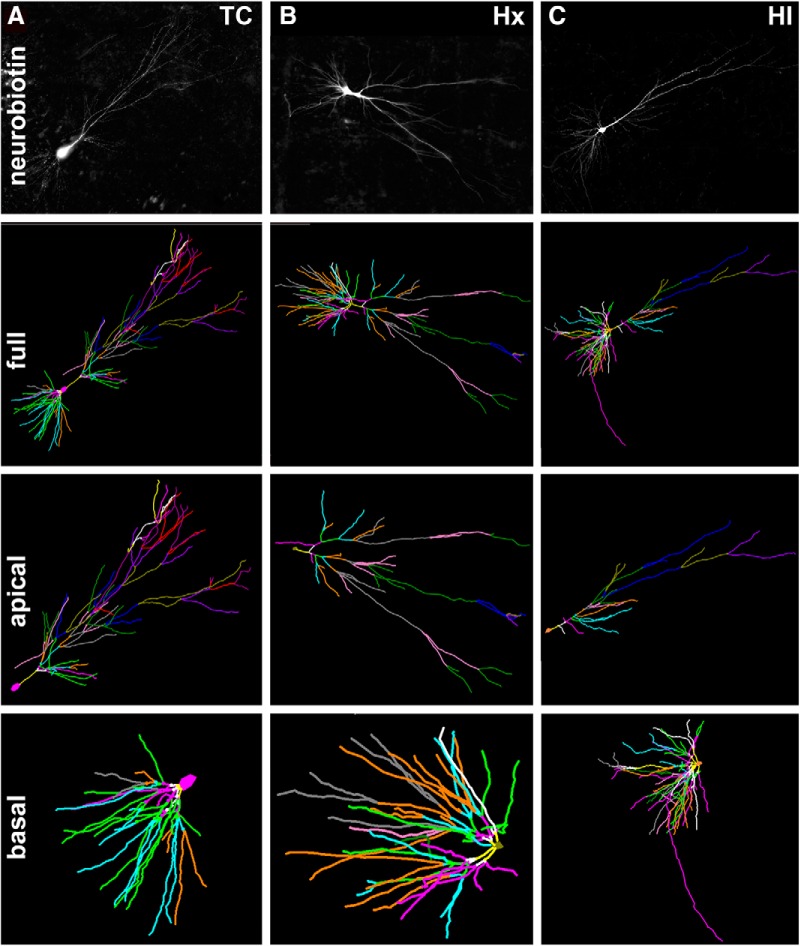
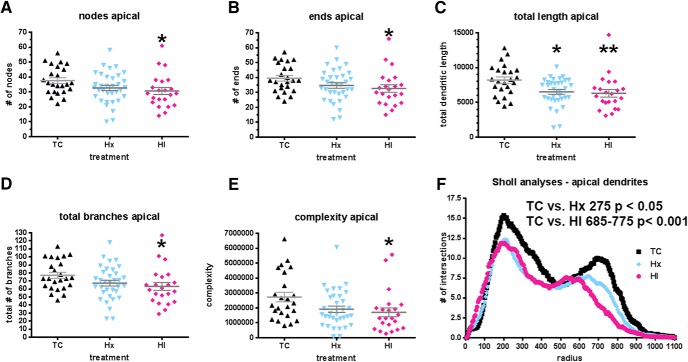
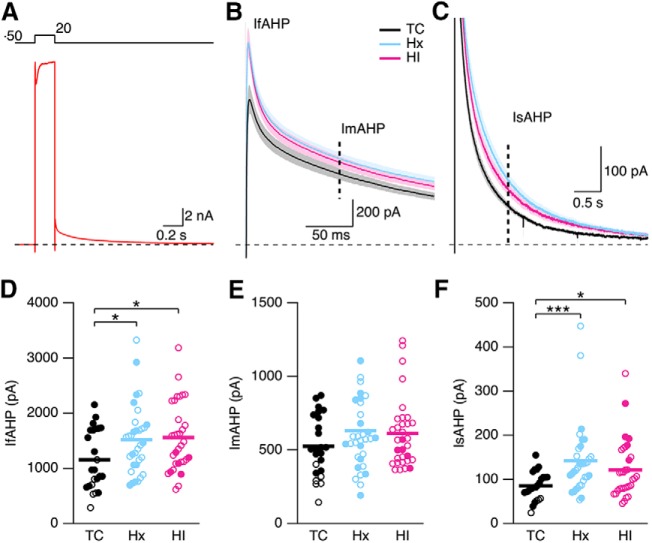
Children who survive premature birth often exhibit reductions in hippocampal volumes and deficits in working memory. However, it is unclear whether synaptic plasticity and cellular mechanisms of learning and memory can be elicited or disrupted in the preterm fetal hippocampus. CA1 hippocampal neurons were exposed to two common insults to preterm brain: transient hypoxia-ischemia (HI) and hypoxia (Hx). We used a preterm fetal sheep model using both sexes in twin 0.65 gestation fetuses that reproduces the spectrum of injury and abnormal growth in preterm infants. Using Cavalieri measurements, hippocampal volumes were reduced in both Hx and HI fetuses compared with controls. This volume loss was not the result of neuronal cell death. Instead, morphometrics revealed alterations in both basal and apical dendritic arborization that were significantly associated with the level of systemic hypoxemia and metabolic stress regardless of etiology. Anatomical alterations of CA1 neurons were accompanied by reductions in probability of presynaptic glutamate release, long-term synaptic plasticity and intrinsic excitability. The reduction in intrinsic excitability was in part due to increased activity of the channels underlying the fast and slow component of the afterhyperpolarization in Hx and HI. Our studies suggest that even a single brief episode of hypoxemia can markedly disrupt hippocampal maturation. Hypoxemia may contribute to long-term working memory disturbances in preterm survivors by disrupting neuronal maturation with resultant functional disturbances in hippocampal action potential throughput. Strategies directed at limiting the duration or severity of hypoxemia during brain development may mitigate disturbances in hippocampal maturation.SIGNIFICANCE STATEMENT Premature infants commonly sustain hypoxia-ischemia, which results in reduced hippocampal growth and life-long disturbances in learning and memory. We demonstrate that the circuitry related to synaptic plasticity and cellular mechanisms of learning and memory (LTP) are already functional in the fetal hippocampus. Unlike adults, the fetal hippocampus is surprisingly resistant to cell death from hypoxia-ischemia. However, the hippocampus sustains robust structural and functional disturbances in the dendritic maturation of CA1 neurons that are significantly associated with the magnitude of a brief hypoxic stress. Since transient hypoxic episodes occur commonly in preterm survivors, our findings suggest that the learning problems that ensue may be related to the unique susceptibility of the hippocampus to brief episodes of hypoxemia.

Keywords: LTP; dendritic morphology; developmental neuroanatomy; electrophysiology; hippocampus; synaptic plasticity.


Figures

Figure 1.
Figure 1.
Volumetric changes were observed in the hippocampal and dentate gyri in response to HI calculated by the Cavalieri estimation. A, NeuN staining of a transverse slice through the hippocampal formation reveals the neuronal subfields of the fetal sheep hippocampal and dentate gyri in the stereotypical “jelly-roll” configuration. Areal calculations of the CA1-CA4 subfields and the dentate gyrus of each slice excluded the subiculum and the entorhinal cortex at a border drawn tangential to the end of the CA1 neuronal subfield (red solid line) between the ependymal surface of the hippocampal gyrus and the hippocampal fissure (yellow dotted line), and the alveus was also excluded where it coalesces to form the fimbria fibers (orange dotted line). B, After 4 weeks, the hippocampal volume of fetuses exposed to Hx or HI was reduced versus controls (TC). No significant differences were observed between Hx and HI treatments. *p < 0.05 (Tukey's post hoc multiple-comparison test).
Figure 2.
Figure 2.
Hippocampal neurons and oligodendrocyte lineage cells are largely intact 24 h after exposure to HI or Hx at 94 d (∼0.65) gestation. A–F, Low (A,C,E) and high (B,D,F) power images of the CA1 subfield (visualized with Hoechst 33342; blue) and oligodendrocyte lineage cells stained with O4 antibody (red) in the adjacent white matter. A, C, E, Boxes represent the regions of higher-power detail in B, D, F where the dotted lines indicate the approximate location through the middle of CA1. White arrowheads indicate that O4+ cells were typically intact in the control (TC) and Hx groups (see insets), but scattered degenerating O4+ cells were visualized in response to HI (F, white arrows; inset). G, H, Low (G) and high (H; see box in G) power images of NeuN staining in the CA1 (green) with Hoechst counterstain (blue). H, Inset, The typical morphology of intact-appearing CA1 pyramidal neurons. Scale bars: A, C, E, 500 μm; B, D, F, 100 μm.
Figure 3.
Figure 3.
Increased basal dendritic complexity found in the total population of CA1 neurons after exposure to Hx. Paired comparisons are made to normal controls (TC) unless designated by brackets. A, Mean cell body area, (B) total number of basal dendritic branches, (C) number/quantity of basal dendritic branches by branch order, (D) number of primary (first-order) basal dendrites, (E) total basal dendritic length, (F) total basal dendritic length by branch order, (G) basal dendritic ends (terminals), (H) mean basal dendritic length, (I) mean basal dendritic length by branch order, (J) computed complexity index for basal dendrites, (K) total number of basal dendritic nodes (branch points), (L) basal dendritic nodes (branch points) by branch order, (M) Golgi-stained control (TC) CA1 neuron, (N) Golgi-stained CA1 neuron exposed to maternal hypoxia only (Hx), and (O) Sholl analysis (number of basal dendritic intersections of Sholl sphere). Black bars/symbols represent controls (TC). Slate blue bars/symbols represent Hx. Mauve/magenta bars/symbols represent HI. Error bars indicate SE. p values were calculated using Dunn's post hoc test for multiple comparisons after Kruskal–Wallis one-way ANOVA for global metrics. Branch order and Sholl analyses: *p < 0.05; **p < 0.01; ***p < 0.001; ****p < 0.0001; Bonferroni's post hoc test for multiple comparisons. Scale bars: M, N, 50 μm.
Figure 4.
Figure 4.
Fetal ABG values for treatment groups during experimental paradigm. A, Flow chart of the experimental protocol described in Materials and Methods. B, Fetal oxygen content (vol %) initially drops in response to maternal hypoxia. With the onset of fetal ischemia, fetal oxygen content in both HI groups (red and solid black lines) attempts to rebound back to baseline levels, while remaining relatively constant in the fetuses exposed only to maternal hypoxia (Hx group blue line). Within 10 min of the cessation of maternal hypoxia and fetal ischemia, fetal oxygen content returns to baseline levels. The differences in oxygen content between the HI and HI-HC groups reflect the sampling site from which the blood gas was collected; in the fetus, oxygen content is higher in carotid arteries than in femoral arteries. Black dotted lines indicate normal control fetuses (TC). C, Fetal lactate concentration increases markedly in HI groups (red and solid black lines) by the end of the ischemic period and continues to rise 10 min after the cessation of fetal ischemia and maternal hypoxia compared with fetuses exposed only to maternal hypoxia (Hx group, blue lines). D, Fetal glucose concentration rises markedly in HI groups (red and solid black lines) compared with Hx group (blue line). E, The basal dendritic complexity of HI-treated CA1 hippocampal neurons is plotted versus the fetal systemic oxygen content 5 min into maternal hypoxia. F, Basal dendritic complexity of HI-treated CA1 hippocampal neurons is positively associated with the magnitude of the initial fetal response to maternal hypoxia defined as the difference between the pre-ABG (baseline) and Hx-ABG oxygen content values. The greater the drop in the oxygen content value from baseline for the HI-HC fetus, basal dendritic complexity is observed to increase in CA1 neurons. G, Basal dendritic complexity of HI-treated CA1 hippocampal neurons is positively associated with the magnitude of change in lactate recovery defined as the difference between post-ABG (recovery) lactate value and the pre-ABG (baseline) lactate value. H, Basal dendritic complexity of HI-treated CA1 hippocampal neurons versus the magnitude of change in fetal systemic glucose, defined as the difference between the HI-ABG glucose value and the Hx-ABG glucose value.
Figure 5.
Figure 5.
Basal dendritic complexity in CA1 neurons after exposure to maternal hypoxia (Hx) and/or ischemia is related to the fetal systemic oxygen content. Paired comparisons are made to normal controls (TC) unless designated by brackets. A, Mean cell body area, (B) total number of basal dendritic branches, (C) number/quantity of basal dendritic branches by branch order, (D) number of primary (first order) basal dendrites, (E) total basal dendritic length, (F) total basal dendritic length by branch order, (G) basal dendritic ends (terminals), (H) mean basal dendritic length, (I) mean basal dendritic length by branch order, (J) computed complexity index for basal dendrites, (K) total number of basal dendritic nodes (branch points), (L) basal dendritic nodes (branch points) by branch order, (M) Golgi-stained control (TC) CA1 neuron, (N) Golgi-stained CA1 neuron exposed to maternal hypoxia only (Hx), and (O) Sholl analysis (number of basal dendritic intersections of Sholl sphere). Black bars/symbols represent true normal controls (TC). Slate blue and mauve/magenta bars/symbols represent fetuses that received maternal hypoxia only (hypoxic control, Hx) and hypoxia-ischemia (HI), respectively, but were able to maintain oxygen content values within 78% of baseline values (high O2). Bright blue and red bars/symbols represent Hx and HI fetuses, respectively, that fell below the 78% threshold (low O2). Error bars indicate SE. p values were calculated using Dunn's post hoc test for multiple comparisons after Kruskal–Wallis one-way ANOVA for global metrics. **p < 0.01; ***p < 0.001; ****p < 0.0001; Branch order and Sholl analysis: Bonferroni's post hoc test for multiple comparisons. Scale bars: M, N, 50 μm.
Figure 6.
Figure 6.
Augmented basal dendritic arbor maturation is accompanied by no changes in basal dendritic spine density. For the same population of CA1 neurons that were sampled for dendritic morphology, spine density was quantified on third-order terminal dendritic branches of all experimental groups of neurons. A, B, Example of third-order terminal branches (yellow arrows) that were present on the Golgi-impregnated neuron (A) and the corresponding Neurolucida tracing (B, purple/hot pink lines). B, Branch order rank is indicated by color: bright yellow represents first order; white represents second order; purple/hot pink represents third order; bright green represents fourth order; cyan blue represents fifth order; orange represents sixth order; slate gray represents seventh order. C, Dendritic spines visualized on a Golgi-impregnated CA1 hippocampal pyramidal neuron. D, Spine density in control, hypoxia-only (Hx), and HI groups at 4 weeks after treatment. Preterm neurons in both the Hx and HI groups (blue and red bars) revealed no significant change in the number of spines versus controls (black bars). However, Hx- versus HI-treated groups were significant at p < 0.05 (Dunn's correction for multiple pairs, black horizontal bar with asterisk). n = 354 TC, 343 Hx, and 341 HI tertiary basal dendrites. *p < 0.05.
Figure 7.
Figure 7.
A–C, Top row, Maximum projection images of z stacks of representative neurobiotin-filled CA1 pyramidal neurons from TC (A), Hx (B), and HI (C) brains. Second row, The 3D reconstructions of the soma and full basal and apical dendritic arbors of the representative neurons in the top row were obtained by tracing in Neurolucida z stack images collected at 1 μm steps. Branch order rank is indicated by color: bright yellow represents first order; white represents second order; purple/hot pink represents third order; bright green represents fourth order; cyan blue represents fifth order; orange represents sixth order; slate gray represents seventh order; salmon pink represents eighth order; forest green represents ninth order; bright blue represents 10th order; olive green represents 11th order; purple represents 12th order; red represents 13th order; plum represents 14th order. Third row, Neurolucida tracings of only the apical dendritic arbors and soma of the representative TC, Hx, and HI neurons. Fourth row, Neurolucida tracings of only the basal dendritic arbors and soma of the representative TC, Hx, and HI neurons.
Figure 8.
Figure 8.
A trend toward decreased apical dendritic complexity was seen in neurobiotin-filled CA1 pyramidal neurons after exposure to maternal Hx but only reached significance in global measures within the HI-treated group. Dendritic differences were apparent when analyzed by Sholl intersections. A, Total number of apical dendritic nodes (branch points). B, Total number of apical dendritic endings (terminals). C, Total length of the apical dendritic arbor. D, The total number of apical branches. E, Computed complexity index for apical dendrites. F, Sholl analysis, number of apical dendritic intersections of Sholl sphere. Black bars/symbols represent true normal controls (TC). Blue bars/symbols represent maternal Hx only (hypoxic control, Hx). Red bars/symbols represent HI. Error bars indicate SEM. p values were calculated using Dunn's post hoc test for multiple comparisons after one-way ANOVA for global metrics. F, For the Sholl analyses, p values were calculated using Bonferroni's post hoc test for multiple comparisons following two-way ANOVA. *p < 0.05. **p < 0.01.
Figure 9.
Figure 9.
Field recording of synaptic strength in CA1 region of hippocampus. A, Representative fEPSPs evoked by increasing stimulation intensities (20–100 μA at 20 μA interval). Each trace is the average of 5 consecutively recorded voltage traces at each stimulation intensity. Gray bars represent the regions where fEPSP initial slopes were measured. FV indicates FV peak. The stimulus artifact preceding the FV was blanked out. B, Plot of FV versus stimulus intensity (Stim) from A. The FV-Stim relationship was fit with a linear function without constraints, yielding a slope of 3.2 μV/μA. The slope of the FV-Stim relationship is a reflection of the IE of Schaffer collateral neurons and the density of neurons being excited (FV IE). C, Plot of fEPSP slope versus FV relation from A. The fEPSP initial slope-FV relationship was fit with linear functions without constraints, yielding a slope of 0.92 ms−1. The slope derived from the fits reflects the input–output relation of synaptic transmission (fEPSP I/O) at CA3-CA1 synapses. D, E, Scatterplot of FV IE and fEPSP I/O determined in B and C for individual slices for TC (n = 52 slices from 15 TC brains), Hx (n = 70 slices from 23 Hx brains), and HI (n = 72 from 20 HI brains). Open and closed symbols represent female and male data, respectively. Horizontal error bar in each scatterplot indicates the mean. F, Average FV versus Stim for all slices in D. Data are mean ± SEM. G, Average of fEPSP slope plotted versus average FV from all slices in E. Average fEPSP slope was determined by dividing the FV from each experiment into 50 μV bins, and averaging these across all experiments for both FV and fEPSP slope. Data are mean ± SEM.
Figure 10.
Figure 10.
In utero Hx and HI reduce PPR. A, Representative fEPSPs evoked by paired pulse stimulation separated by 50 ms. Top, Stimulus timing. B–D, Overlay of first and second pulse for representative trace from TC (B), Hx (C), and HI (D). Each trace is the average of 10 consecutively recorded voltage traces. Overlay of first (black) and second (red) fEPSP. Gray bars represent the regions where fEPSP initial slopes were measured. E, Scatter plot of PPR determined by measuring the slope of the average of 10 individual trials. Open and closed symbols represent female and male data, respectively. Horizontal error bar in each scatterplot indicates the mean. ***p < 0.001.
Figure 11.
Figure 11.
In utero hypoxia reduces LTP. A, Top, Induction protocol for LTP. A 50 Hz stimulation train and typical response elicited by LTP stimulation protocol (3 × 100 pulses at 50 Hz). Bottom, fEPSP response to first LTP protocol. The stimulus artifact preceding each FV was blanked out. B, Representative average of 10 fEPSPs from a single slice before (baseline, black) and after LTP induction (LTP, red). Gray bars represent the regions where fEPSP initial slopes were measured. C, Time course (mean ± SEM) of fEPSP slope response normalized to baseline before LTP induction for TC, Hx, and HI. D, Scatterplot represents the reduced levels of LTP observed in Hx. Open and closed symbols represent female and male data, respectively, for TC (n = 48 slices from 15 TC brains), Hx (n = 65 slices from Hx 23 brains), and HI (n = 62 slices from 20 HI brains). Horizontal error bar in each scatterplot indicates the mean. *p < 0.05. ***p < 0.001.
Figure 12.
Figure 12.
Hx and HI decrease IE of hippocampal CA1 pyramidal neurons. A–C, Representative voltage traces from a TC, Hx, and HI neuron, respectively, in response to incrementing depolarizing current injections in whole-cell current-clamp mode. Top, Pulse timing. D, The number of evoked APs (number of APs) for the recordings in A–C plotted against current injection (ΔI, pA). The I/O relationships were fit with a linear function from 50 to 150 pA, yielding a slope in number of APs/pA of 0.11 (TC), 0.05 (Hx), and 0.06 (HI). The slope is a measure of IE reflecting the initial recruitment of AP firing in CA1 neurons. E, F, Summary scatterplot of IE measured as the initial slope of the number of APs versus ΔI injection (C) and the integral of number of APs versus ΔI injection relationship (D). Open and closed symbols represent female and male data, respectively. Data from the TC brains (n = 24 slices from 4 TC brains), Hx brains (n = 44 slices from 11 Hx brains), and HI brains (n = 36 slices from 8 HI brains). Horizontal error bar in each scatterplot indicates the mean. **p < 0.01. ***p < 0.001. G, Summary plot of number of APs evoked at each current injection from the slices in C, D. Data are mean ± SEM. Data were fit with a linear function from 50 to 150 pA, yielding an average slope in number of APs/pA of 0.084 (TC), 0.050 (Hx), and 0.055 (HI). The integral under the I/O relationship from 50 to 350 pA was 3119 (TC), 1936 (Hx), and 2232 (HI).
Figure 13.
Figure 13.
Voltage-clamp analysis of the currents underlying the AHP. A, Voltage-clamp recordings of CA1 neurons after a 100 ms depolarizing pulse to 20 mV from a holding potential of −50 mV for a representative TC neuron. Top, Pulse protocol. B, C, Average of all tail currents following repolarization to −50 mV from TC (24 slices from 4 hippocampi), Hx (33 slices from 8 hippocampi), and HI (32 slices from 7 hippocampi) brains. Shaded area represents SEM for each average. IfAHP is measured as the peak outward tail current (B). Dashed vertical line indicates 100 ms time point (B) and 1 s time point (C) after repolarization for measure of the current underlying the mAHP (ImAHP) and the sAHP (IsAHP), respectively. D–F, Scatterplot of the IfAHP, ImAHP, and IsAHP for TC (24 slices from 4 hippocampi), Hx (33 slices from 8 hippocampi), and HI (32 slices from 7 hippocampi) brains. Open and closed symbols represent female and male data. *p < 0.05. ***p < 0.001. Horizontal error bar in each scatterplot indicates the mean.

References

    1. Acheson GH, Dawes GS, Mott JC (1957) Oxygen consumption and the arterial oxygen saturation in foetal and new-born lambs. J Physiol 135:623–643. 10.1113/jphysiol.1957.sp005735 - DOI - PMC - PubMed
    1. Altman DI, Perlman JM, Volpe JJ, Powers WJ (1993) Cerebral oxygen metabolism in newborns. Pediatrics 92:99–104. - PubMed
    1. Back SA, Miller SP (2014) Brain injury in premature neonates: a primary cerebral dysmaturation disorder? Ann Neurol 75:469–486. 10.1002/ana.24132 - DOI - PMC - PubMed
    1. Back SA, Luo NL, Borenstein NS, Levine JM, Volpe JJ, Kinney HC (2001) Late oligodendrocyte progenitors coincide with the developmental window of vulnerability for human perinatal white matter injury. J Neurosci 21:1302–1312. 10.1523/JNEUROSCI.21-04-01302.2001 - DOI - PMC - PubMed
    1. Back SA, Riddle A, Dean J, Hohimer AR (2012) The instrumented fetal sheep as a model of cerebral white matter injury in the premature infant. Neurotherapeutics 9:359–370. 10.1007/s13311-012-0108-y - DOI - PMC - PubMed

Publication types

LinkOut - more resources