. 2019 Nov;9(11):1556-1573.
doi: 10.1158/2159-8290.CD-19-0215. Epub 2019 Aug 27.

Targeting Glioblastoma Stem Cells through Disruption of the Circadian Clock

Affiliations

Targeting Glioblastoma Stem Cells through Disruption of the Circadian Clock

Zhen Dong et al. Cancer Discov. 2019 Nov.

Abstract

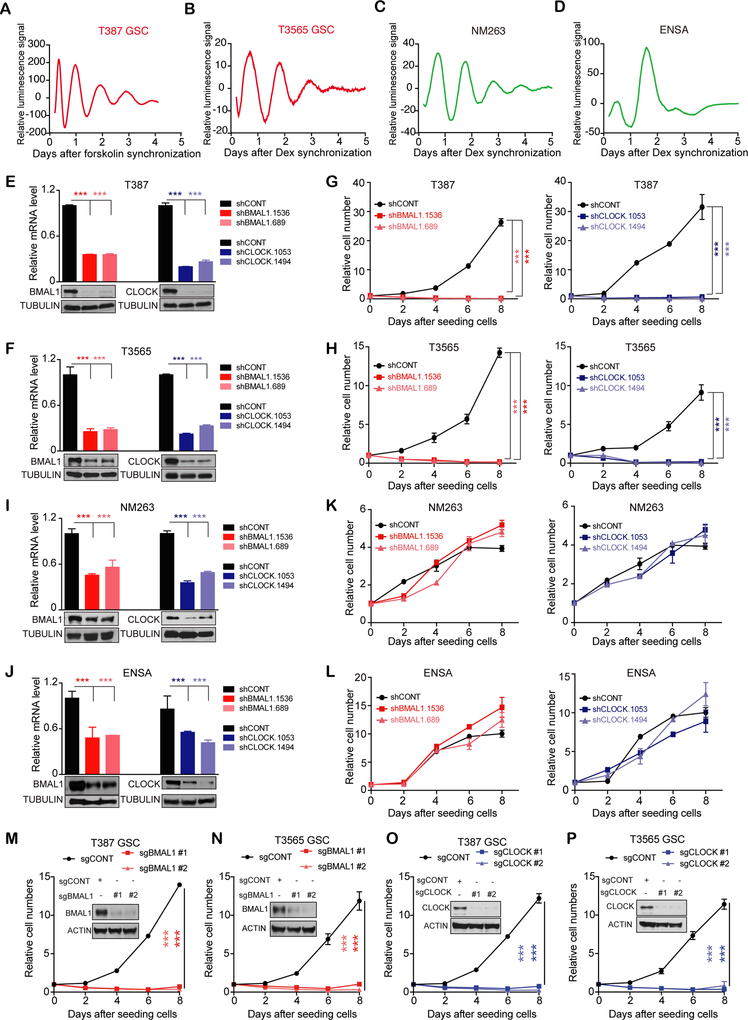
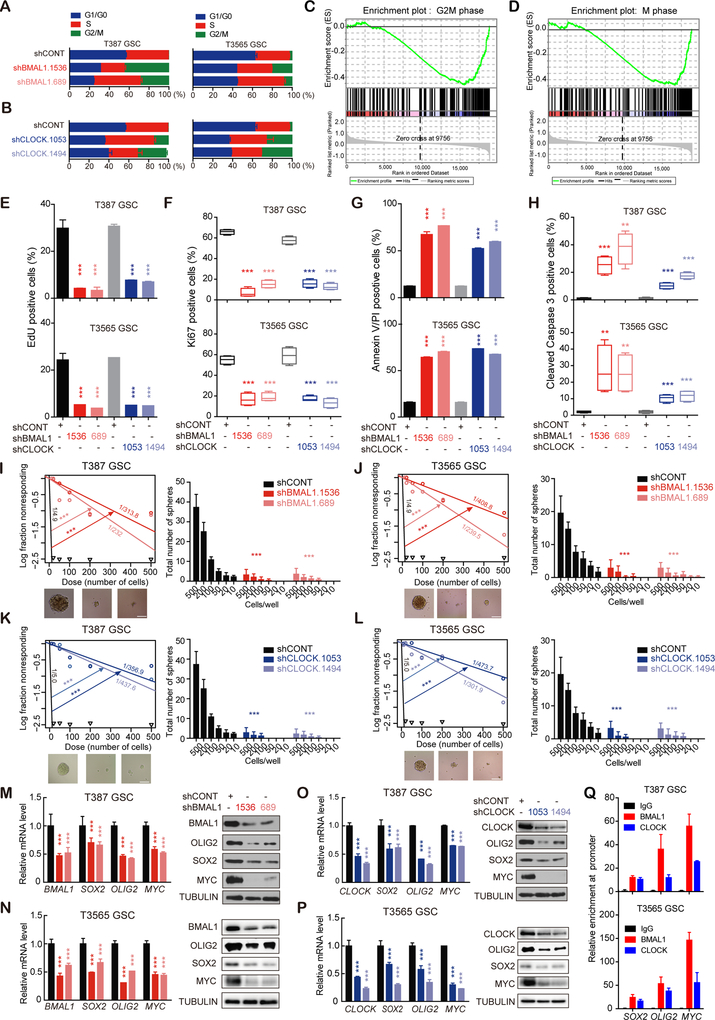
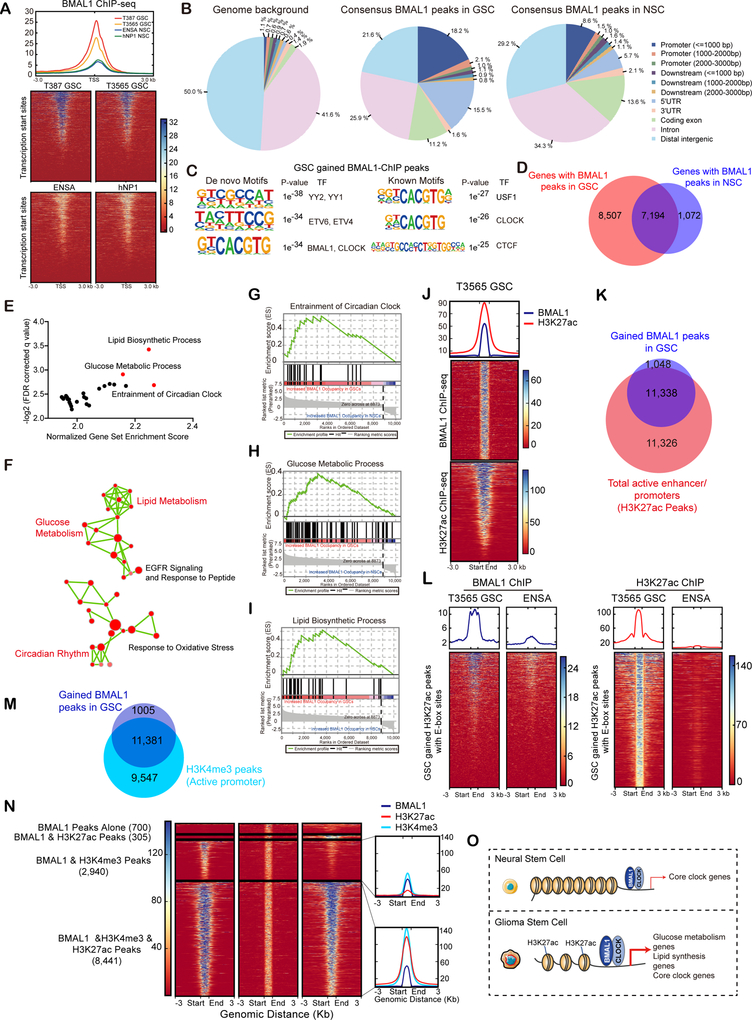
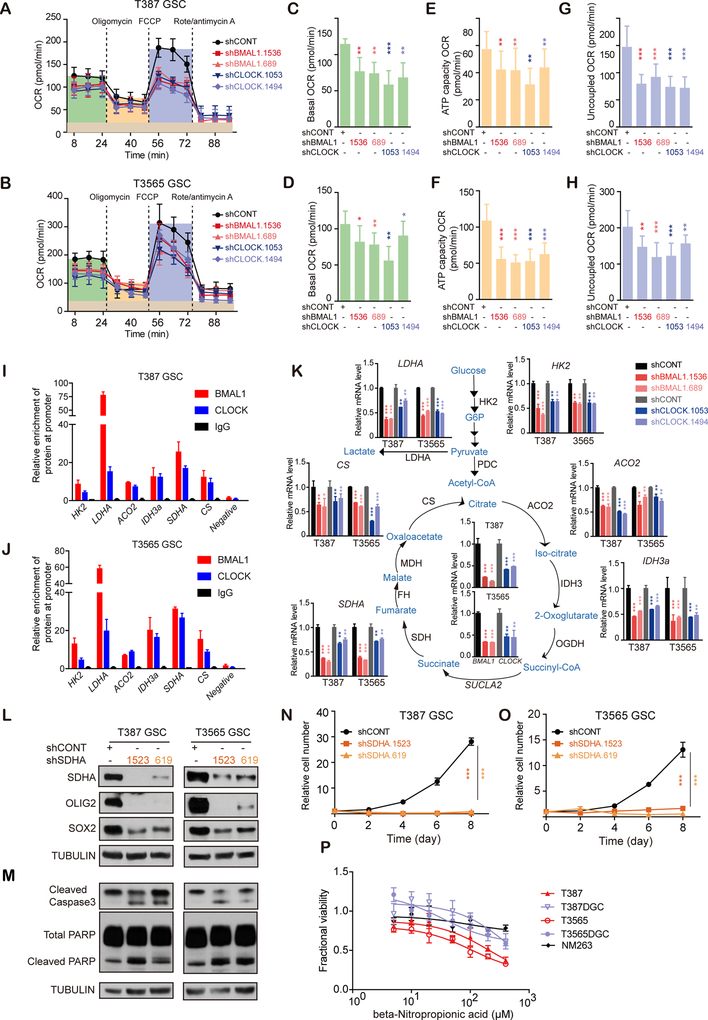
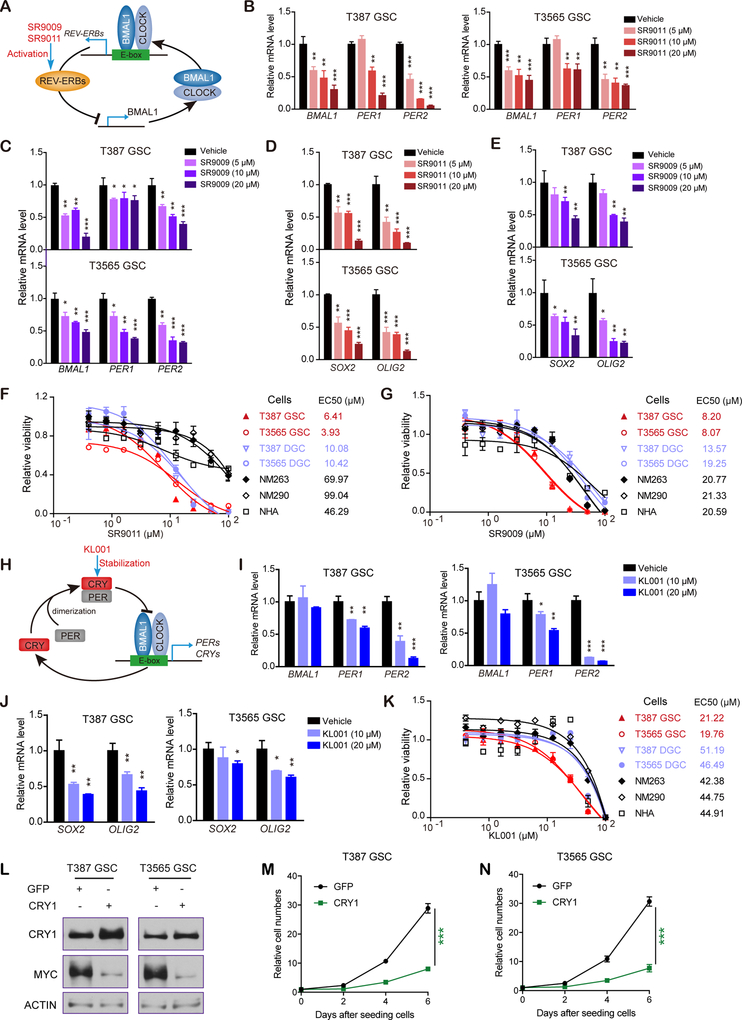
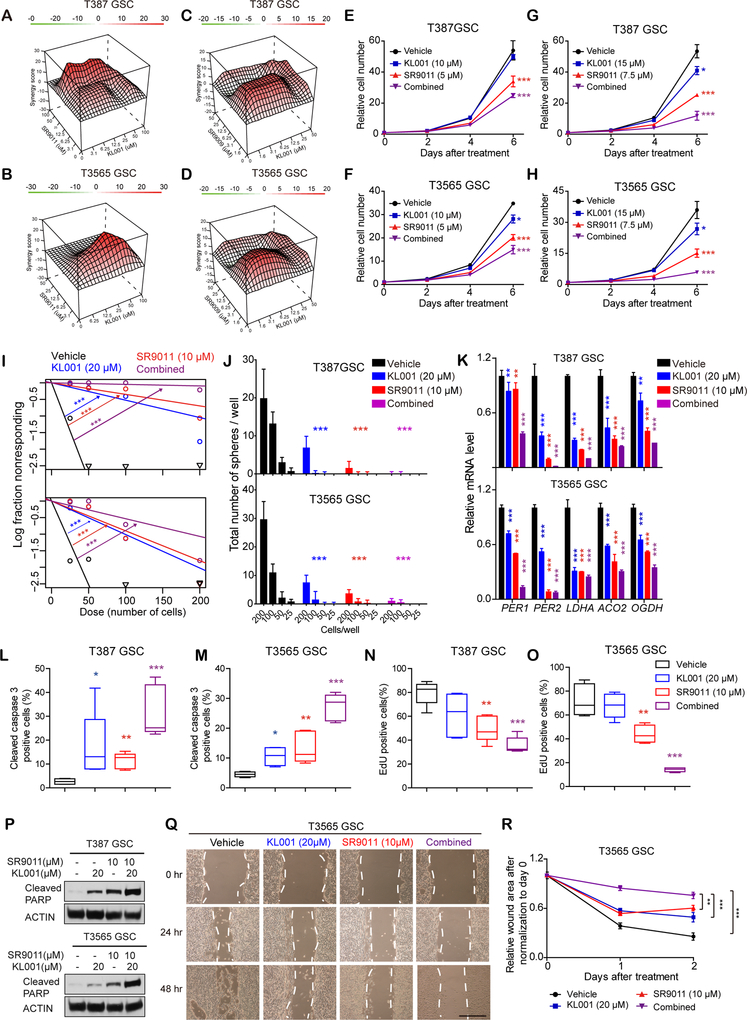
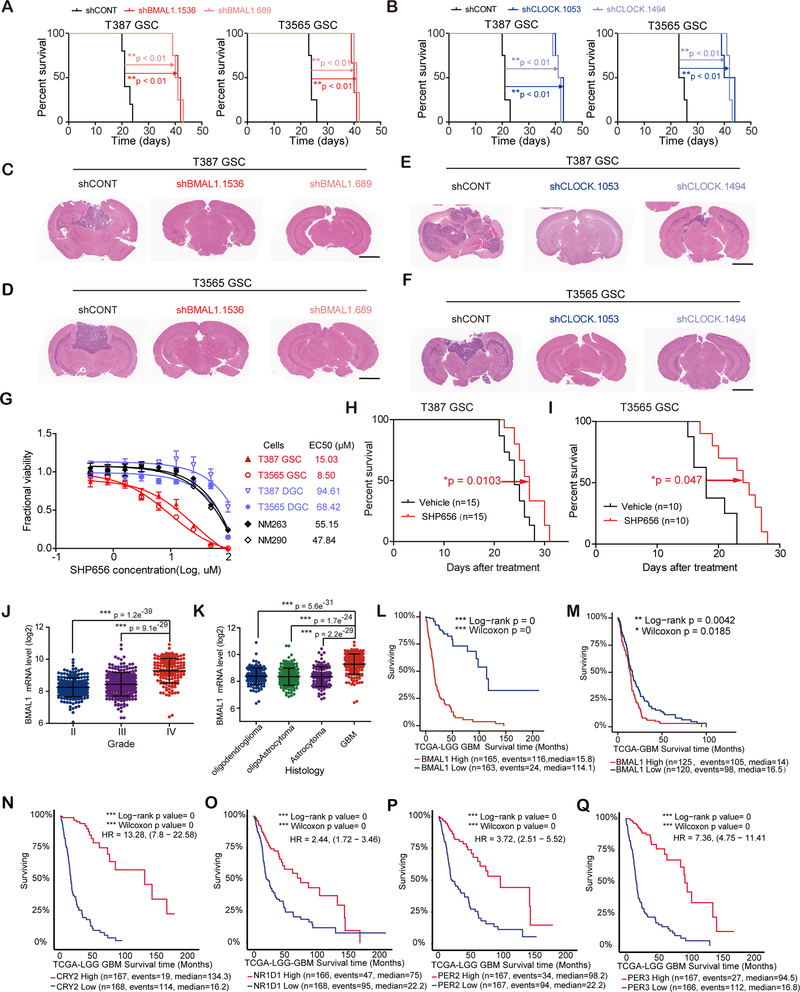
Glioblastomas are highly lethal cancers, containing self-renewing glioblastoma stem cells (GSC). Here, we show that GSCs, differentiated glioblastoma cells (DGC), and nonmalignant brain cultures all displayed robust circadian rhythms, yet GSCs alone displayed exquisite dependence on core clock transcription factors, BMAL1 and CLOCK, for optimal cell growth. Downregulation of BMAL1 or CLOCK in GSCs induced cell-cycle arrest and apoptosis. Chromatin immunoprecipitation revealed that BMAL1 preferentially bound metabolic genes and was associated with active chromatin regions in GSCs compared with neural stem cells. Targeting BMAL1 or CLOCK attenuated mitochondrial metabolic function and reduced expression of tricarboxylic acid cycle enzymes. Small-molecule agonists of two independent BMAL1-CLOCK negative regulators, the cryptochromes and REV-ERBs, downregulated stem cell factors and reduced GSC growth. Combination of cryptochrome and REV-ERB agonists induced synergistic antitumor efficacy. Collectively, these findings show that GSCs co-opt circadian regulators beyond canonical circadian circuitry to promote stemness maintenance and metabolism, offering novel therapeutic paradigms. SIGNIFICANCE: Cancer stem cells are highly malignant tumor-cell populations. We demonstrate that GSCs selectively depend on circadian regulators, with increased binding of the regulators in active chromatin regions promoting tumor metabolism. Supporting clinical relevance, pharmacologic targeting of circadian networks specifically disrupted cancer stem cell growth and self-renewal.This article is highlighted in the In This Issue feature, p. 1469.


Conflict of interest statement

DECLARATION OF INTERESTS

The authors declare no competing interests.

Disclosures: All authors declare no competing financial interests.

Figures

Figure 1.
Figure 1.. Genetic disruption of core clock genes suppresses GSC growth despite robust circadian oscillation.
(A-D) Bioluminescence of BMAL1::Luc in T387 (A) and T3565 (B) GSCs, non-malignant brain cultures (C), NSC (ENSA) (D), synchronized by 100 nM dexamethasone or 10 μM forskolin. Data are representative of three experiments. (E and F) mRNA and protein expression of BMAL1 and CLOCK in T387 (E) and T3565 (F) GSCs transduced with shCONT, shBMAL1 or shCLOCK. Data are presented as mean ± SD. ***, P< 0.001. Statistical significance was determined by one-way ANOVA with Tukey’s multiple comparison. N=3. (G and H) Relative cell numbers of T387 (G) and T3565 (H) GSCs transduced with shCONT, shBMAL1 or shCLOCK. Data are presented as mean ± SD. ***, P< 0.001. Statistical significance was determined by two-way ANOVA with Tukey’s multiple comparison. N=4. (I and J) mRNA and protein expression of BMAL1 and CLOCK in non-malignant brain cultures (NM 263) (I) and NSC (ENSA) (J) transduced with shCONT, shBMAL1 or shCLOCK. Data are presented as mean ± SD. ***, P< 0.001. Statistical significance was determined by one-way ANOVA with Tukey’s multiple comparison. N=3. (K and L) Relative cell numbers of non-malignant brain cultures (K) and NSCs (L) transduced with shCONT, shBMAL1 or shCLOCK. Data are presented as mean ± SD. ***, P< 0.001. Statistical significance was determined by two-way ANOVA with Tukey’s multiple comparison. N=4. (M-P) Protein expression of BMAL1 or CLOCK and relative cellular numbers in GSCs transduced with Cas9-sgCONT, Cas9-sgBMAL1 (M and N) or Cas9-sgCLOCK (O and P). Data are presented as mean ± SD. ***, P< 0.001. Statistical significance was determined by two-way ANOVA with Tukey’s multiple comparison. N=3.
Figure 2.
Figure 2.. The core clock components, BMAL1 and CLOCK, are indispensable for GSCs proliferation and survival.
(A and B) Cell cycle analysis of GSCs following transduction with shCONT, shBMAL1 (A) or shCLOCK (B). N=3. (C and D) GSEA plot of genes in G2M (C) and M phase (D) during cell cycle after BMAL1 knockdown in GSCs. (E) Quantification of EdU incorporation in GSCs transduced with shCONT, shBMAL1 or shCLOCK. Data are presented as mean ± SD. ***, P< 0.001. Statistical significance was determined by one-way ANOVA with Tukey’s multiple comparison. N=3. (F) Quantification of Ki67-positive cells by immunofluorescent staining in GSCs after transduction with shCONT, shBMAL1 or shCLOCK. Data are presented as mean ± SD. ***, P< 0.001. Statistical significance was determined by one-way ANOVA with Tukey’s multiple comparison. N=4. (G) Quantification of FITC-Annexin V/PI positive cells of GSCs transduced with shCONT, shBMAL1 or shCLOCK. Data are presented as mean ± SD. ***, P< 0.001. Statistical significance was determined by one-way ANOVA with Tukey’s multiple comparison. N=3. (H) Quantification of cleaved CASPASE3 positive cells by immunofluorescent staining in GSCs after transduction with shCONT, shBMAL1 or shCLOCK. Data are presented as mean ± SD. ***, P< 0.001. Statistical significance was determined by one-way ANOVA with Tukey’s multiple comparison. N=4. (I-L) In vitro limiting dilution assays and sphere formation of GSCs transduced with shCONT, shBMAL1 (I and J), or shCLOCK (K and L). The estimated stem cell frequencies were indicated. Scale bar is 100 μm. Data of sphere numbers are presented as mean ± SD. ***, P< 0.001. Statistical significance of sphere numbers was determined by one-way ANOVA with Tukey’s multiple comparison. χ2 test was used for pair-wise differences in stem population frequency. N=3. (M-P) Transcripts and protein levels of GSC regulatory factors (SOX2, OLIG2 and MYC) measured by quantitative PCR and immunoblot in GSCs transduced with shCONT, shBMAL1 (M and N), or shCLOCK (O and P). Data are presented as mean ± SD. ***, P< 0.001. Statistical significance was determined by two-way ANOVA with Tukey’s multiple comparison. N=3. (Q) ChIP-qPCR experiments showing occupancy of BMAL1 at the promoters of SOX2, OLIG2 and MYC. All the results are normalized to IgG control. N=3.
Figure 3.
Figure 3.. BMAL1 exhibits aberrant genome-wide binding patterns in GSCs compared to NSCs.
(A) Binding profiles and heatmaps for BMAL1 ChIP-seq signals in GSCs (T387 and T3565) and NSCs (ENSA and hNP1). ChIP-seq signals are displayed within a region spanning ±3 kb around all canonical transcription start sites (TSS) genome-wide. (B) Distribution of genomic annotations of BMAL1 peaks in GSCs (middle panel) and NSCs (right panel) with background shown in left panel. Consensus peaks were derived by selecting all peaks present in both replicates of respective cell types. (C) Motif analysis of GSC-gained BMAL1 binding sites as defined in (Figure S4C). Both de novo (left) and known consensus (right) motifs are shown with corresponding enrichment significance values. (D) Venn diagram showing the overlap between BMAL1 binding genes in GSCs and NSCs ±3 kb around the TSS. (E and F) Gene set enrichment analysis (GSEA) (E) and pathway enrichment bubble plots (F) of genes with GSC-gained BMAL1 peaks ±3 kb around the TSS. (G-I) GSEA plots of genes involved in circadian rhythm (G), glucose regulation (H) and lipid metabolism (I) with increased BMAL1 binding in GSCs relative to NSCs. (J) Heatmaps showing correlation of BMAL1 and H3K27ac ChIP-seq in T3565 GSCs. All ChIP-seq signals are displayed from ±3 kb surrounding each annotated BMAL1 peak. (K) Venn diagram showing the overlap between gained BMAL1 and H3K27ac peaks in T3565 GSCs. (L) Heatmaps displaying BMAL1 and H3K27ac ChIP-seq signals across GSC-gained H3K27ac peaks containing an E-box motif. (M) Venn diagram showing the overlap between GSC-gained BMAL1 peaks and H3K4me3 peaks in GSCs. (N) Heatmaps showing correlation of BMAL1, H3K4me3 and H3K27ac ChIP-seq in GSCs. (O) Schematic showing differential BMAL1 chromatin binding in NSCs and GSCs.
Figure 4.
Figure 4.. Core clock components contribute to oxidative phosphorylation and TCA cycle in GSCs.
(A and B) Oxidative phosphorylation (OXPHOS) of T387 (A) and T3565 (B) GSCs after transduction with shCONT, shBMAL1 or shCLOCK using seahorse extracellular flux analyzer (XF) OCR indicates OXPHOS. Cells were sequentially treated as indicated with oligomycin (2 μM), P-trifluoromethoxy carbonyl cyanide phenylhydrazone (FCCP, 2 μM), antimycin A (1 μM) and rotenone (rote, 1 μM). Vertical line indicates the time points for inhibitors administration. Data are presented as mean ± SEM. N=3. (C and D) Histograms of basal oxidative phosphorylation in T387 (C) and T3565 (D) GSCs transduced with shCONT, shBMAL1 or shCLOCK. Data are presented as mean ± SEM. *, P< 0.05; **, P< 0.01; ***, P< 0.001. Statistical significance was determined by one-way ANOVA with Tukey’s multiple comparison. N=3. (E and F) ATP capacity of T387 (E) and T3565 (F) GSCs transduced with shCONT, shBMAL1 or shCLOCK. Data are presented as mean ± SEM. **, P< 0.01; ***, P< 0.001. Statistical significance was determined by one-way ANOVA with Tukey’s multiple comparison. N=3. (G and H) Levels of uncoupled OXPHOS in T387 (G) and T3565 (H) GSCs transduced with shCONT, shBMAL1 or shCLOCK. Data are presented as mean ± SEM. **, P< 0.01; ***, P< 0.001. Statistical significance was determined by one-way ANOVA with Tukey’s multiple comparison. N=3. (I and J) ChIP-qPCR experiments showing BMAL1 and CLOCK occupancy at the promoter region of the indicated genes in T387 (I) and T3565 (J) GSCs. All the results are normalized to IgG control. N=3. (K) Transcript levels of the indicated genes related to glycolysis and tricarboxylic acid cycle in GSC upon BMAL1 or CLOCK knockdown. Data are presented as mean ± SD. *, P< 0.05; **, P< 0.01; ***, P< 0.001. Statistical significance was determined by one-way ANOVA with Tukey’s multiple comparison. N=3. (L) Protein levels of critical GSC transcription factors (SOX2 and OLIG2) after targeting SDHA with shRNAs for 48 hours. N=3. (M) Immunoblotting of cleaved CASPASE 3 and cleaved PARP in GSCs transduced with shCONT or shSDHA. N=3. (N and O) Cell survival analysis of T387 (N) and T3565 (O) GSCs transduced with shCONT or shSDHA. Relative cell survival was measured at indicated day (0, 2, 4, 6, or 8). Data are presented as mean ± SD. ***, P< 0.001. Statistical significance was determined by two-way ANOVA with Tukey’s multiple comparison. N=3. (P) Concentration-responsive curve of GSCs (T387 GSC and T3565 GSC), DGCs (T387 DGC and T3565 DGC) and non-malignant brain cultures (NM263) treated with beta-Nitropropionic acid (NPA) for 3 days. N = 3.
Figure 5.
Figure 5.. Targeting BMAL1 with small molecules provides a therapeutic strategy for glioma.
(A) Schematic of negative feedback loop driven by REV-ERBs and BMAL1::CLOCK. Small molecules SR9011 and SR9009 repress BMAL1 expression by activating REV-ERBs. (B and C) Transcript levels of core clock genes measured by quantitative RT-PCR in two GSCs treated with different concentrations of SR9011 (B) or SR9009 (C) for 3 days. Data are presented as mean ± SD. *, P< 0.05; **, P< 0.01; ***, P< 0.001. Statistical significance was determined by two-way ANOVA with Tukey’s multiple comparison. N=3. (D and E) Transcript level of GSC markers in two GSCs incubated with different concentrations of SR9011 (D) or SR9009 (E) for 3 days in vitro. N=3. *, P< 0.05; **, P< 0.01; ***, P< 0.001. Statistical significance was determined by two-way ANOVA with Tukey’s multiple comparison. N=3. (F and G) Concentration-response curves and EC50 of various cell types treated with SR9011 (F) or SR9009 (G) (x axis, log scale). T387 and T3565 are GSCs, T387 DGC and T3565 DGC are DGCs, NM263 and NM290 are non-malignant brain cultures, NHA is astrocyte. N=3. Data are presented as mean ± SD. (H) Schematic of CRYs feedback loop. The small molecule modulator KL001 inhibits BMAL1 activity via stabilizing CRY1. (I and J) Transcript expression of core clock genes (I) and GSC markers (J) measured by quantitative RT-PCR following treatment of GSCs with different concentrations of KL001 for 3 days. Data are presented as mean ± SD. *, P< 0.05; **, P< 0.01; ***, P< 0.001. Statistical significance was determined by two-way ANOVA with Tukey’s multiple comparison. N=3. (K) Concentration-response curves and EC50 of GSCs (T387 and T3565), DGCs (T387DGC and T3565DGC), non-malignant brain cultures (NM263 and NM290) and astrocytes (NHA) treated with different concentrations of KL001 (x axis, log scale) for 3 days. N=3. (L) Immunoblot of CRY1 and MYC in GSCs overexpressing CRY1. Data are representative results from three-independent experiments. (M and N) Relative cell numbers of GSCs overexpressing CRY1 or GFP. Data are presented as mean ± SD. ***, P< 0.001. Statistical significance was determined by one-way ANOVA with Tukey’s multiple comparison. N=3
Figure 6.
Figure 6.. Synergism of REV-ERB and CRY agonists in vitro.
(A-D) Synergy indices of SR9011 and KL001 (A and B), SR9009 and KL001 (C and D) analyzed by R package “synergyfinder”. (E and F) Relative cell survival of T387 (E) and T3565 (F) GSCs following treatment with indicated concentration of KL001 (10 μM), SR9011 (5 μM), or a combination. Data are presented as mean ± SD. *, P< 0.05; ***, P< 0.001. Statistical significance was determined by two-way ANOVA with Tukey’s multiple comparison. N=3. (G and H) Relative cell viability of T387 (G) and T3565 (H) GSCs following treatment with indicated concentration of KL001 (15 μM), SR9011 (7.5 μM), or a combination. Data are presented as mean ± SD. *, P< 0.05; ***, P< 0.001. Statistical significance was determined by one-way ANOVA with Tukey’s multiple comparison. N=3. (I and J) In vitro limiting dilution assays (I) and sphere numbers of GSCs (J) following treatment with KL001 and SR9011 at indicated concentrations for 8 days. Data of sphere numbers are presented as mean ± SD. ***, P< 0.001. Statistical significance of sphere numbers was determined by one-way ANOVA with Tukey’s multiple comparison. χ2 test was used for pair-wise differences in stem population frequency. N=3. (K) Relative mRNA level of circadian and metabolic genes after treatment with KL001 (20 μM), SR9011 (10 μM) or a combination. Data are presented as mean ± SD. *, P< 0.05; **, P< 0.01; ***, P< 0.001. Statistical significance was determined by two-way ANOVA with Tukey’s multiple comparison. N=3. (L and M) Quantification of cleaved CASPASE3 positive cells by immunofluorescent staining in T387 (L) and T3565 (M) GSCs after treatment with indicated agonists. Data are presented as mean ± SD. *, P< 0.05, **, P< 0.01, ***, P< 0.001. Statistical significance was determined by one-way ANOVA with Tukey’s multiple comparison. N=3. (N and O) Quantification of EdU positive cells by immunofluorescent staining in T387 (N) and T3565 (O) GSCs after treatment with indicated agonists for 48 hours. Data are presented as mean ± SD. **, P< 0.01, ***, P< 0.001. Statistical significance was determined by one-way ANOVA with Tukey’s multiple comparison. N=3. (P) Immunoblot of cleaved-PARP in GSCs after treatment with indicated agonists for 48 hours. Data are representative results of three independent experiments. (Q and R) In vitro wound healing assay (Q) and calculated relative wound area (R) of T3565 GSCs treatment with indicated agonists. The scale bar is 0.4 mm. N=6. Data are presented as mean ± SD. **, P< 0.01; ***, P< 0.001. Statistical significance was determined by two-way ANOVA with Tukey’s multiple comparison.
Figure 7.
Figure 7.. Targeting core clock components suppresses in vivo tumor growth.
(A and B) Kaplan-Meier survival curves of immunocompromised mice bearing GSCs transduced with shCONT (N = 5), shBMAL1 (N = 4) (A) or shCLOCK (N = 4) (B). Statistical significance was determined by Mantel-Cox log-rank test. (C-F) H&E staining of tumor-bearing brains following implantation of GSCs transduced with either shCONT, shBMAL1 (C and D) or shCLOCK (E and F). Scale bar is 2 mm. (G) Concentration-response curves and EC50 of GSCs (T387 and T3565), DGCs (T387DGC and T3565DGC), non-malignant brain cultures (NM263 and NM290) and astrocytes (NHA) treated with different concentrations of SHP656 (x axis, log scale) for 3 days. N=3. (H and I) Kaplan-Meier survival curves of mice bearing T387 GSC (H) or T3565 GSC (I) treated with SHP656. 15 mice were used per arm for T387 GSC and mice were treated BID (twice a day) at 10mg/Kg. 10 mice were used per arm for T3565 GSC and mice were treated QD (once a day) at 10mg/Kg. Statistical significance was determined by Mantel-Cox log-rank test. (J and K) BMAL1 mRNA level in different grades (J) or histologies (K) of glioma patients from TCGA dataset. Data are presented as mean ± SD. Statistical significance of sphere numbers was determined by one-way ANOVA with Tukey’s multiple comparison. (L and M) Kaplan-Meier survival curves of patients with higher or lower BMAL1 expression in low grades of glioma and glioblastoma (L) or glioblastoma alone (N). Statistical significance was determined by Mantel-Cox log-rank test. (N-Q) Kaplan-Meier survival curves of patients with higher or lower CRY2 (N), NR1D1 (O), PER2 (P) or PER3 (Q) expression in low grades of glioma and glioblastoma. Statistical significance was determined by Mantel-Cox log-rank test.

Comment in

References

    1. Ostrom QT, Gittleman H, Liao P, Vecchione-Koval T, Wolinsky Y, Kruchko C, et al. CBTRUS Statistical Report: Primary brain and other central nervous system tumors diagnosed in the United States in 2010–2014. Neuro Oncol 2017;19(suppl_5):v1–v88 doi 10.1093/neuonc/nox158. - DOI - PMC - PubMed
    1. Stupp R, Mason WP, van den Bent MJ, Weller M, Fisher B, Taphoorn MJ, et al. Radiotherapy plus concomitant and adjuvant temozolomide for glioblastoma. The New England journal of medicine 2005;352(10):987–96 doi 10.1056/NEJMoa043330. - DOI - PubMed
    1. Brennan CW, Verhaak RG, McKenna A, Campos B, Noushmehr H, Salama SR, et al. The somatic genomic landscape of glioblastoma. Cell 2013;155(2):462–77 doi 10.1016/j.cell.2013.09.034. - DOI - PMC - PubMed
    1. Patel AP, Tirosh I, Trombetta JJ, Shalek AK, Gillespie SM, Wakimoto H, et al. Single-cell RNA-seq highlights intratumoral heterogeneity in primary glioblastoma. Science 2014;344(6190):1396–401 doi 10.1126/science.1254257. - DOI - PMC - PubMed
    1. Meyer M, Reimand J, Lan X, Head R, Zhu X, Kushida M, et al. Single cell-derived clonal analysis of human glioblastoma links functional and genomic heterogeneity. Proceedings of the National Academy of Sciences of the United States of America 2015;112(3):851–6 doi 10.1073/pnas.1320611111. - DOI - PMC - PubMed

Publication types

MeSH terms