. 2019 Aug 27;9(1):12392.
doi: 10.1038/s41598-019-48826-6.

Comprehensive in vitro characterization of PD-L1 small molecule inhibitors

Affiliations

Comprehensive in vitro characterization of PD-L1 small molecule inhibitors

Aravindhan Ganesan et al. Sci Rep. .

Abstract

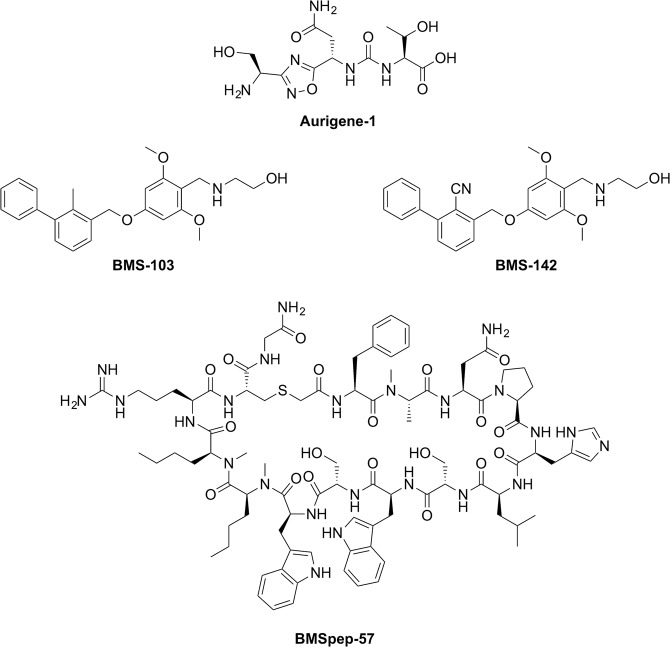
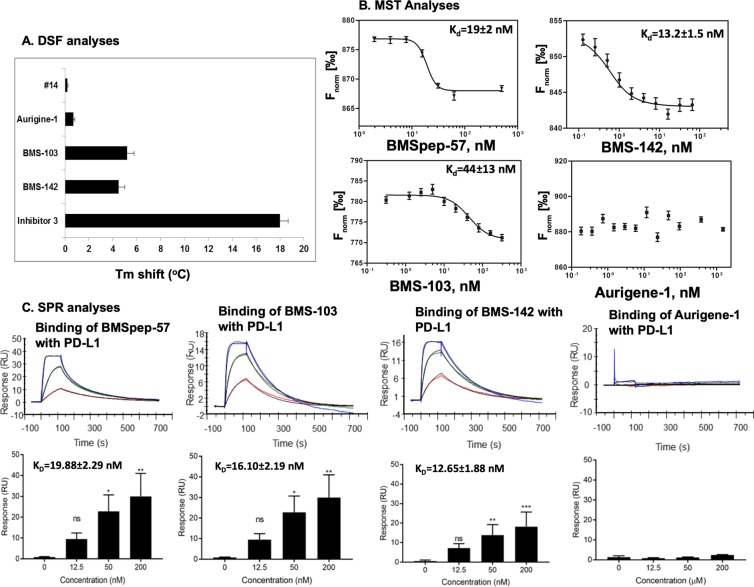
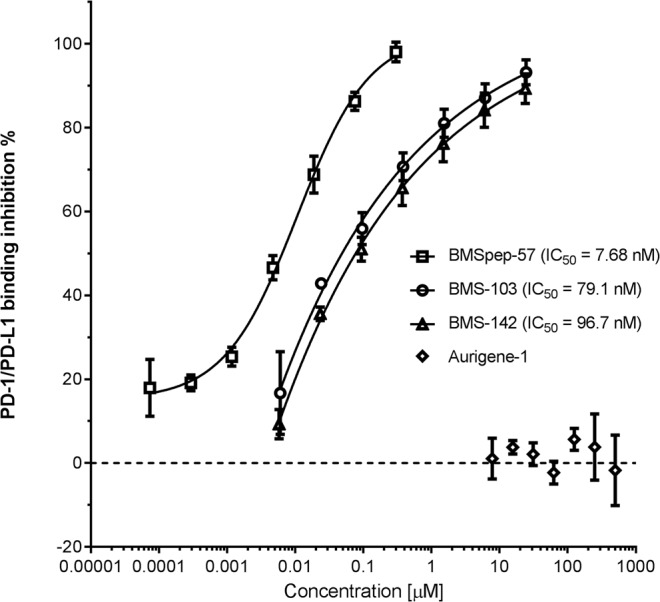
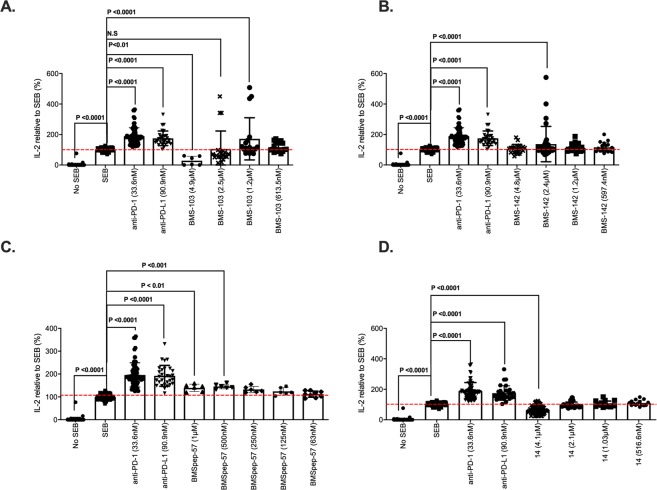
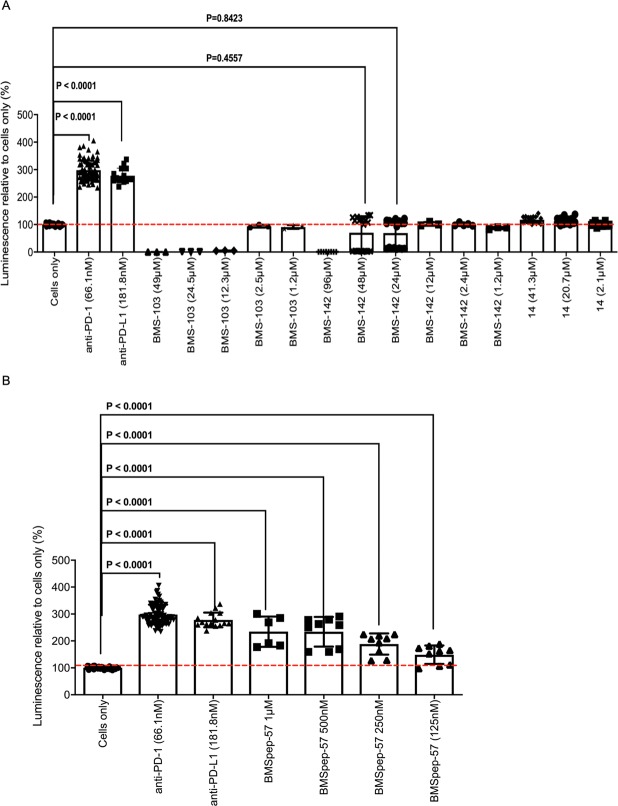
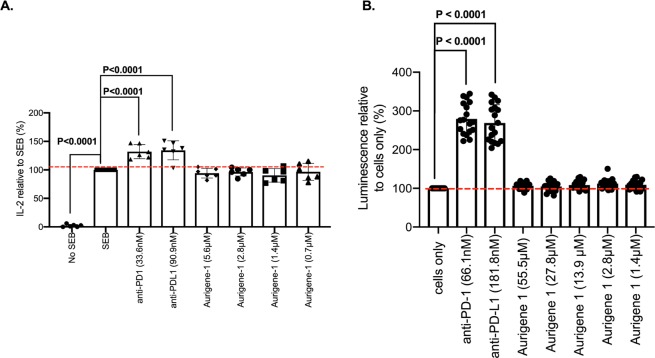
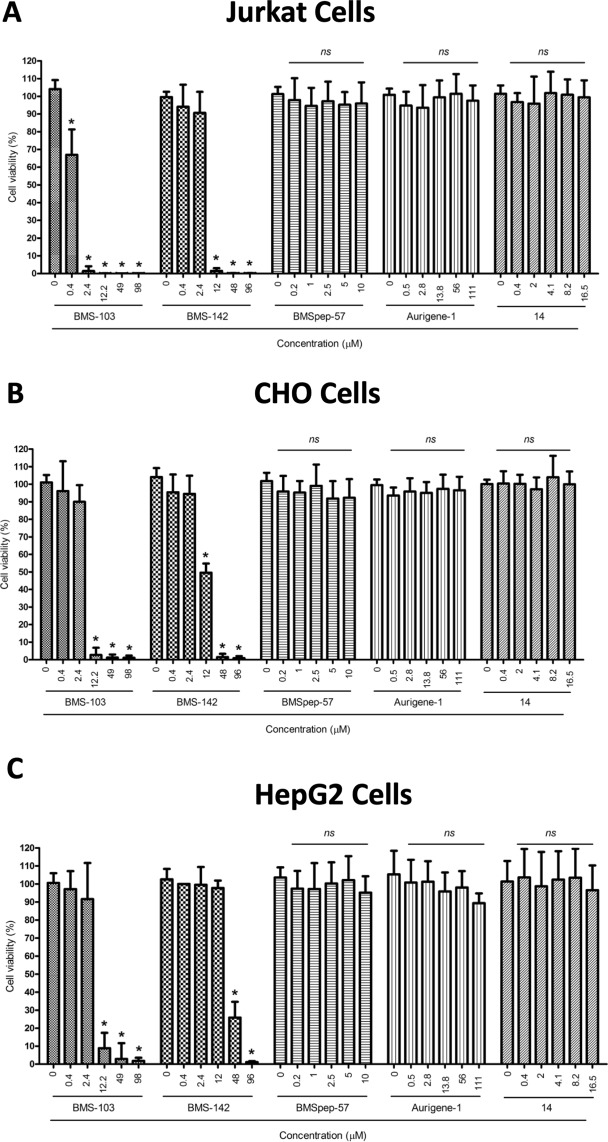
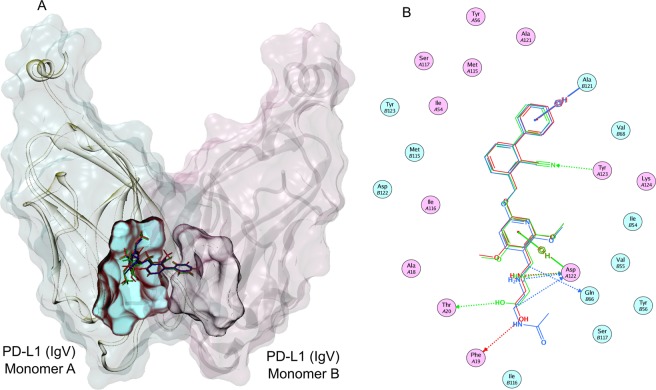
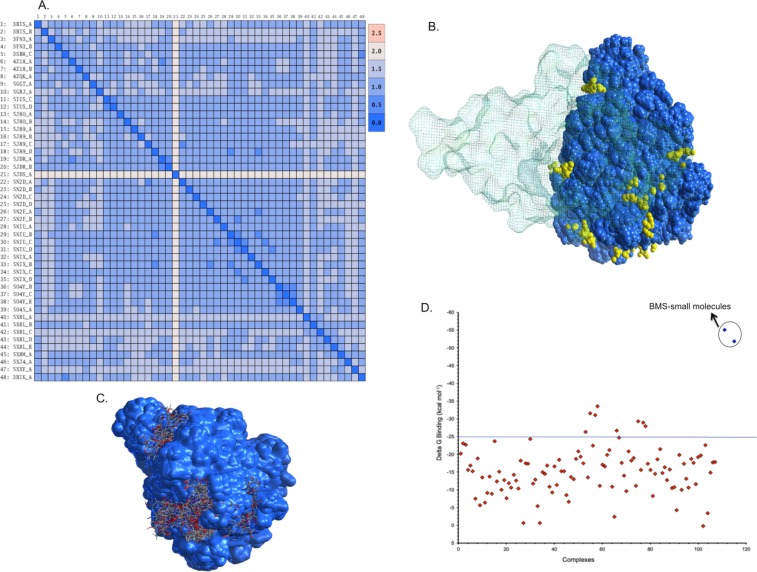
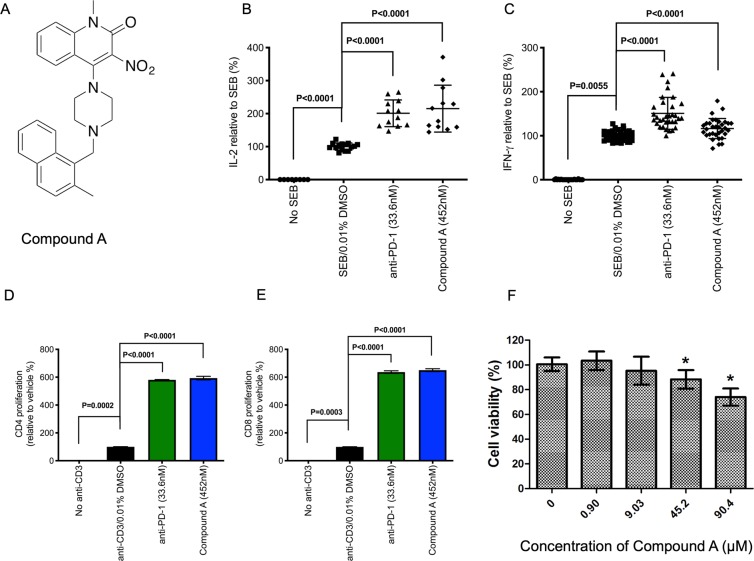
Blockade of the programmed cell death 1 (PD-1)/programmed cell death-ligand 1 (PD-L1) interaction has emerged as a powerful strategy in cancer immunotherapy. Recently, there have been enormous efforts to develop potent PD-1/PD-L1 inhibitors. In particular, Bristol-Myers Squibb (BMS) and Aurigene Discovery Technologies have individually disclosed several promising PD-1/PD-L1 inhibitors, whose detailed experimental data are not publicly disclosed. In this work, we report the rigorous and systematic in vitro characterization of a selected set of potent PD-1/PD-L1 macrocyclic peptide (BMSpep-57) and small-molecule inhibitors (BMS-103, BMS-142) from BMS and a peptidomimetic small-molecule inhibitor from Aurigene (Aurigene-1) using a series of biochemical and cell-based assays. Our results confirm that BMS-103 and BMS-142 are strongly active in biochemical assays; however, their acute cytotoxicity greatly compromised their immunological activity. On the other hand, Aurigene-1 did not show any activity in both biochemical and immunological assays. Furthermore, we also report the discovery of a small-molecule immune modulator, whose mode-of-action is not clear; however, it exhibits favorable drug-like properties and strong immunological activity. We hope that the results presented here will be useful in guiding the development of next-generation PD-1/PD-L1 small molecule inhibitors.


Conflict of interest statement

The authors declare no competing interests.

Figures

Figure 1
Figure 1
Chemical structures of PD-L1 inhibitors developed by Aurigene (Aurigene-1) and Bristol-Meyers Squibb (BMSpep-57, BMS-103, and BMS-142). Chemical structures were generated using ChemDraw Professional 15.
Figure 2
Figure 2
The binding of BMS molecules (BMSpep-57, BMS-103, BMS-142) and Aurigene-1 compound against human PD-L1 protein assessed using DSF (A), MST (B) and SPR (C) assays. (A) The shifts of Tm of PD-L1 in the presence of selected compounds. (B) The binding affinities of labeled PD-L1 to selected compounds as determined by MST. The difference in normalized fluorescence Fnorm [‰] was plotted against MST T-Jump. Compound #14 was used as negative control and shows no binding to PD-L1. (C). The binding of the selected compounds with Fc-PD-L1 was evaluated using SPR technique. BMSpep-57, BMS-103, BMS-142 and Aurigene-1 compounds were allowed to flow over Fc-PD-L1 captured on a flow cell as well as on a reference cell of Series S Sensor Chip Protein A at indicated concentrations, and the Rmax and KD values were determined by Biacore Evaluation software. The solvent-corrected sensograms (representative ones on top panel) and the kinetic analysis of binding (bottom) were presented as mean ± SD from 3 to 4 independent assays (n = 4 for BMS-103 and BMS-142; n = 3 for BMSpep-57 and n = 2 for aurigene-1 binding with Fc-PD-L1).
Figure 3
Figure 3
Ability of compounds to inhibit PD-1/PD-L1 binding in an ELISA competition assay. Compounds were pre-incubated in plates coated with PD-L1 followed by incubation with biotinylated PD-1. The PD-1/PD-L1 binding inhibition percentage was calculated from the difference in the amount of biotinylated PD-1 bound in the presence or absence (vehicle alone) of compound. In the absence of a compound, binding inhibition was normalized to 0% (dotted line). Data represent mean ± SD from three independent experiments, each independent experiment was run with three technical replicates. Where possible, curves were fitted using a 4PL function and the IC50 value was determined by interpolation.
Figure 4
Figure 4
Fold IL-2 production by SEB-stimulated peripheral blood mononuclear cells pre-treated with monoclonal antibodies against PD-1 (33.6 nM), PD-L1 (90.9 nM) or the indicated BMS compounds relative to the vehicle treatment. (A) Effect of BMS-103 on IL-2 production of PBMC. (B) Effect of BMS-142 on IL-2 production of PBMC. (C) Effect of BMSpep-57 on IL-2 production of PBMC. (D) Effect of compound 14, a negative control used in this study on IL-2 production by PBMCs. Cumulative data showing mean ± SD from five experiments (BMS compounds) shown. P-values indicate statistical significance calculated using the Kruskal-Wallis test followed by Dunn’s multiple comparisons test. Unstimulated (No SEB) cells and untreated stimulated cells (SEB) were used as negative and positive controls, respectively.
Figure 5
Figure 5
NFAT-luciferase reporter activity elicited by PD-1/NFAT Reporter-Jurkat cells treated with neutralizing antibodies (PD-1 or PD-L1) or BMS compounds after co-culture with TCR activator/PD-L1-CHO cells. Fold luminescence of Jurkat cells treated with antibodies (α-PD-1 (66.1 nM), α-PD-L1; (181.8 nM)) or the indicated BMS compounds (BMS-103, BMS-142, BMSpep-57, and negative control compound #14) compared to the negative control (cells only). P-values indicate statistical significance calculated using the Kruskal-Wallis test followed by Dunn’s multiple comparisons test or Mann-Whitney non-parametric test. Untreated (cells only) and mAb-treated (PD-1 or PD-L1) Jurkat cells served as negative and positive controls, respectively. Cumulative data showing mean ± SD from ten experiments shown.
Figure 6
Figure 6
Cell-based activity of Aurigene-1 compound. (A) Fold IL-2 production by SEB-stimulated peripheral blood mononuclear cells pre-treated with monoclonal antibodies against PD-1 (33.6 nM), PD-L1 (90.9 nM) or two-fold concentrations of Aurigene-1 compared to the positive control (SEB). P-values indicate statistical significance calculated using the Kruskal-Wallis test followed by Dunn’s multiple comparisons test. Unstimulated (No SEB) cells and untreated stimulated cells (SEB) were used as negative and positive controls, respectively. Data from two experiments using three biological replicates shown. Unstimulated (No SEB) cells and untreated stimulated cells (SEB) were used as negative and positive controls respectively. (B) NFAT-luciferase reporter activity elicited by PD-1/NFAT Reporter-Jurkat cells treated with neutralizing antibodies (PD-1 or PD-L1) or Aurigene-1. Fold luminescence of Jurkat cells treated with antibodies (a-PD-1, 66.1 nM and a-PD-L1, 181.8 nM) or two-fold concentrations of the indicated Aurigene compounds compared to the negative control (cells only). P-values indicate statistical significance calculated using the Kruskal-Wallis test followed by Dunn’s multiple comparisons test. Untreated (cells only) and mAb-treated (PD-1 or PD-L1) Jurkat cells served as negative and positive controls, respectively. Cumulative data showing mean ± SD from five experiments shown.
Figure 7
Figure 7
Concentration-dependent effects on viability of the indicated test compounds on Jurkat, CHO and HepG2 cells. Jurkat (A), CHO (B) or HepG2 (C) cells were treated with various concentrations of different test compounds (BMS-103, BMS-142, BMSpep-57, Aurigene-1 and compound #14) for 24 h, and the cell viability was assessed by the CellTiter-Glo® Luminescent Cell Viability Assay (A,B) and the CCK-8 assay (C). Cumulative data from three independent experiments are shown. ns = non-significant in comparison with control (DMSO-treated cells). *P < 0.0001 indicates statistical significance calculated by using one-way ANOVA followed by Dunnett’s multiple comparison’s test.
Figure 8
Figure 8
Comparison of the binding modes of BMS-103, BMS-142, and the reference BMS-202 compound against a PD-L1 dimer at molecular-level. (A) The superposed binding modes of BMS-103 (red stick) and BMS-142 (green stick), along with the reference BMS-202 compound (blue stick), within an induced dimer of two PD-L1 IgV domains. The two monomers of PD-L1 IgV domain are shown in cartoon representations. The surface of monomer A of PD-L1 is shown in cyan; whereas, the surface of monomer B of PD-L1 is shown in pink. The binding sites for BMS small molecules on both the monomers are also mapped in corresponding colors (cyan for monomer A; pink for monomer B). (B) A closer view of the binding-modes and interactions of the BMS small molecules sandwiched between the two PD-L1 monomers, leading to a stable PD-L1 dimer. The key hydrogen bond interactions and arene-pi interactions are also shown.
Figure 9
Figure 9
Evaluating the binding of Aurigene-1 against hPD-L1 using computational approaches. (A) The root mean square deviation matrix of all the 48 PD-L1 structures in PDB shows that there are no significant conformational differences in PD-L1 while binding to different partners (PD-1, small molecules, monoclonal antibodies and large peptides). (B) Identification of different binding pockets (shown as yellow dummy atoms) on the surfaces of all the PD-L1 structures (shown as VdW representations in blue) using Site Finder module in MOE program. Here, the PD-1 protein is shown as a line-surface illustration with ~60% transparency, in order to show the PD-1 binding face on PD-L1. (C) The 3D structures showing different docking poses of Aurigene-1 within different binding pockets in PD-L1 (shown as blue surface). (D) Comparison of the calculated Delta G binding for all the binding poses of Aurigene-PD-L1 complexes and the top-most pose of BMS-small molecules-PD-L1 complexes (shown with a circle).
Figure 10
Figure 10
The chemical structure (A), immunological activity (B–E) and cytotoxicity profile (F) of Compound A discovered by our team. Compound A shows immunological activity similar to anti-PD-1. Plots showing production of IL-2 (B) and IFN-γ (C) by peripheral blood mononuclear cells in response to SEB stimulation and anti-PD-1 or Compound A treatment. (D,E). Proliferation by CD4+ and CD8+ cells in response to anti-CD3 stimulation and anti-PD-1 or Compound A treatment. Data shows percentage cytokine production or proliferation relative to SEB/anti-CD3. *P < 0.0001 by using one-way ANOVA followed by Dunnett’s multiple comparisons test. Concentration-dependent effects on treating with Compound A on the viability of HepG2 cells are also provided (F). HepG2 cells were treated with various concentrations of Compound A for 24 h, and the cell viability was assessed by the CellTiter-Glo® Luminescent Cell Viability Assay (A,B) and CCK-8 assay (C). Cumulative data from three independent experiments were shown. ns = non-significant in comparison with control (DMSO-treated cells). *P < 0.0001 indicates statistical significance calculated by using one-way ANOVA followed by Dunnett’s multiple comparison’s test.

References

    1. Acúrcio RC, et al. Structure–Function Analysis of Immune Checkpoint Receptors to Guide Emerging Anticancer Immunotherapy. J. Med. Chem. 2018;61:10957–10975. doi: 10.1021/acs.jmedchem.8b00541. - DOI - PubMed
    1. Coley, W. B. Contribution to the Knowledge of SarcomA. Ann. Surg. 14 (1891). - PMC - PubMed
    1. Decker WK, et al. Cancer Immunotherapy: Historical Perspective of a Clinical Revolution and Emerging Preclinical Animal Models. Front. Immunol. 2017;8:829. doi: 10.3389/fimmu.2017.00829. - DOI - PMC - PubMed
    1. Press release: The Nobel Prize in Physiology or Medicine, https://www.nobelprize.org/prizes/medicine/2018/press-release/ (2018). - PubMed
    1. Strutt TM, McKinstry KK, Swain SL. Control of innate immunity by memory CD4 T cells. Adv. Exp. Med. Biol. 2011;780:57–68. doi: 10.1007/978-1-4419-5632-3_6. - DOI - PMC - PubMed

Publication types

MeSH terms