. 2019 Aug 27;9(1):12419.
doi: 10.1038/s41598-019-48838-2.

Live-cell STED nanoscopy of mitochondrial cristae

Affiliations

Live-cell STED nanoscopy of mitochondrial cristae

Till Stephan et al. Sci Rep. .

Abstract

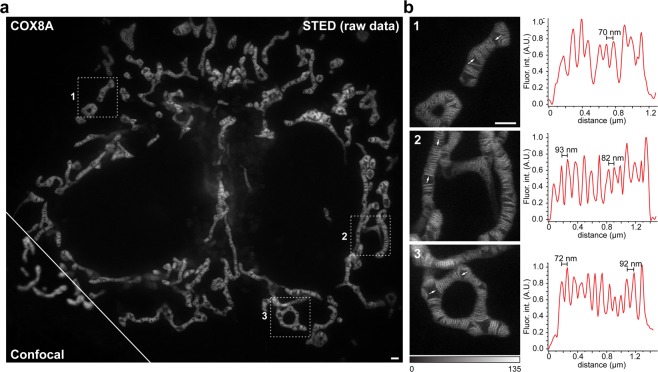
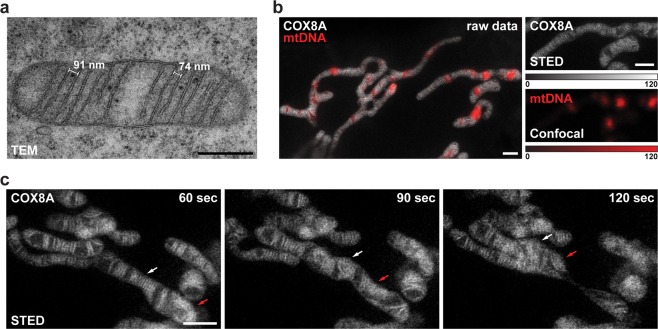
Mitochondria are highly dynamic organelles that exhibit a complex inner architecture. They exhibit a smooth outer membrane and a highly convoluted inner membrane that forms invaginations called cristae. Imaging cristae in living cells poses a formidable challenge for super-resolution light microscopy. Relying on a cell line stably expressing the mitochondrial protein COX8A fused to the SNAP-tag and using STED (stimulated emission depletion) nanoscopy, we demonstrate the visualization of cristae dynamics in cultivated human cells. We show that in human HeLa cells lamellar cristae are often arranged in groups separated by voids that are generally occupied by mitochondrial nucleoids.


Conflict of interest statement

The authors declare no competing interests.

Figures

Figure 1
Figure 1
Live-cell Stimulated Emission Depletion (STED) nanoscopy of mitochondrial cristae in HeLa cells. HeLa cells stably expressing COX8A-SNAP fusion proteins were labeled using SNAP-Cell SiR and visualized with STED nanoscopy. (a) Overview of HeLa cells. Shown is a comparison between confocal and STED resolution. (b) Left: Magnifications of the areas indicated in the overview image. Right: Fluorescence intensity line profiles measured as indicated in the magnifications. STED images show unprocessed raw data without background subtraction. Scale bars: 1 µm.
Figure 2
Figure 2
Dynamics of mitochondrial cristae. (a) Transmission electron microscopy (TEM) of mitochondria from HeLa cells. (b) Dual-color live-cell imaging of mitochondria. HeLa cells stably expressing COX8A-SNAP fusion proteins were labeled using SNAP-Cell SiR. In addition, mtDNA was labeled with PicoGreen (red). The cristae were visualized by STED nanoscopy, the nucleoids by confocal scanning light microscopy. (c) Live-cell time-lapse STED nanoscopy of mitochondria. Mitochondria were recorded every 15 seconds. Shown are three frames out of ten. Arrows indicate the behavior of two separated groups of cristae during the fission of a mitochondrion. The whole image series is shown in Supplementary Movie S1. (b) Shows unprocessed raw data without background subtraction; in (c) photobleaching was compensated by adapting the color table. Scale bars: a: 0.5 µm; b,c: 1 µm.

References

    1. Bereiter-Hahn J, Voth M. Dynamics of mitochondria in living cells: shape changes, dislocations, fusion, and fission of mitochondria. Micros Resarch & Tech. 1994;27:198–219. doi: 10.1002/jemt.1070270303. - DOI - PubMed
    1. Friedman JR, Nunnari J. Mitochondrial form and function. Nature. 2014;505:335–343. doi: 10.1038/nature12985. - DOI - PMC - PubMed
    1. Scheffler, I. E. Mitochondria, second edition. John Wiley & Sons, Inc. Hoboken, New Jersey, USA (2008).
    1. Cogliati S, Enriquez JA, Scorrano L. Mitochondrial Cristae: Where Beauty Meets Functionality. Trends Biochem Sci. 2016;41:261–273. doi: 10.1016/j.tibs.2016.01.001. - DOI - PubMed
    1. Jakobs S, Wurm CA. Super-resolution microscopy of mitochondria. Curr Opin Chem Biol. 2014;20:9–15. doi: 10.1016/j.cbpa.2014.03.019. - DOI - PubMed

Publication types