. 2019 Sep;22(9):1402-1412.
doi: 10.1038/s41593-019-0463-7. Epub 2019 Aug 27.

Global landscape and genetic regulation of RNA editing in cortical samples from individuals with schizophrenia

Collaborators, Affiliations

Global landscape and genetic regulation of RNA editing in cortical samples from individuals with schizophrenia

Michael S Breen et al. Nat Neurosci. 2019 Sep.

Abstract

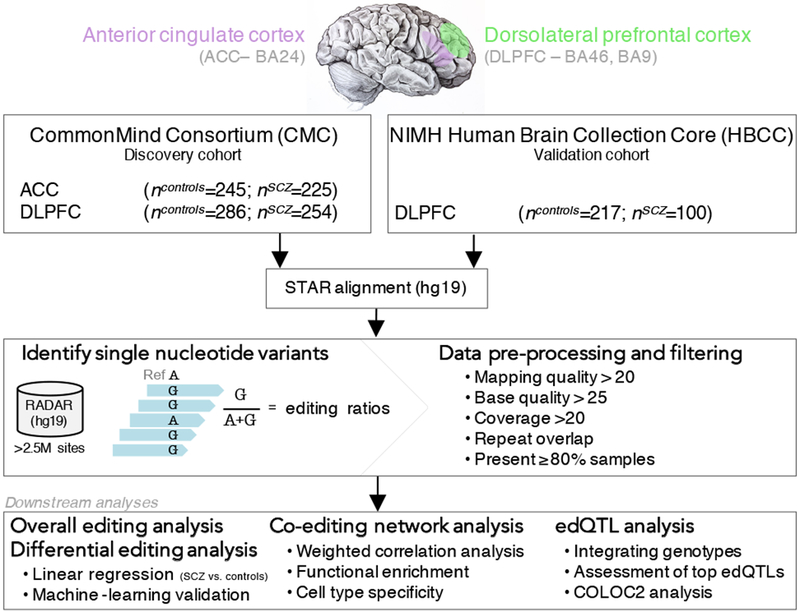
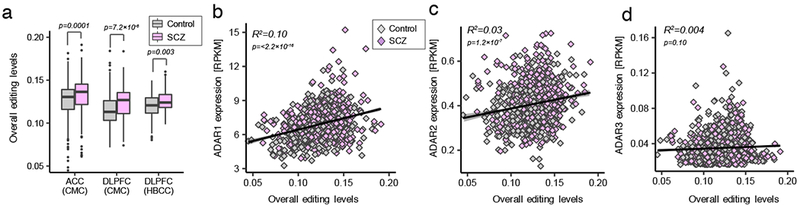
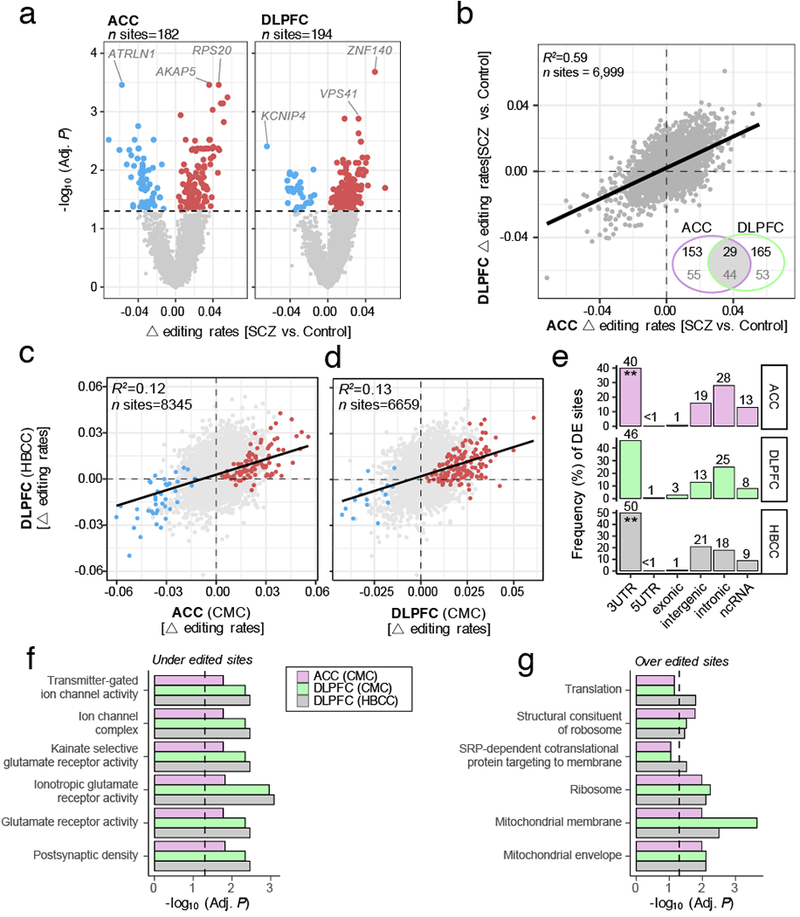
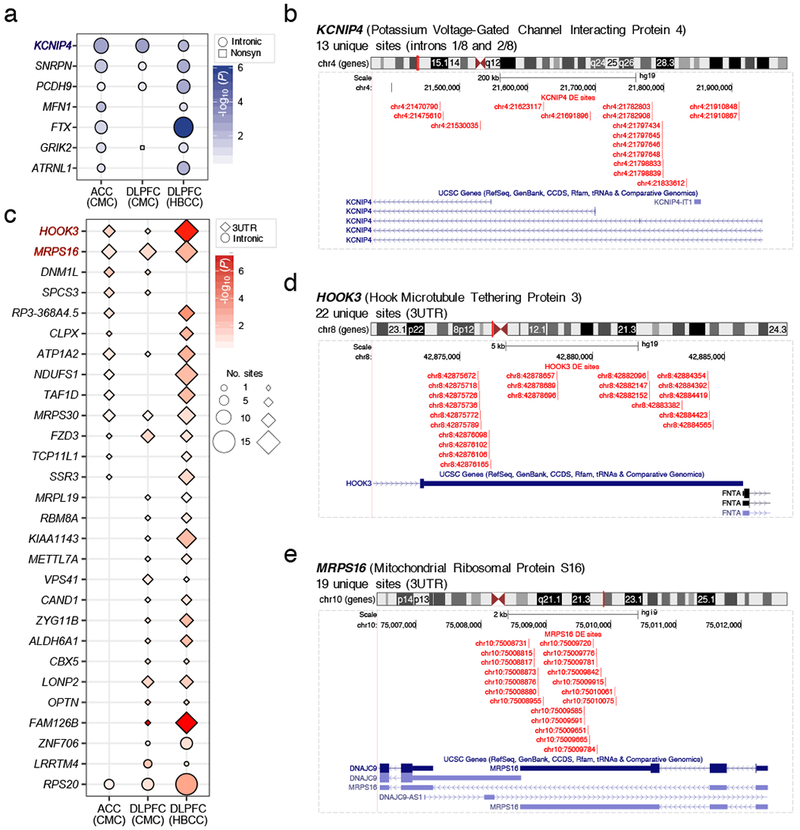
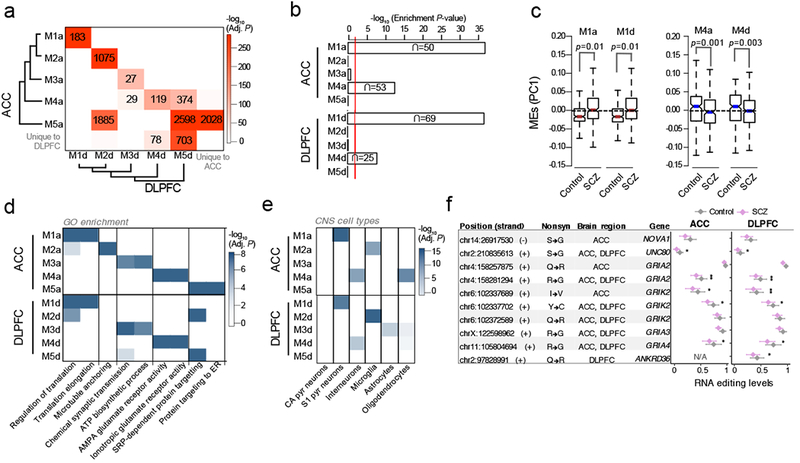
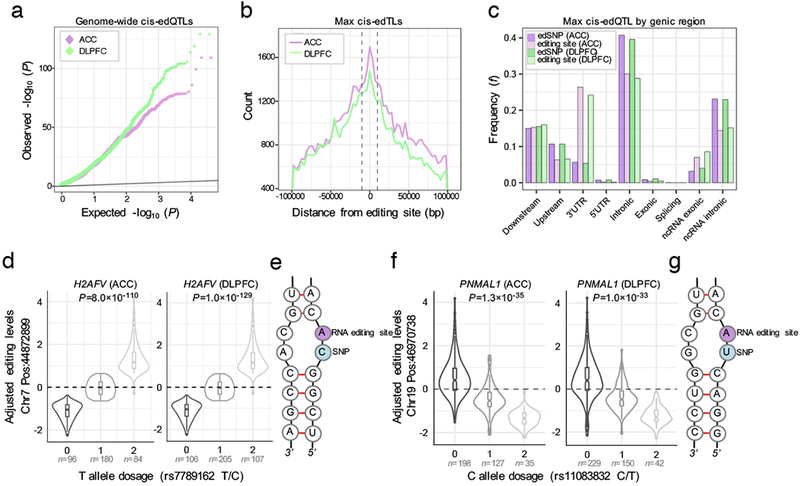
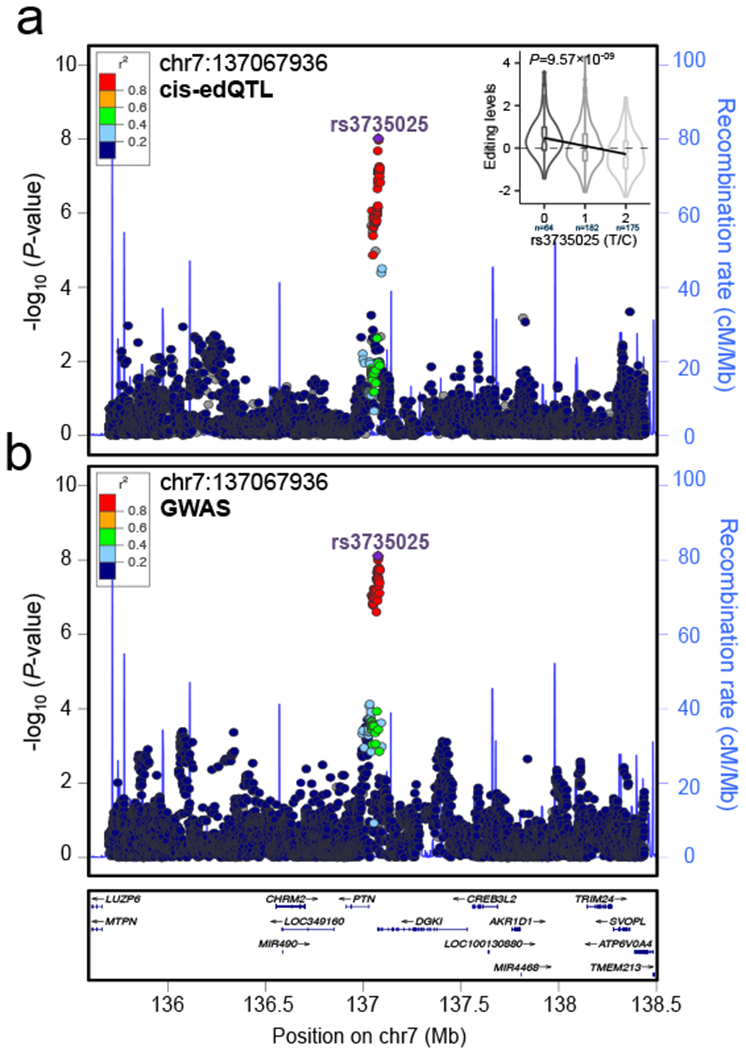
RNA editing critically regulates neurodevelopment and normal neuronal function. The global landscape of RNA editing was surveyed across 364 schizophrenia cases and 383 control postmortem brain samples from the CommonMind Consortium, comprising two regions: dorsolateral prefrontal cortex and anterior cingulate cortex. In schizophrenia, RNA editing sites in genes encoding AMPA-type glutamate receptors and postsynaptic density proteins were less edited, whereas those encoding translation initiation machinery were edited more. These sites replicate between brain regions, map to 3'-untranslated regions and intronic regions, share common sequence motifs and overlap with binding sites for RNA-binding proteins crucial for neurodevelopment. These findings cross-validate in hundreds of non-overlapping dorsolateral prefrontal cortex samples. Furthermore, ~30% of RNA editing sites associate with cis-regulatory variants (editing quantitative trait loci or edQTLs). Fine-mapping edQTLs with schizophrenia risk loci revealed co-localization of eleven edQTLs with six loci. The findings demonstrate widespread altered RNA editing in schizophrenia and its genetic regulation, and suggest a causal and mechanistic role of RNA editing in schizophrenia neuropathology.


Conflict of interest statement

COMPETING INTERESTS

None to declare.

Figures

Figure 1.
Figure 1.. Overview of the study design and analytic pipeline.
The samples used in this study were from participants in two large studies of schizophrenia in the United States who donated their brains upon death. A total of 364 unique schizophrenia cases and 383 unique controls were sampled in at least one brain region. Genome-wide RNA-seq data from the CommonMind Consortium (CMC) covered two brain regions, the ACC and the DLPFC, and these samples served as the discovery cohort. RNA-seq data of post-mortem DLPFC tissue was generated on behalf of NIMH Human Brain Collection Core (HBCC) and this second resource served as a validation cohort. Fastq files were aligned to the human reference genome and transcriptome (hg19) using STAR and bam files were sorted using samtools. RNA editing events were called from sorted bam files using the mpileup function in samtools together with customized perl scripts, which integrated all known RNA editing sites from the RADAR database. A series of internal filtering. quality control and imputation metrics were computed before moving downstream to overall RNA editing, differential RNA editing, co-editing and edQTL analyses.
Figure 2.
Figure 2.. Overall RNA editing profiles.
(a) Overall RNA editing levels across for the CMC ACC (ncontrol=245, nSCZ=225) and DLPFC (ncontrol=286, nSCZ=254) and HBCC DLPFC (ncontrol=217, nSCZ=100). A two-sided Mann-Whitney U test with continuity correction was used to test significance between diagnostic groups. Whisker box plots show median, lower and upper quartiles, and whiskers represent minimum and maximum of the data. Associations between expression levels of (b) ADAR1, (c) ADAR2 and (d) ADAR3 (quantified as the number of RNA-seq reads per kilobase of transcript per million mapped reads (RPKM)) and overall editing levels across all available ACC and DLPFC samples (including CMC and HBCC data). These concordance analyses were made across all samples (ncontrol=735, nSCZ=579) as the ACC and DLPFC showed highly collinear relationships. R2 values were calculated by robust linear regressions on overall editing levels and logarithmic transformed RPKM values.
Figure 3.
Figure 3.. Identification of differentially edited sites in SCZ.
Differential editing sites in the (a) ACC (ncontrol=245, nSCZ=225) and DLPFC (ncontrol=286, nSCZ=254). Dotted line marks a multiple test corrected level of significance (Adj. P < 0.05, limma, linear regression with Benjamini-Hochberg (BH) correction). Red points indicate over-edited sites and blue points indicate under-edited sites. For the top three sites, we outline their respective gene body. (b) Scatterplot of change (△) in editing rates for RNA editing sites in the ACC compared to the DLPFC. Inset Venn Diagram indicates the total number of significant overlapping sites (top value) and respective gene symbols (bottom value). Results were cross-validated for the (c) ACC (x-axis) and (d) DLPFC (x-axis), respective to △ editing rates within independent HBCC DLPFC samples (y-axis) (ncontrol=217, nSCZ=100). R2 values were calculated by robust linear regressions on △editing rates. Red and blue points indicate sites passing BH correction in the discovery sample. (e) Significantly differentially edited sites by genic region indicates a significant depletion of sites mapping to 3’UTR regions (Fisher’s Exact Test, P < 0.05,* Alternative hypothesis=less; ACC p=0.02; DLPFC p=0.01; NIMH HBCC DLPFC p=0.04). Functional annotation of the top five enrichment terms for (f) under-edited sites and (g) over-edited sites in SCZ were computed by a one-sided hypergeometric test and adjusted for multiple comparisons using Bonferroni correction.
Figure 4.
Figure 4.. Genes enriched with differential editing sites that replicate across two brain regions or across two cohorts.
Genes containing enrichment of differentially edited sites from the ACC (ncontrol=245, nSCZ=225) and DLPFC (ncontrol=286, nSCZ=254) as well the NIMH HBCC DLPFC sample (ncontrol=217, nSCZ=100) were examined. (a) Genes enriched for under-edited sites primarily map to intronic regions. (b) KCNIP4 contains 13 unique differential RNA editing sites, which are under-edited and span its first and second intron. These sites replicate across brain regions and withheld validation samples. Enrichment was calculated using the phyper hypergeometic function (lower.tail=FALSE). (c) Genes enriched for over-edited sites in SCZ. Over-edited sites primarily map to 3’UTR regions. (d) HOOK3 contains 22 unique differential RNA editing sites and (e) MRPS16 contains 19 unique differential RNA editing sites which are over-edited within their respective 3’UTR region. Note that genes FTX and NDUFS1 contain sites in more than one genic region, see Table S5 for full details. UCSC Genome Browser customized track options display the precise locations of editing sites within each gene.
Figure 5.
Figure 5.. Unsupervised co-editing network analysis.
(a) Overlap analysis of co-editing modules identified within the ACC and DLPFC. Unsupervised clustering was used to group modules by module eigengene (ME) values using Pearson’s correlation coefficient and Ward’s distance method. Significance of overlap was computed (one-sided Fisher exact test, Bonferroni correction) and p-values were colored on a continuous scale (bright red, strongly significant; white, no significance). The number of overlapping sites are displayed in each cell with a significant overlap. (b) Enrichment analysis of differentially edited sites within co-editing networks (one-sided hypergeometric test). (c) Assessment of ME values for modules M1a and M1d (over-edited) and M4a and M4d (under-edited). Differential ME analysis was conducted using a linear model and covarying for age, RIN, PMI, sample site and gender. (d) The top functional enrichment terms and (e) brain cell-type enrichment results for all identified modules, verifying similar functional and cell-type properties of co-editing networks in the ACC and DLPFC. Enrichment was computed using one-sided hypergeometric test and adjusted for multiple comparisons using Bonferroni correction. (f) A collection of nonsynonymous sites within SCZ-related AMPA glutamate receptor modules M4a and M4d (** indicates Adj. P <0.05, * indicates P < 0.05 derived from differential RNA editing analysis, see Table S1 for details). Whisker dot plots show mean and whiskers represent minimum and maximum standard error of the ACC (ncontrol=245, nSCZ=225) and DLPFC (ncontrol=286, nSCZ=254).
Figure 6.
Figure 6.. Brain cis-edQTL analysis.
(a) Quantile-Quantile plot for association testing genome-wide P-values between imputed genotype dosages and 11,242 RNA editing sites in the ACC (ncontrol=180, nSCZ=180) and 7,594 RNA editing sites in the DLPFC (ncontrol=210, nSCZ=211) (linear regression and FDR correction via matrixEQTL). (b) Distribution of the association tests in relation to the distance between the editing site and variant for max cis-edQTLs (that is, the most significant edSNP per site, if any). Vertical dotted lines indicate ± 5KB relative to the editing site. (c) Genic locations of edSNPs and corresponding editing sites. (d-g) Two examples of top cis-edQTLs with nearby editing sites replicating between brain regions with (e,g) predicted local RNA secondary base-pairing structures (dosage sample sizes are listed below each violin plot). Whisker violin plots show median, lower and upper quartiles, and whiskers represent minimum and maximum of adjusted RNA editing levels (y-axis) according to imputed genotype dosages (x-axis; linear regression and FDR correction via matrixEQTL).
Figure 7.
Figure 7.. Coloc2 fine-mapping analysis.
GWAS and edQTL summary statistics (beta, standard error) for SNPs within each GWAS locus were used as input for coloc2. Loci with posterior probability for hypothesis H4 (PPH4) greater than 0.5 were considered to have co-localized GWAS and edQTL signals. One example of co-localization between (a) cis-edQTL and (b) GWAS signal on chromosome 7 DGKI locus (PPH4=0.99). This specific co-localization event is specific to the DLPFC. LD estimates are colored with respect to the GWAS lead SNP (rs3735025) and coded as a heatmap from dark blue (0≥r2>0.2) to red (0.8≥r2>1.0). Recombination hotspots are indicated by the blue lines (recombination rate in cM Mb−1). (a) Inset violin plots reflects the association of editing between RNA editing site chr7:127067936 with SCZ risk allele at the GWAS index SNP in the respective loci (rs3735025; DLPFC, n0=64, n1=182, n2=175; P = 9.5×10−09, linear regression and FDR correction via matrixEQTL). Whisker violin plots show median, lower and upper quartiles, and whiskers represent minimum and maximum of adjusted RNA editing levels (y-axis) according to imputed genotype dosages (x-axis).

References

    1. McGrath J, Saha S, Chant D & Welham J Schizophrenia: A Concise Overview of Incidence, Prevalence, and Mortality. Epidemiologic Reviews 30, 67–76 (2008). - PubMed
    1. Owen M, Sawa A & Mortensen P Schizophrenia. The Lancet 388, 86–97 (2016). - PMC - PubMed
    1. Kirov G CNVs in neuropsychiatric disorders. Human Molecular Genetics 24, R45–R49 (2015). - PubMed
    1. Xu B et al. De novo gene mutations highlight patterns of genetic and neural complexity in schizophrenia. Nature Genetics 44, 1365–1369 (2012). - PMC - PubMed
    1. Takata A et al. Loss-of-Function Variants in Schizophrenia Risk and SETD1A as a Candidate Susceptibility Gene. Neuron 82, 773–780 (2014). - PMC - PubMed

REFERENCES (materials and methods)

    1. Dobin A, et al. STAR: ultrafast universal RNA-seq aligner. Bioinformatics 29, 15–21 (2013). - PMC - PubMed
    1. Ramaswami G & Li JB RADAR: a rigorously annotated database of A-to-I RNA editing. Nucleic acids research 42, D109–D113 (2014). - PMC - PubMed
    1. Li H, et al. The sequence alignment/map format and SAMtools. Bioinformatics 25, 2078–2079 (2009). - PMC - PubMed
    1. Buuren SV & Groothuis-Oudshoorn K, mice: Multivariate imputation by chained equations in R. Journal of statistical software 45, 1–68 (2010).
    1. Fromer M et al. Gene expression elucidates functional impact of polygenic risk for schizophrenia. Nature neuroscience 19, 1442–1452 (2016). - PMC - PubMed

Publication types