

The role of Xist-mediated Polycomb recruitment in the initiation of X-chromosome inactivation
- PMID: 31456285
- PMCID: PMC6776897
- DOI: 10.15252/embr.201948019
The role of Xist-mediated Polycomb recruitment in the initiation of X-chromosome inactivation
Abstract
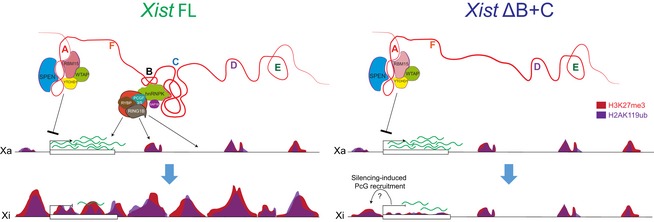
Xist RNA has been established as the master regulator of X-chromosome inactivation (XCI) in female eutherian mammals, but its mechanism of action remains unclear. By creating novel Xist-inducible mutants at the endogenous locus in male mouse embryonic stem (ES) cells, we dissect the role of the conserved A-B-C-F repeats in the initiation of XCI. We find that transcriptional silencing can be largely uncoupled from Polycomb repressive complex 1 and complex 2 (PRC1/2) recruitment, which requires B and C repeats. Xist ΔB+C RNA specifically loses interaction with PCGF3/5 subunits of PRC1, while binding of other Xist partners is largely unaffected. However, a slight relaxation of transcriptional silencing in Xist ΔB+C indicates a role for PRC1/2 proteins in early stabilization of gene repression. Distinct modules within the Xist RNA are therefore involved in the convergence of independent chromatin modification and gene repression pathways. In this context, Polycomb recruitment seems to be of moderate relevance in the initiation of silencing.
Keywords: Xist; PRC1; PRC2; X-chromosome inactivation; chromatin.
© 2019 The Authors. Published under the terms of the CC BY 4.0 license.
Conflict of interest statement
H.Y.C. is a co‐founder of Accent Therapeutics, Boundless Bio, and advisor to 10X Genomics, Arsenal Biosciences, and Spring Discovery. The other authors declare that they have no conflict of interest.
Figures
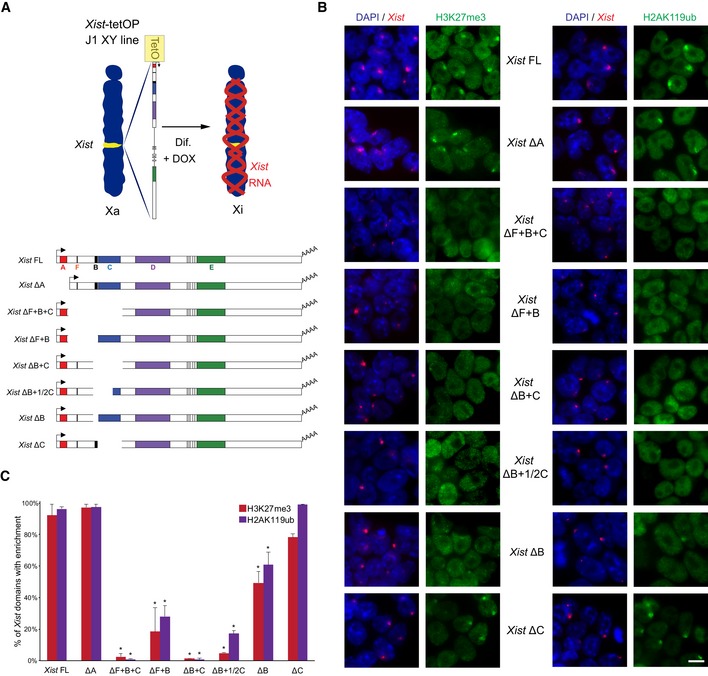
Schematic representation of the novel Xist‐TetOP mutants generated by CRISPR/Cas9 genome editing in J1 XY ESCs; the different repeats are highlighted in color boxes; Dif.—differentiation; DOX—doxycycline.
Representative images of combined IF for H3K27me3 or H2AK119ub (green) with RNA FISH for Xist (red) in Xist‐TetOP lines (for clone 1 of each mutant type) at day 2 of differentiation in DOX conditions; blue—DAPI staining; scale bar: 10 μm.
Graph represents the mean % + SEM of Xist‐coated X chromosomes enriched for H3K27me3 or H2AK119ub in the different Xist‐TetOP mutants (for clone 1 of each mutant type) from 2 to 4 independent experiments; a minimum of 50 Xist‐coated X chromosomes were counted per experiment; only P‐values corresponding to significant differences from unpaired Student's t‐test comparing mutants to Xist FL are indicated as * (P‐value < 0.05).
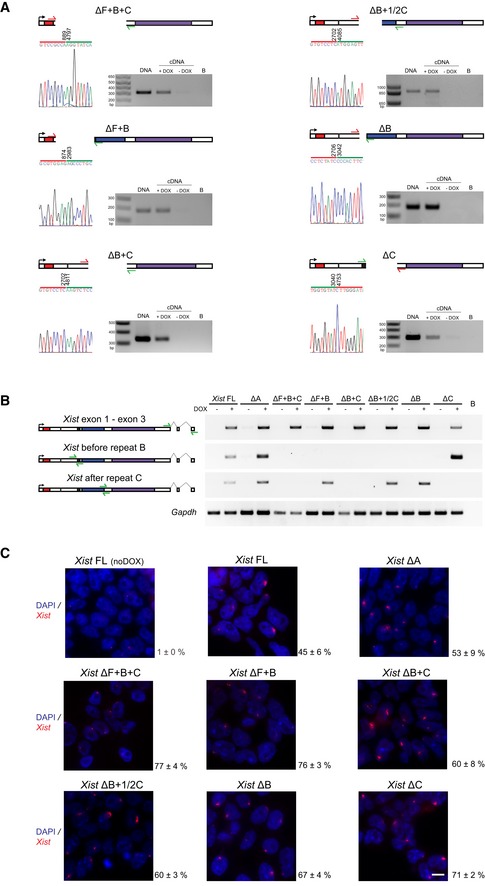
Deletion mapping by Sanger sequencing and expression analysis across deleted regions in the novel Xist ΔF+B+C, ΔB+F, ΔB+C, ΔB+1/2C, ΔB, and ΔC mutants (this analysis is for clone 1 of each mutant type); the scheme represents only the first exon of Xist, and the color code for repeats matches the one on Fig 1A; red arrows indicate forward primers, and green arrows represent reverse primers; the primer on the left is the sequencing primer for each mutant; B means PCR blank.
RT–PCR analysis of the splicing pattern and expression across the repeat B and C regions of the different Xist‐TetOP mutants using the primer pairs indicated in the scheme in green (Appendix Table S2); B means PCR blank.
Xist RNA FISH analysis upon D4 of differentiation in the presence of DOX (also noDOX for Xist FL) in the Xist ΔF+B+C, ΔB+F, ΔB+C, ΔB+1/2C, ΔB, and ΔC mutants (this analysis is for clone 1 of each mutant type); values represent the % ± SEM of cells with a Xist‐coated chromosome (at least three biological replicates with a minimum of 250 cells counted per replicate; only two biological replicates for Xist FL noDOX); scale bar: 10 μm.
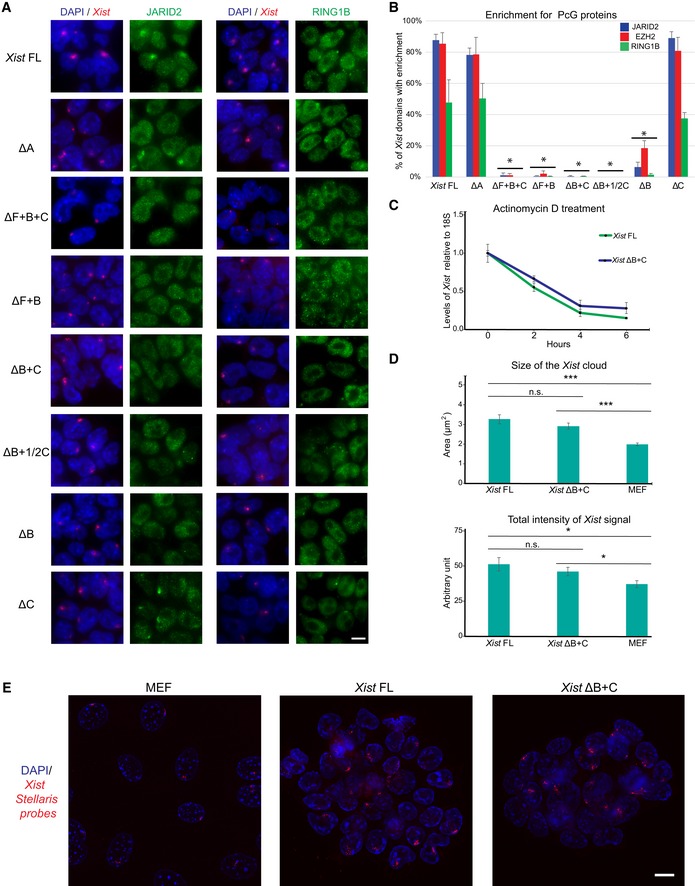
Representative images of combined IF for JARID2 (green) on the left and for RING1B (green) on the right with RNA FISH for Xist (red) in Xist‐TetOP lines (for clone 1 of each mutant type) upon D2 in the presence of DOX; DAPI in blue; scale bar: 10 μm.
Graph representing the mean % + SEM of Xist‐coated chromosomes enriched for JARID2, EZH2, and RING1B in the different Xist‐TetOP mutants (for clone 1 of each mutant type) from 2 to 4 independent experiments. A minimum of 50 Xist‐coated chromosomes were counted per experiment. Only P‐values corresponding to significant differences from unpaired Student's t‐test, comparing mutants to Xist FL, are indicated as *P < 0.05.
Normalized Xist RNA levels retrieved after actinomycin D treatment for 2, 4, and 6 h measured by RT–qPCR compared to 18S rRNA; shown are the mean of three independent biological replicates normalized to the non‐treated conditions (0 h); errors bars represent SEM.
Graph represents the mean area (above) and total intensity (below) of Xist RNA FISH signal in Xist FL and Xist ΔB+C‐induced cells at day 2 of differentiation and in female MEFs; error bars represent SEM; a minimum of 71 Xist signals were counted per cell line; significant differences from unpaired Student's t‐test, comparing mutants to Xist FL, are indicated as *P < 0.05 or ***P < 0.01.
Representative deconvoluted images from Z‐projection images of RNA FISH using Stellaris fluorescent‐labeled oligonucleotides targeting Xist in MEFs, Xist FL, and Xist ΔB+C‐induced cells used for the quantification used in Fig EV3B; Scale bar: 10 μm.
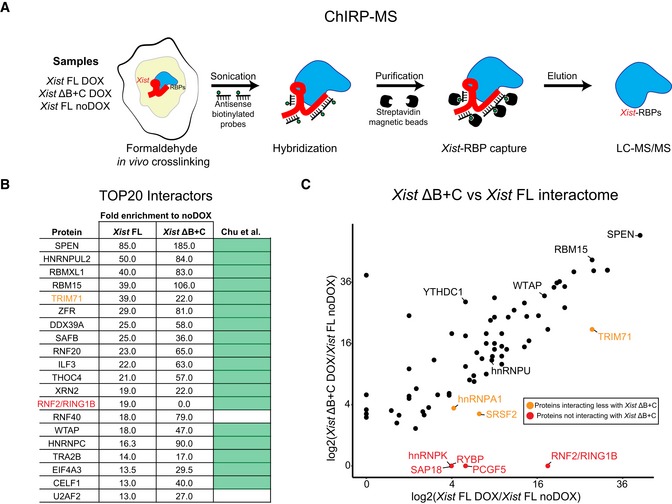
Scheme of the ChIRP‐MS workflow performed on Xist FL (DOX and noDOX conditions) and Xist ΔB+C (DOX) at day 3 of differentiation; RBP—RNA‐binding protein.
Top 20 protein hits from the ChIRP‐MS of Xist FL; the ranking was based on fold enrichment of Xist FL DOX versus Xist FL noDOX; weakly annotated protein isoforms with an Annotation score in UniProtKB < 3 (out of 5) were excluded; fold enrichment for Xist ΔB+C is also displayed for comparison; light green boxes correspond to proteins previously described by Chu et al 13 as Xist interactors; protein in red (RNF2/RING1B) represents a protein not found in the Xist ΔB+C interactome; protein in light brown (TRIM71) is less enriched in Xist ΔB+C than in Xist FL.
Scatter plot displaying the differences in peptide counts between Xist FL and Xist ΔB+C for the 74 out of 81 Xist interactors from Chu et al 13 with a minimum of fold change of 2.5 in Xist FL or Xist ΔB+C; shown is the log2 fold change in peptide counts of each mutant in DOX conditions compared with the Xist FL in noDOX conditions; proteins retrieved by both Xist FL and Xist ΔB+C ChIRPs with a proposed role in XCI such as SPEN, RBM15, WTAP, YTHDC1, and hnRNPU are indicated; light brown dots mark proteins more represented in Xist FL than in Xist ΔB+C ChIRPs, while red dots display proteins which are only retrieved by Xist FL ChIRP.
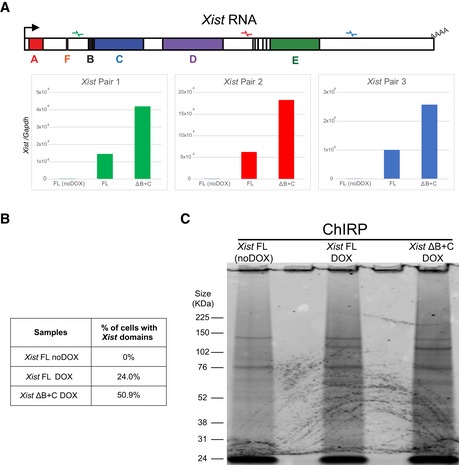
RT–qPCR with three primer pairs along Xist to evaluate RNA retrieval after ChIRP procedure for Xist FL (in noDOX and DOX conditions) and Xist ΔB+C (DOX) at day 3 of differentiation.
Table showing the percentage of cells exhibiting a Xist‐coated X chromosome for Xist FL (both noDOX and DOX) and Xist ΔB+C (DOX) as determined by Xist RNA FISH used for ChIRP‐MS; a minimum of 500 cells were counted.
Blot visualized with Coomassie blue staining showing the band pattern of proteins displayed by Xist FL (both noDOX and DOX) and Xist ΔB+C (DOX) after ChIRP.
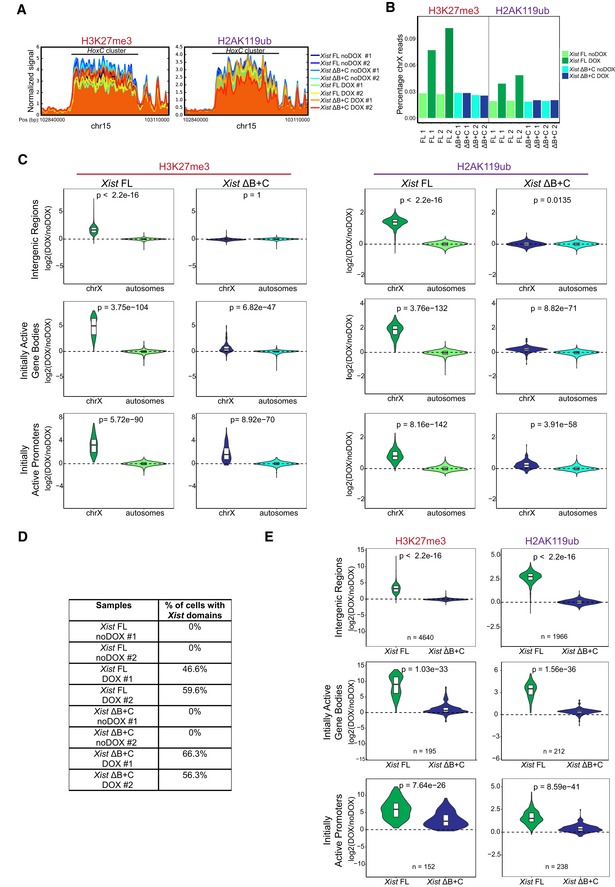
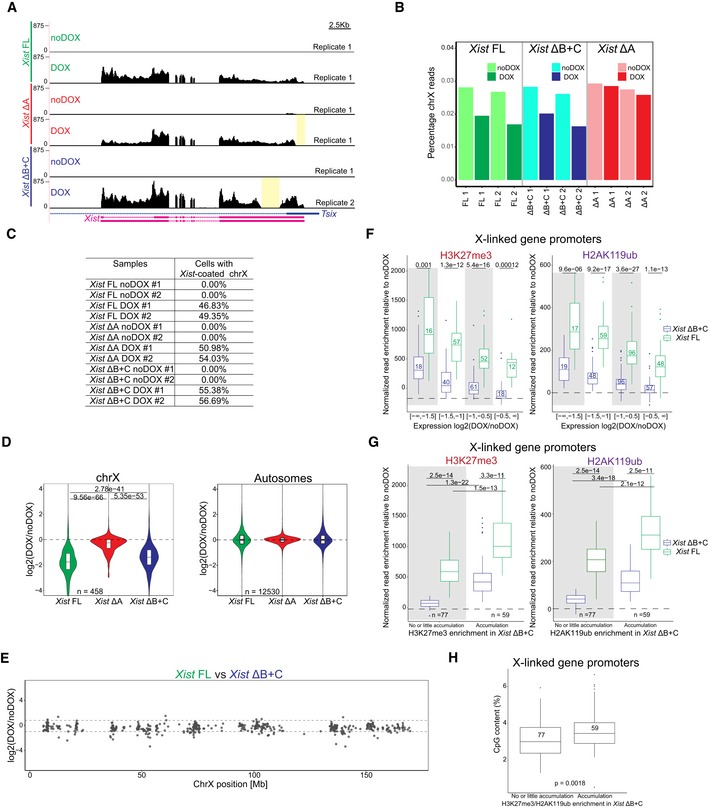
Normalized signal of H3K27me3 and H2AK119ub around HoxC cluster (chr15: 102,840,000–103,110,000); shown is the signal of each sample around these cluster, normalized by the size of the library.
Barplot representing percentages of H3K27me3 and H2AK119ub reads mapping on X chromosome (chrX) in each sample.
Violin plots quantifying H3K27me3 and H2AK119ub enrichment over intergenic regions, initially active promoters, and initially active gene bodies on chrX and on autosomes in Xist FL and Xist ΔB+C cell lines upon DOX induction at day 2 of differentiation; shown is the distribution of the calculated log2 fold change in DOX versus noDOX conditions, the horizontal band is the median, and the lower and upper hinges correspond to the 25th and 75th percentiles; P‐values were calculated using unilateral Wilcoxon test, comparing chrX and autosomal enrichment of PcG marks for each genomic region.
Table showing the percentage of cells exhibiting a Xist‐coated chrX for the different duplicates of Xist FL and Xist ΔB+C in DOX and noDOX conditions as determined by Xist RNA FISH; a minimum of 500 cells were counted to calculate the percentage of cells with a Xist‐coated chrX.
Violin plots quantifying H3K27me3 and H2AK119ub enrichment over intergenic regions, initially active promoters, and gene bodies on chrX in Xist FL and Xist ΔB+C upon DOX induction at day 2 of differentiation after normalization for the percentage of cells with Xist‐coated chromosomes. Shown is the distribution of the calculated log2 fold change in DOX versus noDOX conditions, the horizontal band is the median, and the lower and upper hinges correspond to the 25th and 75th percentiles; n = indicates the number of genes analyzed; P‐values were calculated using a paired Wilcoxon test, comparing Xist FL and Xist ΔB+C cell lines.
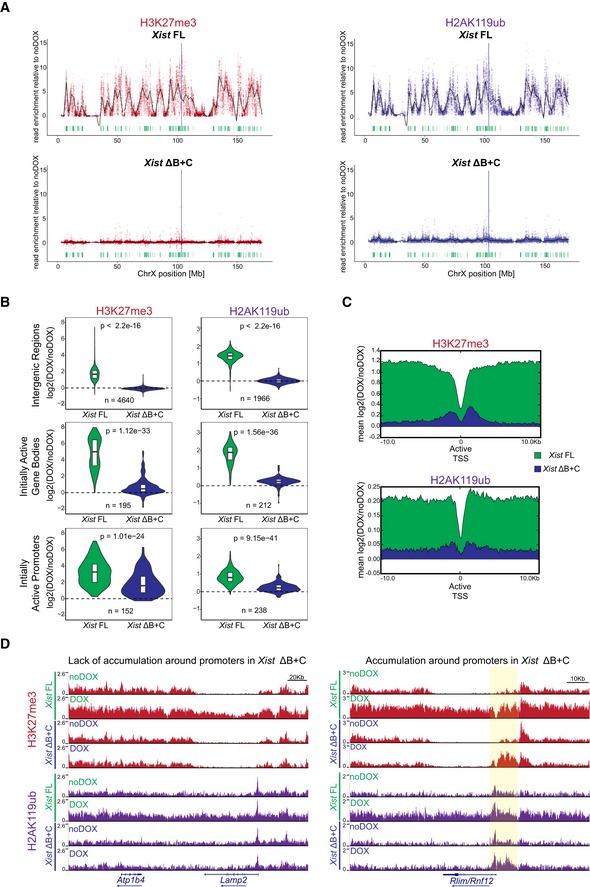
Plots showing H3K27me3 and H2AK119ub accumulation over the X chromosome in Xist FL and Xist ΔB+C cell lines upon DOX induction at day 2 of differentiation; each dot represents a single 10‐kb window and its enrichment relative to noDOX condition; black line is a loess regression on all windows; Xist locus is represented by a blue long line, and active genes by green lines.
Violin plots quantifying H3K27me3 and H2AK119ub enrichment over intergenic regions, initially active promoters, and initially active gene bodies in the X chromosome in Xist FL and Xist ΔB+C cell lines at D2 upon DOX induction; shown is the log2 fold change in DOX versus noDOX conditions; violin plots represent the distribution of the values, the horizontal band is the median, and the lower and upper hinges correspond to the 25th and 75th percentiles; n = indicates the number of regions/genes analyzed; P‐values were calculated using a paired Wilcoxon test, comparing Xist FL and Xist ΔB+C cell lines.
Average plots showing the mean enrichment of H3K27me3 (top) and H2AK119ub (bottom) over all X‐linked initially active transcriptional start sites (TSS); shown is the mean of normalized log2 enrichment of DOX versus noDOX in both Xist FL and Xist ΔB+C cell lines.
Genome browser plots showing H3K27me3 (top) and H2AK119ub (bottom) enrichments in a region encompassing the inactive Atp1b4 and the initially active Lamp2 genes within the XqA3.3 region and the initially active Rlim/Rnf12 gene at the XqD region; region around the promoter of Rlim/Rnf12 is highlighted in yellow.
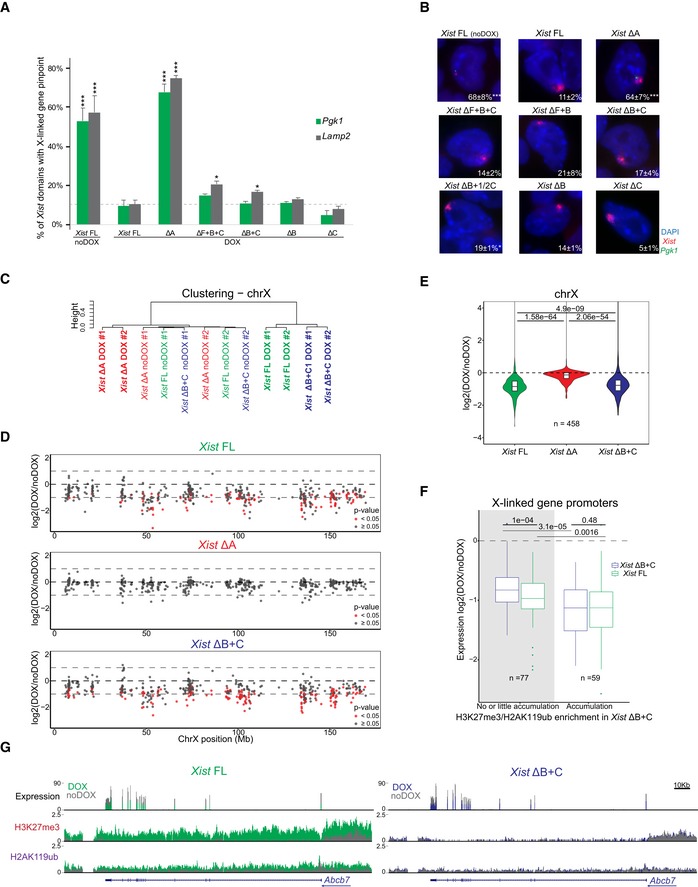
Graph represents the mean % + SEM of Xist‐coated chromosomes presenting an active Pgk1 or Lamp2 gene as determined by RNA FISH (as represented in B) at day 2 of differentiation in the presence of DOX (Xist FL was also used in noDOX conditions) in the different Xist‐TetOP mutants; each bar represents the mean from 2 to 4 independent experiments; a minimum of 59 Xist‐coated chromosomes were counted per experiment; for Xist FL noDOX, a minimum of 100 cells (which do not have Xist‐coated chromosome) were counted; only P‐values corresponding to significant differences comparing mutants (or Xist FL noDOX) to Xist FL DOX are indicated as * (P < 0.05) or *** (P < 0.01), unpaired Student's t‐test; dashed line marks the mean percentage of silencing for the Lamp2 gene in Xist FL DOX.
Representative RNA FISH images for Xist (red) and nascent transcript of Pgk1 (green) in Xist‐TetOP lines at day 4 of differentiation in the presence of DOX (Xist FL is also shown in noDOX conditions); DNA stained in blue by DAPI; numbers represent % of Xist‐coated X chromosomes ± SEM with active Pgk1 gene (except for Xist FL noDOX, where numbers represent % of cells with Pgk1 active gene); the values represent 2–4 independent experiments, where a minimum of 50 Xist‐coated chromosomes were counted per experiment; significant differences compared with Xist FL (DOX) are indicated as * (P < 0.05) or *** (P < 0.01), unpaired Student's t‐test.
Clustering analysis of the normalized RNA‐seq counts on the X chromosome (chrX) for all the duplicates of Xist FL, Xist ΔA, and Xist ΔB+C in DOX and noDOX conditions.
Plots display the log2 (fold change) in the expression of X‐linked genes along the chrX comparing DOX versus noDOX samples for Xist FL, Xist ΔA, and Xist ΔB+C at day 2 of differentiation; red dots correspond to genes which are differently expressed in DOX versus noDOX (P < 0.05, Limma t‐test), and while gray dots represent genes which are not differentially expressed between the two conditions (P ≥ 0.05).
Violin plots displaying the average log2 (fold change) in gene expression between DOX and noDOX conditions on the chrX in Xist FL, Xist ΔA, and Xist ΔB+C at day 2 of differentiation; violin plots represent the distribution of the values, the horizontal band is the median, and the lower and upper hinges correspond to the 25th and 75th percentiles; P‐values were calculated using a paired Wilcoxon test; n = indicates the number of genes analyzed.
Box plots displaying the log2 (DOX/noDOX) fold change in expression of X‐linked genes in Xist FL and Xist ΔB+C categorized according to the enrichment of H3K27me3 and H2AK119ub marks at promoters in Xist ΔB+C upon DOX induction (with no or little accumulation versus accumulation); the horizontal band of the box plot is the median of the values, the lower and upper hinges correspond to the 25th and 75th percentiles, the upper whisker extends from the hinge to the largest value not further than 1.5 interquartile range from the hinge, and the lower whisker extends from the hinge to the smallest value at most 1.5 interquartile range of the hinge; P‐values between samples were calculated using a paired Wilcoxon test; n = indicates the number of genes analyzed.
Genome browser plots showing RNA‐seq reads, H3K27me3, and H2AK119ub nChIP reads around the Abcb7 gene for Xist FL (left) and Xist ΔB+C (right) at day 2 of differentiation in both DOX and noDOX conditions.
- A
Genome browser plots showing RNA‐seq reads on Xist/Tsix genes for Xist FL, Xist ΔA, and Xist ΔB+C mutants in DOX and noDOX conditions at day 2 of differentiation; yellow boxes display the deleted regions in both Xist ΔA and Xist ΔB+C.
- B
Barplot representing percentages of RNA‐seq reads mapping on X chromosome (chrX) in each sample.
- C
Table showing the percentage of cells exhibiting an Xist‐coated chrX for the different duplicates of Xist FL, Xist ΔA, and Xist ΔB+C in DOX and noDOX conditions as determined by Xist RNA FISH; at least 500 cells were counted to estimate the percentage of cells with a Xist‐coated chrX.
- D
Violin plots displaying the distribution of the average log2(fold change) in gene expression between DOX and noDOX conditions on chrX and autosomes in Xist FL, Xist ΔA, and Xist ΔB+C after normalization for the percentage of cells with a Xist‐coated chrX; the horizontal band is the median of the values, and the lower and upper hinges correspond to the 25th and 75th percentiles; n = indicates the number of genes analyzed; P‐values for chrX were calculated using a paired Wilcoxon test.
- E
Plots display the comparison of log2(fold change) in X‐linked gene silencing upon DOX induction between Xist FL and Xist ΔB+C at day 2 of differentiation; Limma t‐test did not find any gene differentially expressed between Xist FL and Xist ΔB+C.
- F
Box plots displaying the normalized read enrichment at promoters for H3K27me3 and H2AK119ub upon DOX induction for distinct categories of X‐linked genes with different degrees of gene silencing between DOX and noDOX conditions in both Xist FL and Xist ΔB+C; the horizontal band of the box plot is the median of the values, the lower and upper hinges correspond to the 25th and 75th percentiles, the upper whisker extends from the hinge to the largest value not further than 1.5 interquartile range from the hinge, and the lower whisker extends from the hinge to the smallest value at most 1.5 interquartile range of the hinge; P‐values were calculated using a Wilcoxon test; numbers inside the box plots indicate the number of genes analyzed.
- G
Box plots displaying H3K27me3 and H2AK119ub normalized enrichment levels at promoters upon induction in two categories of X‐linked genes: with no or little accumulation versus with accumulation of these PcG marks in induced Xist ΔB+C cells; the horizontal band of the box plot is the median of the values, the lower and upper hinges correspond to the 25th and 75th percentiles, the upper whisker extends from the hinge to the largest value not further than 1.5 interquartile range from the hinge, and the lower whisker extends from the hinge to the smallest value at most 1.5 interquartile range of the hinge; P‐values were calculated using a Wilcoxon test; n = indicates the number of genes analyzed.
- H
Box plots displaying the CpG content of promoters that accumulate or not H3K27me3/H2AK119ub between noDOX and DOX conditions in Xist ΔB+C at day 2 of differentiation; the horizontal band of the box plot is the median of the values, and the lower and upper hinges correspond to the 25th and 75th percentiles; the upper whisker extends from the hinge to the largest value not further than 1.5 interquartile range from the hinge, and the lower whisker extends from the hinge to the smallest value at most 1.5 interquartile range of the hinge; P‐values were calculated using a Wilcoxon test; numbers inside the box plots indicate the number of promoters analyzed.
Similar articles
-
hnRNPK Recruits PCGF3/5-PRC1 to the Xist RNA B-Repeat to Establish Polycomb-Mediated Chromosomal Silencing.Mol Cell. 2017 Dec 7;68(5):955-969.e10. doi: 10.1016/j.molcel.2017.11.013. Mol Cell. 2017. PMID: 29220657 Free PMC article.
-
PCGF3/5-PRC1 initiates Polycomb recruitment in X chromosome inactivation.Science. 2017 Jun 9;356(6342):1081-1084. doi: 10.1126/science.aal2512. Science. 2017. PMID: 28596365 Free PMC article.
-
Xist Repeats A and B Account for Two Distinct Phases of X Inactivation Establishment.Dev Cell. 2020 Jul 6;54(1):21-32.e5. doi: 10.1016/j.devcel.2020.05.021. Epub 2020 Jun 11. Dev Cell. 2020. PMID: 32531209 Free PMC article.
-
Polycomb complexes in X chromosome inactivation.Philos Trans R Soc Lond B Biol Sci. 2017 Nov 5;372(1733):20170021. doi: 10.1098/rstb.2017.0021. Philos Trans R Soc Lond B Biol Sci. 2017. PMID: 28947664 Free PMC article. Review.
-
The many faces of Polycomb regulation by RNA.Curr Opin Genet Dev. 2020 Apr;61:53-61. doi: 10.1016/j.gde.2020.02.023. Epub 2020 May 11. Curr Opin Genet Dev. 2020. PMID: 32403014 Free PMC article. Review.
Cited by
-
Advances in Non-Coding RNA Sequencing.Noncoding RNA. 2021 Oct 30;7(4):70. doi: 10.3390/ncrna7040070. Noncoding RNA. 2021. PMID: 34842804 Free PMC article. Review.
-
H4K20me1 and H3K27me3 are concurrently loaded onto the inactive X chromosome but dispensable for inducing gene silencing.EMBO Rep. 2021 Mar 3;22(3):e51989. doi: 10.15252/embr.202051989. Epub 2021 Feb 19. EMBO Rep. 2021. PMID: 33605056 Free PMC article.
-
The Role of cis- and trans-Acting RNA Regulatory Elements in Leukemia.Cancers (Basel). 2020 Dec 20;12(12):3854. doi: 10.3390/cancers12123854. Cancers (Basel). 2020. PMID: 33419342 Free PMC article. Review.
-
Elements at the 5' end of Xist harbor SPEN-independent transcriptional antiterminator activity.Nucleic Acids Res. 2020 Oct 9;48(18):10500-10517. doi: 10.1093/nar/gkaa789. Nucleic Acids Res. 2020. PMID: 32986830 Free PMC article.
-
Xist-mediated silencing requires additive functions of SPEN and Polycomb together with differentiation-dependent recruitment of SmcHD1.Cell Rep. 2022 May 17;39(7):110830. doi: 10.1016/j.celrep.2022.110830. Cell Rep. 2022. PMID: 35584662 Free PMC article.
References
-
- Rutenberg‐Schoenberg M, Sexton AN, Simon MD (2016) The properties of long noncoding RNAs that regulate chromatin. Annu Rev Genomics Hum Genet 17: 69–94 - PubMed
-
- da Rocha ST, Heard E (2017) Novel players in X inactivation: insights into Xist‐mediated gene silencing and chromosome conformation. Nat Struct Mol Biol 24: 197–204 - PubMed
Publication types
MeSH terms
Substances
Associated data
- Actions
Grants and funding
- PTDC/BIA-MOL/29320/2017/MEC|Fundação para a Ciência e a Tecnologia (FCT)/International
- UID/BIM/50005/2019/MEC|Fundação para a Ciência e a Tecnologia (FCT)/International
- 201369/Z/16/Z/WT_/Wellcome Trust/United Kingdom
- ERC-ADG-2014 671027/EC|H2020|H2020 Priority Excellent Science|H2020 European Research Council (ERC)/International
- NIH P50-HG007735/National Institute for Health Research (NIHR)/International
LinkOut - more resources
Full Text Sources
Other Literature Sources
Molecular Biology Databases
