. 2019 Aug 13:10:1881.
doi: 10.3389/fmicb.2019.01881. eCollection 2019.

The Kinetochore Protein Spc105, a Novel Interaction Partner of LaeA, Regulates Development and Secondary Metabolism in Aspergillus flavus

Affiliations

The Kinetochore Protein Spc105, a Novel Interaction Partner of LaeA, Regulates Development and Secondary Metabolism in Aspergillus flavus

Qing-Qing Zhi et al. Front Microbiol. .

Abstract

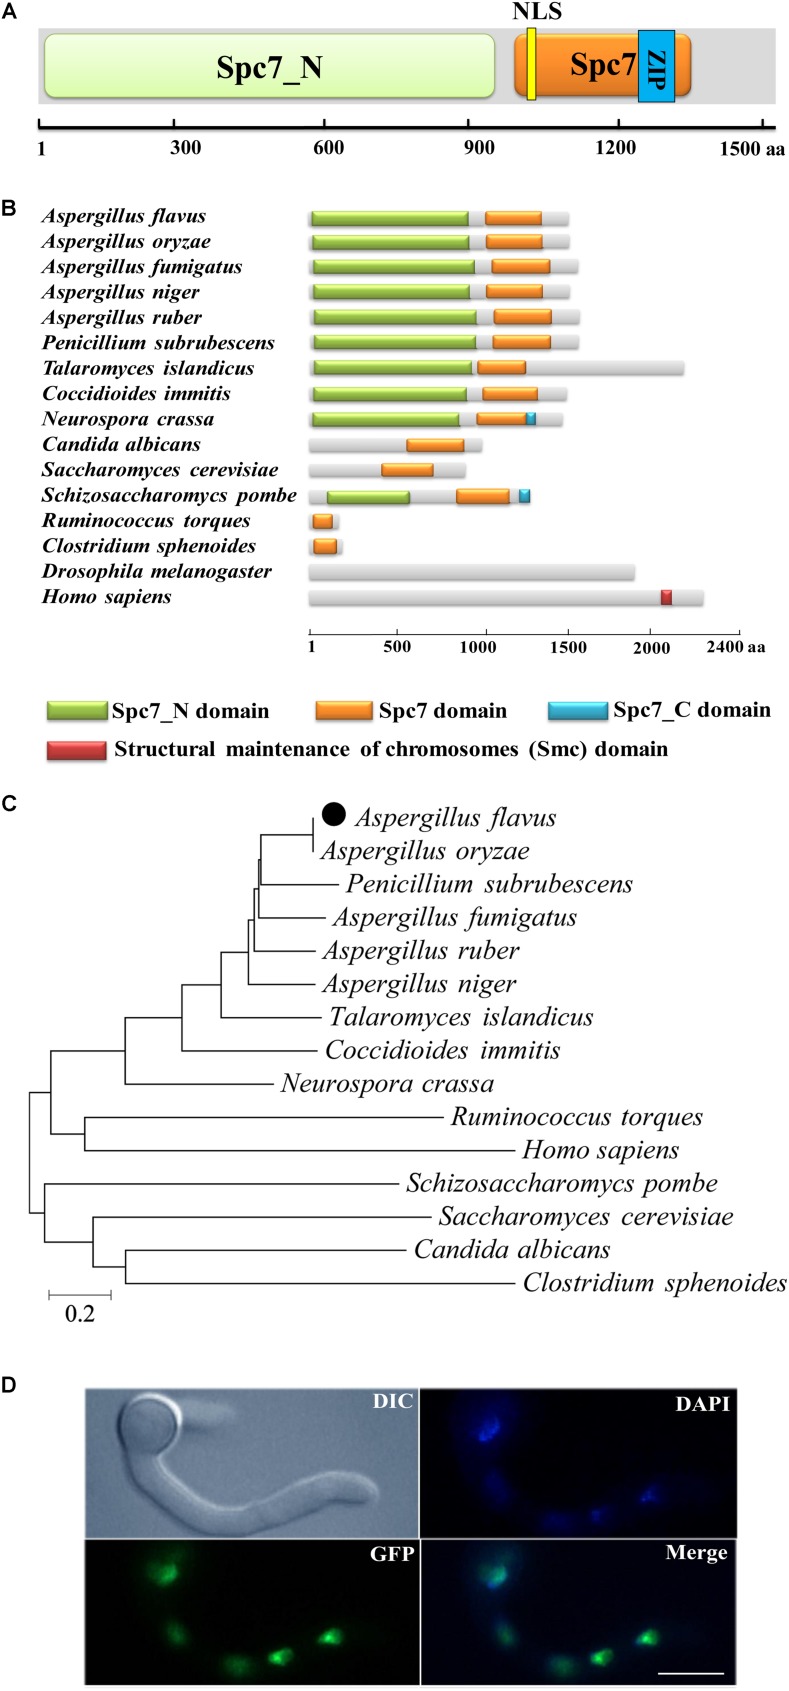
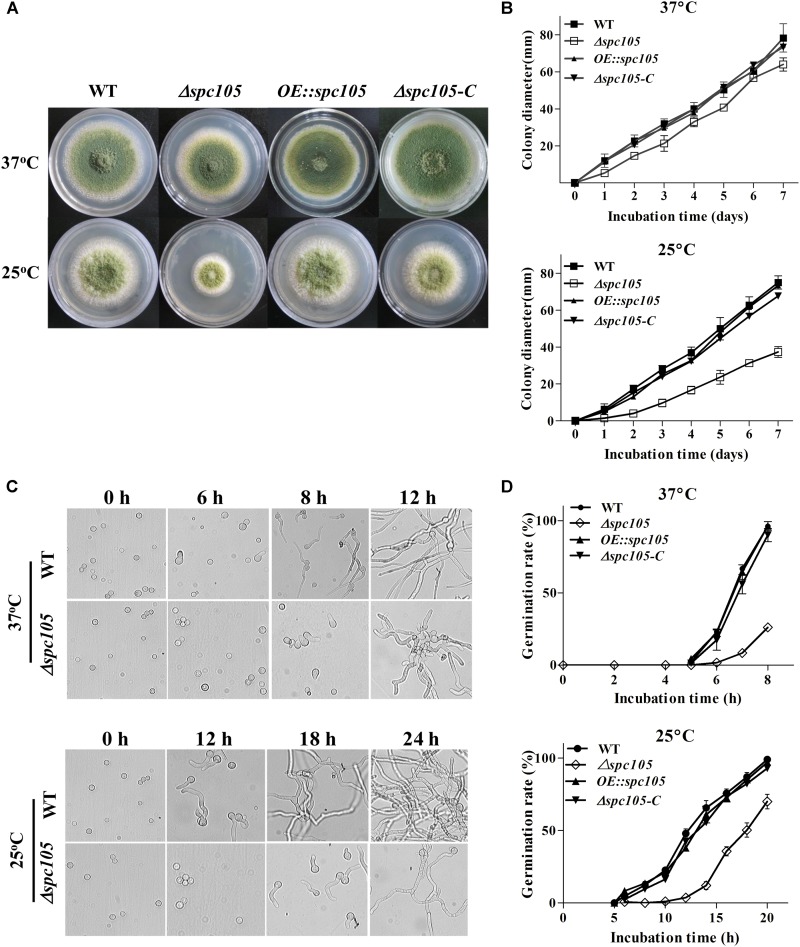
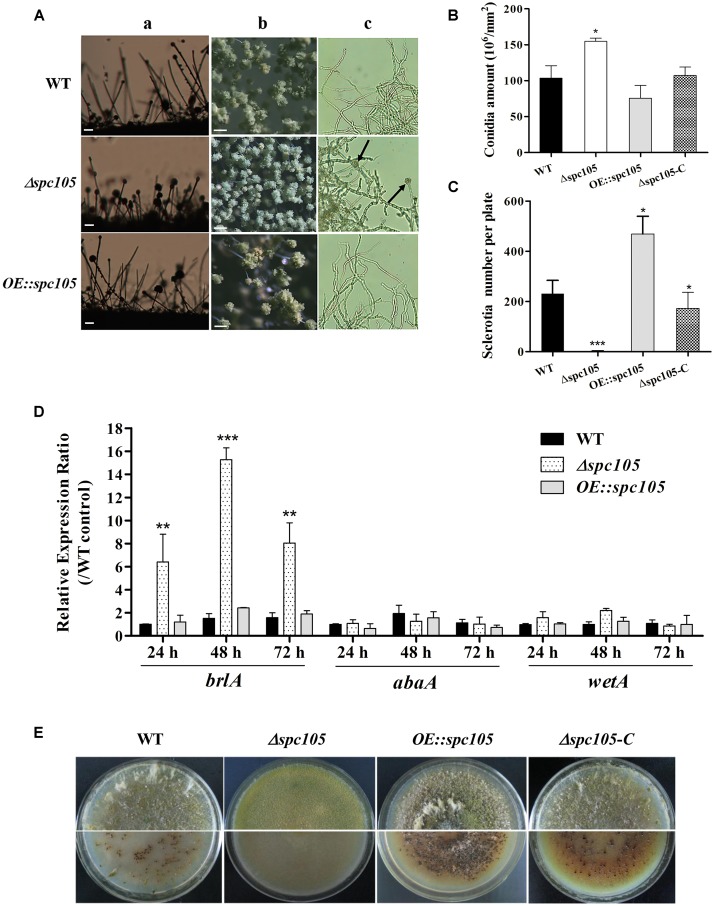
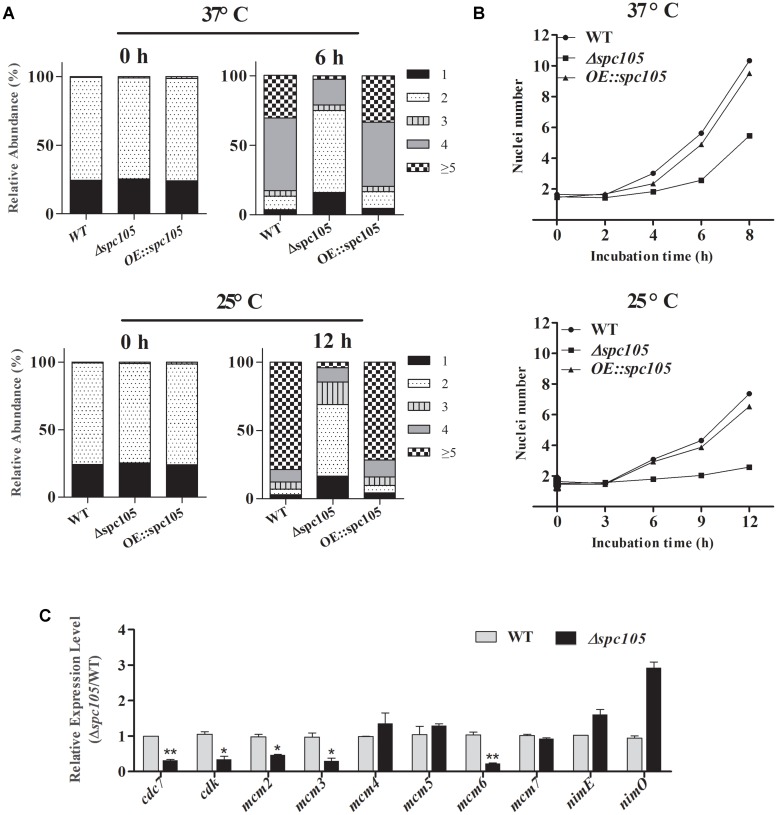
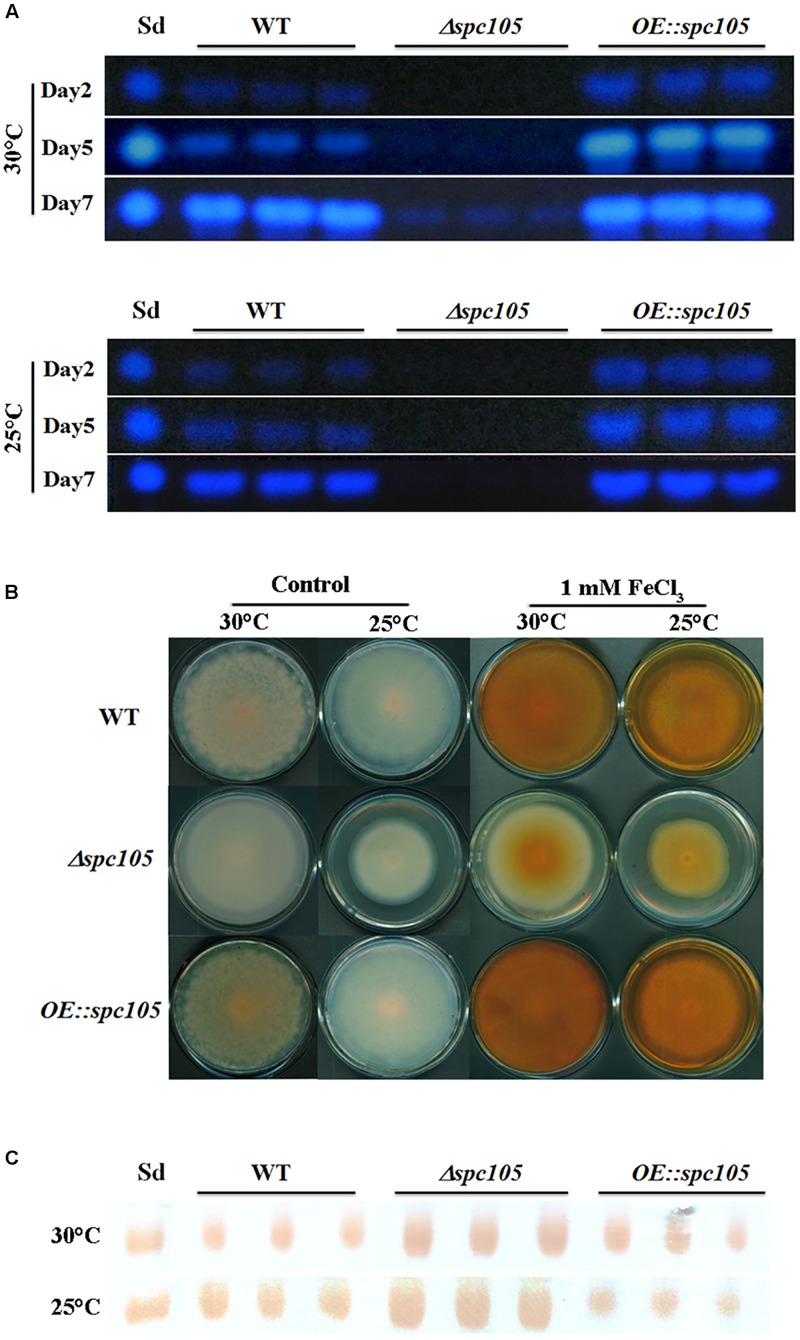
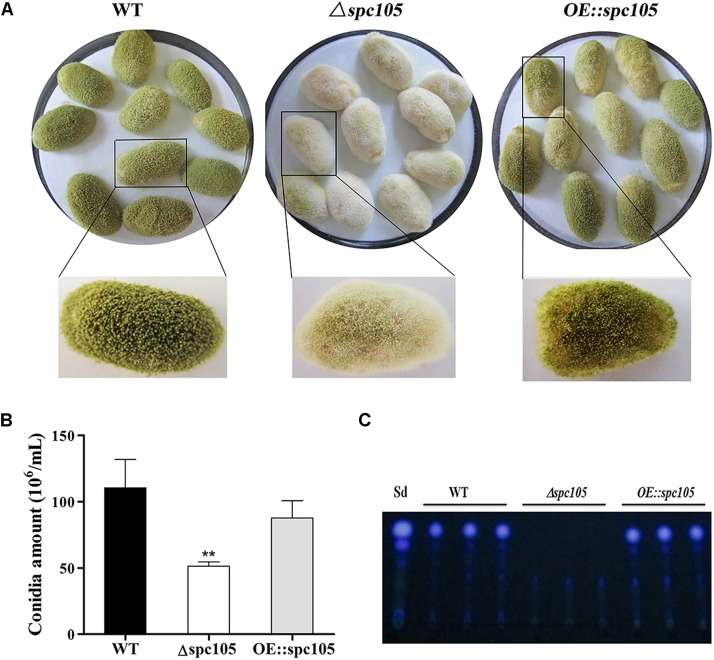
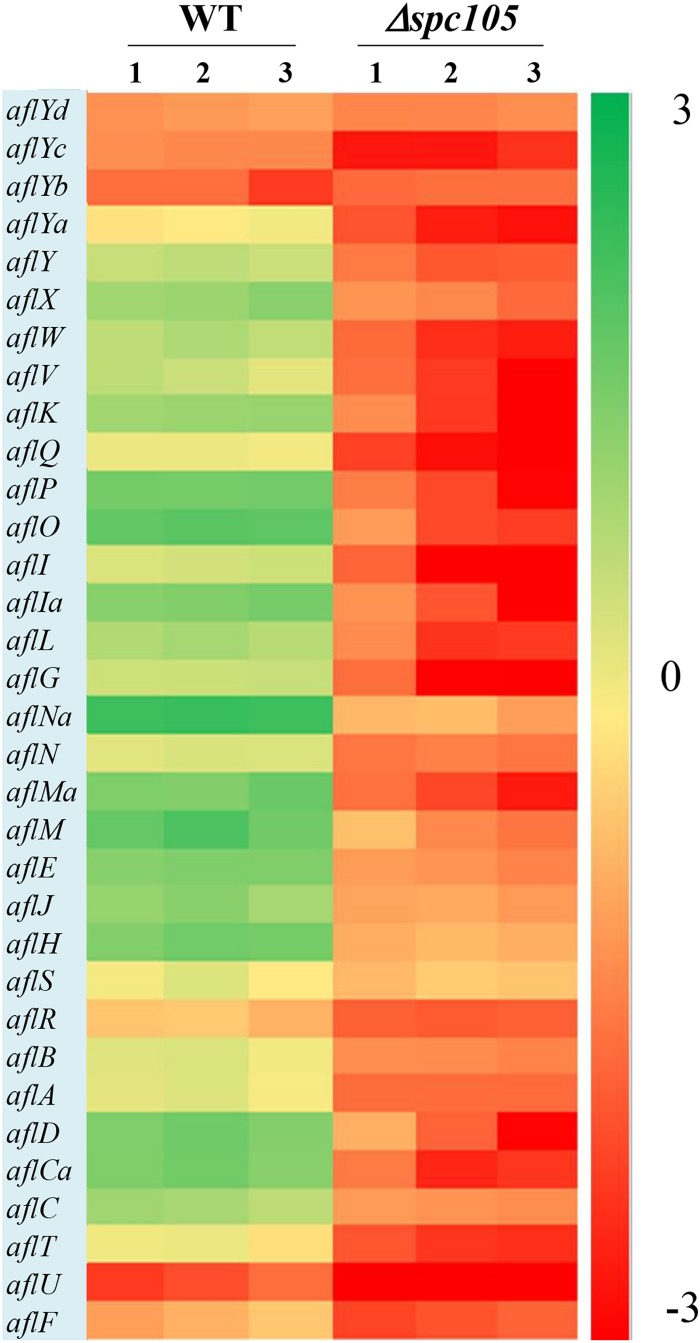
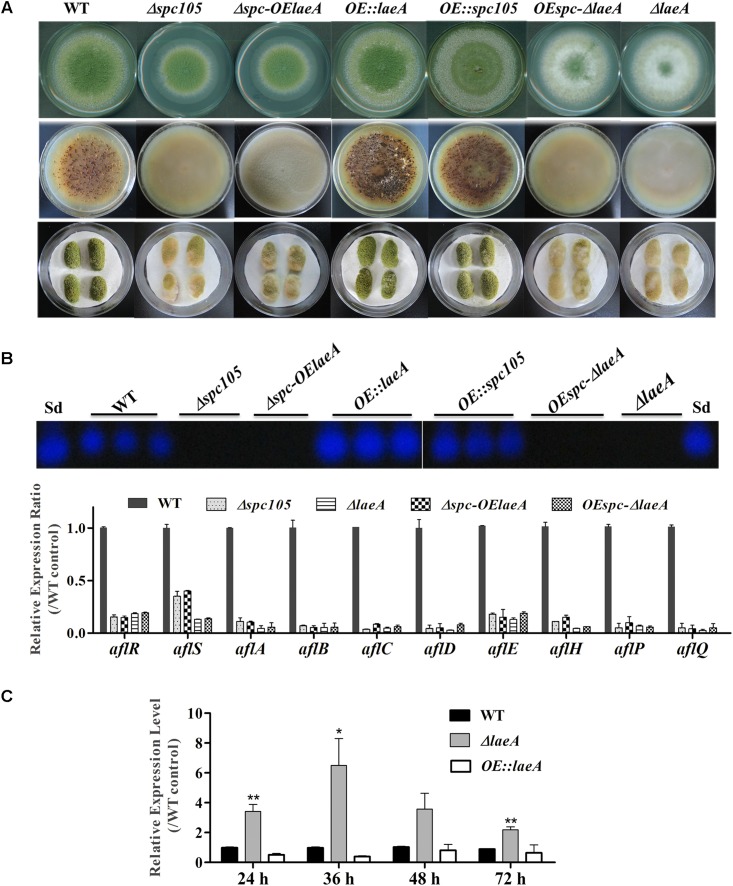
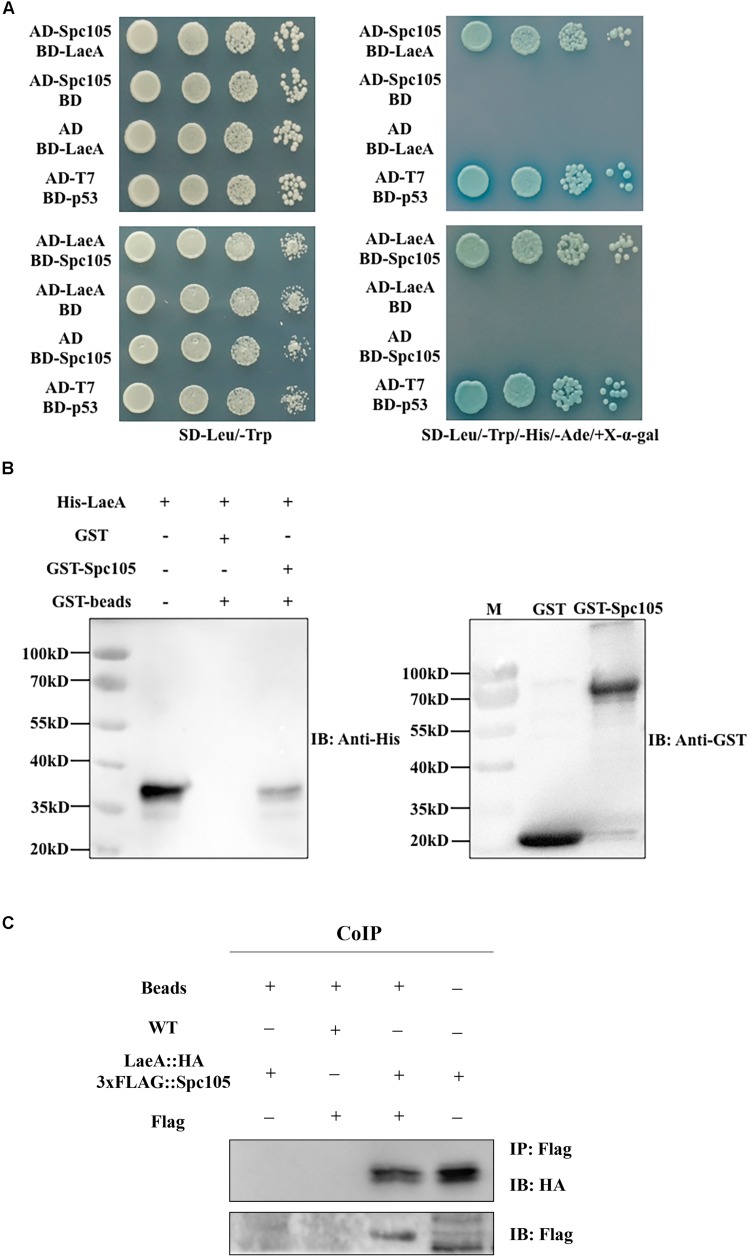
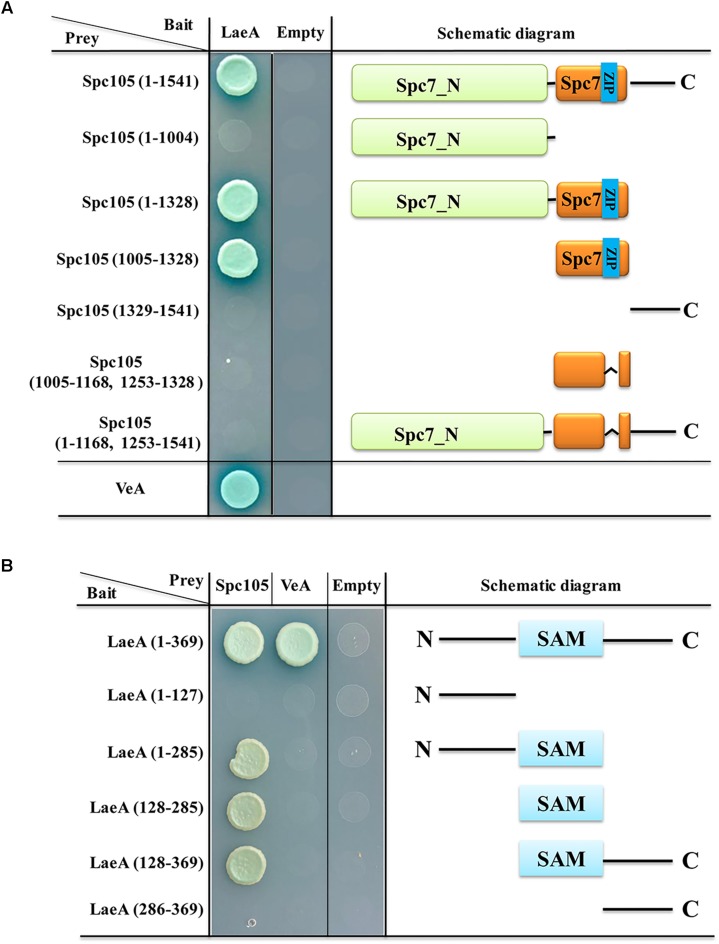
Nuclear protein LaeA is known as the global regulator of secondary metabolism in Aspergillus. LaeA connects with VeA and VelB to form a heterotrimeric complex, which coordinates fungal development and secondary metabolism. Here, we describe a new interaction partner of LaeA, the kinetochore protein Spc105, from the aflatoxin-producing fungus Aspergillus flavus. We showed that in addition to involvement in nuclear division, Spc105 is required for normal conidiophore development and sclerotia production of A. flavus. Moreover, Spc105 positively regulates the production of secondary metabolites such as aflatoxin and kojic acid, and negatively regulates the production of cyclopiazonic acid. Transcriptome analysis of the Δspc105 strain revealed that 23 backbone genes were differentially expressed, corresponding to 19 of the predicted 56 secondary metabolite gene clusters, suggesting a broad regulatory role of Spc105 in secondary metabolism. Notably, the reduced expression of laeA in our transcriptome data led to the discovery of the correlation between Spc105 and LaeA, and double mutant analysis indicated a functional interdependence between Spc105 and LaeA. Further, in vitro and in vivo protein interaction assays revealed that Spc105 interacts directly with the S-adenosylmethionine (SAM)-binding domain of LaeA, and that the leucine zipper motif in Spc105 is required for this interaction. The Spc105-LaeA interaction identified in our study indicates a cooperative interplay of distinct regulators in A. flavus, providing new insights into fungal secondary metabolism regulation networks.

Keywords: Aspergillus flavus; LaeA; Spc105; aflatoxin; protein interaction; secondary metabolism.


Figures

FIGURE 1
FIGURE 1
Preliminary characterization of A. flavus Spc105. (A) Graphical representation of A. flavus Spc105 protein. NLS, bipartite nuclear localization signal; ZIP, leucine zipper motif. (B) Domain analysis of Spc105 protein between different species. (C) Phylogenetic analysis of Spc105 proteins. A neighbor-joining phylogenetic tree was constructed based on sequence alignments of Spc105 proteins using ClustalX2. (D) Localization of Spc105 in A. flavus. GFP was fused to the N-terminal of Spc105. Nuclei were stained with 100 ng/ml of 4′,6-diamidino-2-phenylindole (DAPI) and examined by fluorescence microscope.
FIGURE 2
FIGURE 2
Spc105 affects colony growth and spore germination of A. flavus. (A) Colony growth of spc105 mutants on PDA plates after 5 days incubation. (B) Colony diameter measurement of each strain. (C) Examination of spore germination in PDB culture. (D) Comparison of germination rate of each strain.
FIGURE 3
FIGURE 3
Spc105 regulates conidia development and sclerotia formation in A. flavus. (A) Conidia development of each strain cultured at 30°C. a, microscopic observation of conidiophore formation after 24 h incubation on PDA plates. b, examination of conidial head structure under a stereomicroscope after 48 h incubation on PDA plates. Bars represent 200 μm. c, microscopic examination of conidiophore formation after 48 h incubation in submerged PDB culture. Arrows indicate the degenerate conidiophores. (B) Quantitative analysis of conidial production on PDA plates. (C) Statistic analysis of sclerotia production. (D) Relative gene expressions of brlA, abaA, and wetA. Strains were cultured in PDB and gene expression levels were normalized (2–ΔΔCT analysis) to A. flavus β-actin gene expression levels. (E) Observation of sclerotia formation. Each strain was grown on CZ agar plates for 2 weeks in the dark at 30°C. *P < 0.05; ∗∗P < 0.01; ∗∗∗P < 0.001.
FIGURE 4
FIGURE 4
Involvement of Spc105 in the nuclear division of A. flavus. (A) Graphic image of the counted nuclei, the numbers 1, 2, 3, 4, and ≥5 represent the nuclei number. (B) The mean number of nuclei per germling of each strain. (C) qRT-PCR analysis of meiosis-related gene expression. Strains were incubated for 12 h in 100 ml PDB at 25°C and mycelia samples were collected for RNA extraction. Relative expression ratios were calculated relative to the WT control. Error bars represent the standard deviation based on three replicates. *P < 0.05; ∗∗P < 0.01.
FIGURE 5
FIGURE 5
Spc105 regulates the production of aflatoxin, kojic acid, and cyclopiazonic acid. (A) Time course semi-quantitative thin-layer chromatography (TLC) analyses of aflatoxin B1 (AFB1) production in the PDB culture. Sd represents the AFB1 standard. (B) Determination of kojic acid production in solid medium through the colorimetric method. Strains were incubated on PDA plates for 7 days. Images are representative of four experimental replicates. (C) TLC detection of CPA production in PDB liquid culture of each strain. Sd represents the CPA standard.
FIGURE 6
FIGURE 6
Growth and aflatoxin production of WT, Δspc105, and OE:spc105 strains on peanut seeds. (A) Photographs of peanut seeds infected with A. flavus strains after 3 days of incubation at 30°C. (B) Quantification of conidia from the infected peanut seeds by A. flavus strain. ∗∗P < 0.01. (C) TLC analysis of AFB1 levels in infected peanuts.
FIGURE 7
FIGURE 7
Gene expression analysis of AF cluster genes. The heatmap showed gene expression levels in Δspc105 and WT samples. Gene expression is plotted with colors corresponding to the log10 value of the FPKM values of each gene.
FIGURE 8
FIGURE 8
Relationship between Spc105 and LaeA. (A) Phenotypes of spc105/laeA double mutant strains. Upper: Phenotypes of mutant strains after 5 days incubation at 30°C on PDA plates. Middle: Sclerotia production of each strain on CZ plates after 2 weeks incubation in the dark. Bottom: Peanut infection of each strain after 3 days incubation at 30°C. (B) TLC analyses of AFB1 production of each strain and gene expression analysis of AF cluster genes in the PDB culture after 48 h incubation at 30°C. (C) Effect of laeA deletion and overexpression on spc105 gene expression. Mycelia were harvested from PDB culture at the indicated time point. Error bars represent the standard deviations based on three replicates. *P < 0.05; ∗∗P < 0.01.
FIGURE 9
FIGURE 9
Spc105 interacts with LaeA in the Y2H and GST pull-down assays. (A) Y2H assays to determine protein–protein interactions. Yeast cells were grown in liquid selective medium overnight and diluted serially. Four microliters of serially diluted yeast cells were spotted on selective synthetic dropout media SD/-Leu/-Trp/-His/-Ade/ + X-α-gal and incubated at 30°C for 3–5 days. The SD/-Leu/-Trp plate is non-selective and served as the loading control. (B) GST pull-down assay of the interaction between Spc105 and LaeA in vitro. Recombinant GST and GST-Spc105 were incubated with recombinant His6-LaeA and subsequently purified by glutathione magnetic beads. Note that we tried to but failed to express the full length of recombinant GST-Spc105, and here is the truncated version (800 aa-1541 aa) of Spc105. Immunoblot analysis was performed to detect the presence of His6-LaeA using an anti-His-tag antibody. (C) Co-IP of LaeA:HA and 3xFLAG:Spc105. Affinity purification assays from Flag-tagged Spc 105 strain in the background of HA-tagged LaeA were performed with Flag-Trap magnetic beads. The coimmunoprecipitated proteins were analyzed by the anti-HA antibody.
FIGURE 10
FIGURE 10
Interaction domain mapping of Spc105 and LaeA. (A) Six truncation mutants of Spc105 were constructed and tested against full length LaeA in the yeast-two-hybrid assay. (B) Five different truncations of LaeA were tested as interaction partners with full-length Spc105 and VeA.

References

    1. Abbas H. K., Accinelli C., Thomas Shier W. (2017). Biological control of aflatoxin contamination in U.S. crops and the use of bioplastic formulations of Aspergillus Flavus biocontrol strains to optimize application Strategies. J. Agric. Food Chem. 65 7081–7087. 10.1021/acs.jafc.7b01452 - DOI - PubMed
    1. Ahn C. S., Oh Y. T., Kim J. G., Han K. H., Lee C. W., Kim J. W. (2014). The observation of plcA mutation and localization in Aspergillus nidulans. J. Microbiol. 52 590–596. 10.1007/s12275-014-3651-x - DOI - PubMed
    1. Akhund S., Akram A., Hanif N. Q., Qureshi R., Naz F., Nayyar B. G. (2017). Pre-harvest aflatoxins and Aspergillus flavus contamination in variable germplasms of red chillies from Kunri, Pakistan. Mycotoxin Res. 33 147–155. 10.1007/s12550-017-0274-1 - DOI - PubMed
    1. Amaike S., Affeldt K. J., Yin W. B., Franke S., Choithani A., Keller N. P. (2013). The bZIP protein MeaB mediates virulence attributes in Aspergillus flavus. PLoS One. 8:e74030. 10.1371/journal.pone.0074030 - DOI - PMC - PubMed
    1. Amaike S., Keller N. P. (2009). Distinct roles for VeA and LaeA in development and pathogenesis of Aspergillus flavus. Eukaryot. Cell 8 1051–1060. 10.1128/EC.00088-9 - DOI - PMC - PubMed

LinkOut - more resources