. 2019 Aug 7;5(8):eaau9413.
doi: 10.1126/sciadv.aau9413. eCollection 2019 Aug.

Forty years of reform and opening up: China's progress toward a sustainable path

Affiliations

Forty years of reform and opening up: China's progress toward a sustainable path

Yonglong Lu et al. Sci Adv. .

Abstract

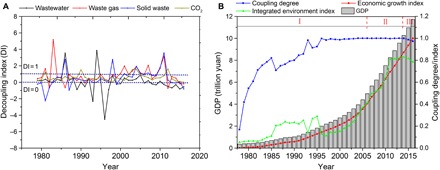
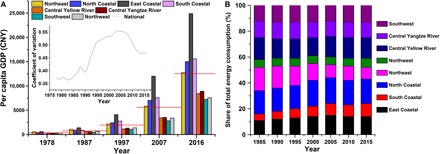
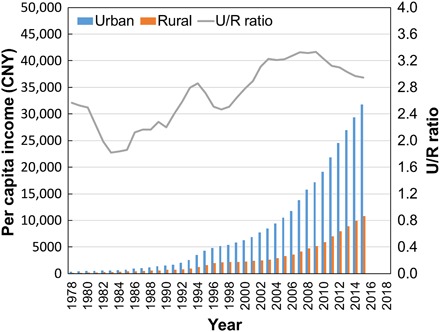
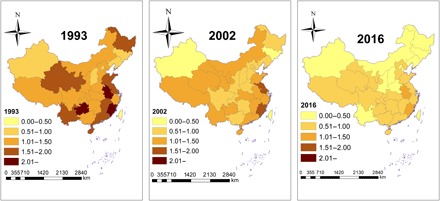
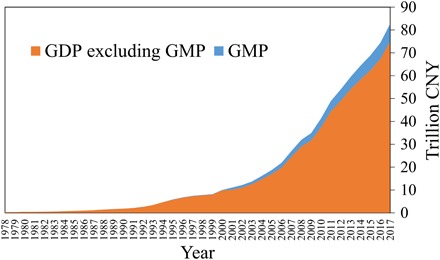
After 40 years of reform and "opening up," China has made remarkable economic progress. Such economic prosperity, however, has been coupled with environmental degradation. We analyze diverse long-term data to determine whether China is experiencing a decoupling of economic growth and environmental impacts, and where China stands with respect to the Sustainable Development Goals (SDGs) in terms of reducing regional division, urban-rural gap, social inequality, and land-based impacts on oceans. The results highlight that China's desire to achieve "ecological civilization" has resulted in a decoupling trend for major pollutants since 2015, while strong coupling remains with CO2 emissions. Progress has been made in health care provision, poverty reduction, and gender equity in education, while income disparity continues between regions and with rural-urban populations. There is a considerable way to go toward achieving delivery of the SDGs; however, China's progress toward economic prosperity and concomitant sustainability provides important insights for other countries.


Figures

Fig. 1
Fig. 1. Transformation from coupling to decoupling.
(A) DI of wastewater, waste gas, solid waste, and CO2 emission to GDP growth. (B) Variations of coupling degree between economy and environment. When DI ≥ 1, the rate of pollutant emissions keeps pace with or is higher than economic growth. When DI = 1, it represents the fulcrum point between absolute coupling and relative decoupling. When 0 < DI < 1, the rate of growth in pollutant emissions is less than that of economic growth. When DI = 0, the economy is growing, while pollutant emission remains constant. When pollutant emission decreases while the economy keeps growing, then DI < 0. Coupling degree calculation is described in the Supplementary Materials. I represents the ascending stage of coupling, II represents a stable stage of coupling, and III represents a descending stage of coupling. Data sources: China Statistical Yearbook (1979–2017) and China Statistical Compendium 1949–2014 (http://www.stats.gov.cn/english/).
Fig. 2
Fig. 2. Regional divide in per capita GDP and energy consumption.
Regional divide in (A) per capita GDP and (B) percentile energy consumption of eight economic regions. The regional divide in GDP grew sharply between 1990 and 2005. It then decreased until recently when it began an upward trend. The contribution to total energy consumption of south and east coastal regions increased, while that of the northeast region, the old industrial zone of China, decreased from 1985 to 2015. Data sources: China Statistical Yearbook (1979–2017) and China Statistical Compendium 1949–2014 (http://www.stats.gov.cn/english/). Higher coefficient of variation indicates larger differences between regions.
Fig. 3
Fig. 3. Rural-urban gap of per capita income in China from 1978 to 2015.
The income of both urban and rural residents has increased more than 10-fold since the 1990s, while the income gap has also increased. The U/R ratio for per capita income has hovered around three since 2003. The U/R ratio is defined as urban income divided by rural income to reflect the income gap. Data sources: China Compendium of Statistics 1949–2014 and China Statistical Yearbook 2017 (http://www.stats.gov.cn/english/).
Fig. 4
Fig. 4. Social inequality: Gap of the mean years of schooling between males and females in different provinces (unit: year).
During the past decades, the gender gap of the mean years of schooling in different provinces decreased significantly. The gender gaps of the mean years of schooling were less than 1 year for most of the provinces in 2016. Note that the data were derived from China Population and Employment Statistics Yearbook (1994–2017).
Fig. 5
Fig. 5. Toward integrated land-ocean development: Contribution of GMP to the GDP, 1978–2017.
Marine resources remain underexploited in the context of economic growth. Note that for 1986–1992, the marine economy was defined as the output value of major marine industries. Data sources: China Marine Statistical Yearbook 1993, 1997–2016; Statistical Communique of Chinese Marine Economy 2017; and China Statistical Yearbook 1979–2017 (http://www.stats.gov.cn/english/).

References

    1. United Nations General Assembly, United Nations Resolution A/RES/70/1 (United Nations General Assembly, 2015).
    1. Pan J., From industrial toward ecological in China. Science 336, 1397–1397 (2012). - PubMed
    1. Hatfield-Dodds S., Schandl H., Adams P. D., Baynes T. M., Brinsmead T. S., Bryan B. A., Chiew F. H. S., Graham P. W., Grundy M., Harwood T., McCallum R., McCrea R., McKellar L. E., Newth D., Nolan M., Prosser I., Wonhas A., Australia is ‘free to choose’ economic growth and falling environmental pressures. Nature 527, 49–53 (2015). - PubMed
    1. Cash D. W., Clark W. C., Alcock F., Dickson N. M., Eckley N., Guston D. H., Jäger J., Mitchell R. B., Knowledge systems for sustainable development. Proc. Natl. Acad. Sci. U.S.A. 100, 8086–8091 (2003). - PMC - PubMed
    1. Ward J. D., Sutton P. C., Werner A. D., Costanza R., Mohr S. H., Simmons C. T., Is decoupling GDP growth from environmental impact possible? PLOS ONE 11, e0164733 (2016). - PMC - PubMed

LinkOut - more resources