. 2019 Aug 7;5(8):eaaw0706.
doi: 10.1126/sciadv.aaw0706. eCollection 2019 Aug.

Bcl11b prevents catastrophic autoimmunity by controlling multiple aspects of a regulatory T cell gene expression program

Affiliations

Bcl11b prevents catastrophic autoimmunity by controlling multiple aspects of a regulatory T cell gene expression program

Syed Nurul Hasan et al. Sci Adv. .

Abstract

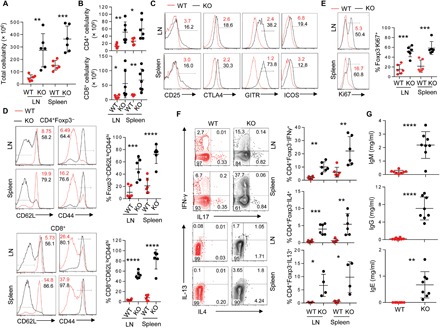
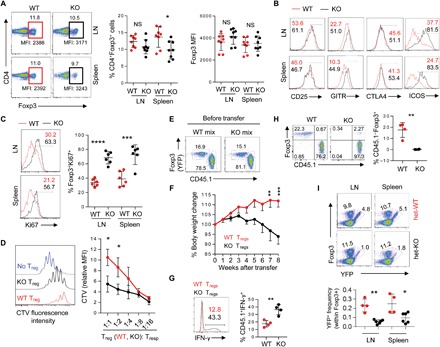
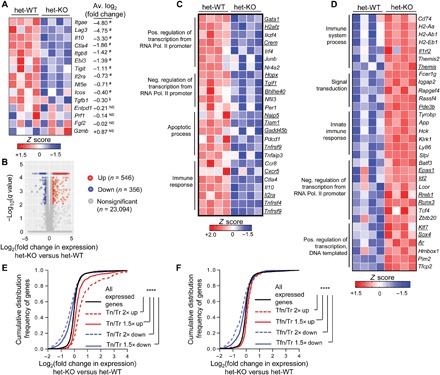
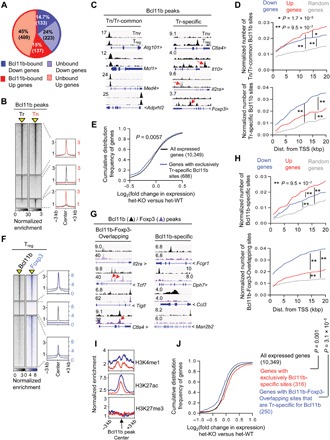
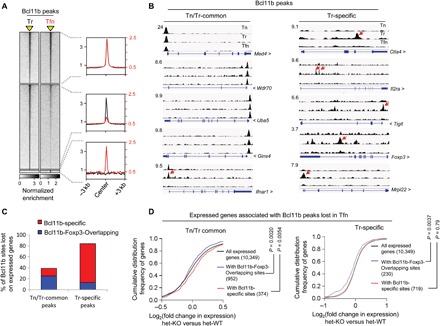
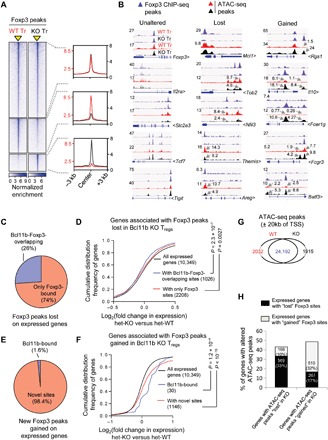
Foxp3 and its protein partners establish a regulatory T (Treg) cell transcription profile and promote immunological tolerance. However, molecular features contributing to a Treg-specific gene expression program are still incompletely understood. We find that the transcription factor Bcl11b is a prominent Foxp3 cofactor with multifaceted functions in Treg biology. Optimal genomic recruitment of Foxp3 and Bcl11b is critically interdependent. Genome-wide occupancy studies coupled with gene expression profiling reveal that Bcl11b, in association with Foxp3, is primarily responsible in establishing a Treg-specific gene activation program. Furthermore, Bcl11b restricts misdirected recruitment of Foxp3 to sites, which would otherwise result in an altered Treg transcriptome profile. Consequently, Treg-specific ablation of Bcl11b results in marked breakdown of immune tolerance, leading to aggressive systemic autoimmunity. Our study provides previously underappreciated mechanistic insights into molecular events contributing to basic aspects of Treg function. Furthermore, it establishes a therapeutic target with potential implications in autoimmunity and cancer.


Figures

Fig. 1
Fig. 1. Marked immune dysregulation in Bcl11bf/fFoxp3IRES-YFP-cre mice.
(A and B) Total (A) and CD4+ and CD8+ T cell compartment cellularity (B) within indicated secondary lymphoid organs in 3- to 5-week-old Bcl11bf/fFoxp3IRES-YFP-cre (KO) or littermate Bcl11b+/+Foxp3IRES-YFP-Cre (WT) mice. (C) Representative fluorescence-activated cell sorting (FACS) plots showing the expressions of indicated activation markers on CD4+Foxp3 cells in WT and KO mice. Statistical quantification is summarized in fig. S2A. (D to F) Representative FACS plots and quantification of CD4+ and CD8+ effector memory CD44hiCD62Llo T cells (D), Ki67+ proliferating CD4+ T cells (E), and cytokine-producing CD4+ T cells (F) within indicated lymphoid organs of WT and KO mice. (G) Concentrations of IgM, IgG, and IgE in serum of 3- to 5-week-old WT or KO mice, determined by enzyme-linked immunosorbent (ELISA) assay. Data are representative of six to eight mice from two to three independent experiments. *P < 0.05, **P < 0.01, ***P < 0.001, and ****P < 0.0001(Student’s t test; error bars denote SD).
Fig. 2
Fig. 2. Phenotypic analyses of Bcl11b-deficient Treg cells.
(A) Representative FACS plot (left), quantification of percentage CD4+Foxp3+ Treg cells (middle), and mean fluorescence intensity (MFI) of Foxp3 (right) from cells isolated from 3- to 5-week-old WT or KO mice. (B) Representative FACS plots showing the expressions of indicated activation markers on Treg cells in WT and KO mice. Statistical quantification is summarized in fig. S2C. (C) Representative FACS plots and quantification of Ki67+ proliferating CD4+Foxp3+ Treg cells isolated from indicated lymphoid organs. (D) In vitro suppression assay, illustrating suppression of T responder (Tresp) cell proliferation by Treg cells sorted from WT or KO mice. Histogram represents CTV dilution of labeled sorted Tnv cells alone (no Treg) or cocultured sorted WT- or KO-derived Treg cell populations at 1:2 Treg/Tresp ratio (left). Cumulative data expressed as CTV MFI of responder CD4+ cells for all the indicated Treg/Tresp coculture ratios normalized against CTV MFI of responder cells cultured alone are shown on the right. Data represent two to three independent experiments. *P < 0.05 (Student’s t test; error bars denote SD). (E) FACS plots representing mix of sorted YFP+ Treg cells from WT or KO mice, along with colitogenic Ly5.1+CD45RBhi T cells that were transferred in recipient RAG1−/− host mice, which were eventually monitored for weight loss, indicative of in vivo suppressive capacity of cotransferred Treg cell populations. (F) Percentage body weight change over time of RAG1−/− mice that were cotransferred with Ly5.1+CD45RBhi T cells along with WT- or KO-derived Treg cells. Data are representative of two independent experiments (n = 6 in each group). Mean ± SEM.**P < 0.01 and ***P < 0.001 [two way analysis of variance (ANOVA), Bonferroni posttest]. (G) Intracellular staining for IFN-γ in lymph nodes of representative recipient mice with WT or KO Treg cells that were viable at the end of the experiment. (H) FACS plots (left) and summary (right) of percentage of Treg cells remaining in the lymph nodes of representative recipient mice at the end of the experiment. (I) Analyses of Bcl11b-sufficient and Bcl11b-deficient Treg cells in heterozygous female Bcl11b+/+Foxp3IRES-YFP-Cre/+ (het-WT) and Bcl11bf/fFoxp3IRES-YFP-Cre/+ (het-KO) mice, in which half of the Treg compartment expresses YFP-cre. *P < 0.05, **P < 0.01, ***P < 0.001, and ****P < 0.001; NS, not significant (Student’s t test; error bars denote SD).
Fig. 3
Fig. 3. Treg genetic signature is critically dependent on the presence of Bcl11b.
RNA-seq analysis was performed on YFP-Cre+ Treg cells sorted from het-WT or het-KO mice. (A) Expression of candidate Treg signature genes implicated in suppressive function. Each box represents one of four replicates per group. #P < 10−3 and $P < 10−2. P values are for het-KO versus het-WT Treg cells as determined by differential gene expression (DGE) analysis. (B) DGE analysis comparing combined gene expression in YFP-Cre+ Treg cells from het-KO versus het-WT. Up and Down signify genes whose expressions are 1.5-fold up-regulated or down-regulated, respectively. (C and D) Heatmaps of selective Down (C) or Up (D) genes that also represent bonafide Treg signature genes, clustered according to Gene Ontology analysis. The respective terms for each cluster under the “biological process” category are indicated on the left. Underlined genes represent Foxp3-dependent ones, whose expressions are more than 1.5-fold altered between wild-type (WT) Treg versus GFP+ Foxp3-null (Tfn) cells derived from heterozygous Foxp3GFPKO/WT females. (E and F) Cumulative distribution function (CDF) analyses of gene expression changes between Bcl11b-deficient versus Bcl11b-sufficient Treg cells for gene subsets 1.5 or 2-fold up- or down-regulated in Treg cells compared to T naïve (E) or Tfn (F). ****P < 10−16 (two-tailed Kolmogorov-Smirnov test).
Fig. 4
Fig. 4. Large overlap between Bcl11b- and Foxp3-occupied sites in Treg cells.
ChIP-seq was performed for Bcl11b on sorted CD4+Foxp3+ Treg (Tr) and CD4+Foxp3CD62lhi T naïve (Tn) cells. (A) Overview of the percentage of Bcl11b-dependent Up or Down genes bound by Bcl11b within ±20 kb of their transcription start sites (TSSs). (B) Genome-wide occupancy of Bcl11b in Tr and Tn cells. Each column depicts Bcl11b binding in Tr or Tn cells within a window ±3 kb centered around Bcl11b-bound sites (indicated as a yellow triangle). Normalized enrichments of indicated Bcl11b-bound peak sets are shown on the right as histogram plots. (C) Representative tracks, as viewed in Integrative Genome Viewer (IGV), of Bcl11b ChIP-seq reads aligned to the corresponding gene loci. Y scale is normalized tag intensity (reads per million mapped reads). Red arrows point toward peaks in each category that are otherwise not obvious. (D) Plots depicting enrichment of Tn/Tr-common (top) or Tr-specific (bottom) sites within a given distance to promoter of randomly selected genes, or genes that are down-regulated or up-regulated in Bcl11b-deficient Treg cells. Wilcoxon rank-sum test P values are shown. (E) CDF analysis of gene expression changes between Bcl11b-deficient versus Bcl11b-sufficient Treg cells for gene subsets that “exclusively” contain Tr-specific Bcl11b-specific sites. Of note, there was a subcategory of genes prebound by Bcl11b in Tn and gained new Bcl11b peaks at different site(s) in Tr. While these genes are also categorized as Tr-specific site–containing genes, they are not included in this analysis. Two-tailed Kolmogorov-Smirnov test P value is shown. (F) Genome-wide occupancy of Bcl11b and Foxp3 in Treg cells. Each column depicts Bcl11b or Foxp3 binding within a window ±3 kb centered on peaks identified by ChIP-seq analyses (indicated as a yellow triangle). Normalized enrichments of indicated Bcl11b- and Foxp3-bound peak sets are shown on the right as histogram plots. (G) Examples of Bcl11b- and Foxp3-bound peaks representing common sites (Bcl11b-Foxp3-Overlapping) or sites where Bcl11b binds in the absence of Foxp3 (Bcl11b-specific). (H) Plots depicting enrichment of Bcl11b-specific (top) or Bcl11b-Foxp3-Overlapping (bottom) sites within a given distance to promoter of randomly selected genes, or genes that are down-regulated or up-regulated in Treg cells in the absence of Bcl11b. (I) Normalized enrichment of indicated chromatin marks around Bcl11b binding sites within ±20 kb of TSS for the gene subsets analyzed. The blue line represents genes with Bcl11b-Foxp3-Overlapping sites that are Tr-specific for Bcl11b. The red line represents genes that are only bound by Bcl11b in Treg cells. (J) CDF analysis of gene expression changes between Bcl11b-deficient versus Bcl11b-sufficient Treg cells for indicated gene subsets. Genes that are bound by both Bcl11b and Foxp3, but at two different sites (nonoverlapping), are excluded from this analysis. Two-tailed Kolmogorov-Smirnov test P values are shown.
Fig. 5
Fig. 5. Foxp3 promotes functional recruitment of Bcl11b in Treg cells.
(A) Genome-wide occupancy of Bcl11b in WT Treg (Tr) and Tfn cells derived from Foxp3GFPKO mice. Bcl11b binding within a window ±3 kb centered on peaks identified by ChIP-seq analyses (indicated as a yellow triangle). Normalized enrichments of indicated Bcl11b peak sets are shown on the right as histogram plots. (B) Examples of Bcl11b peaks in Tn, Tr, and Tfn cells as viewed in IGV, representing the indicated categories. Red arrows indicate peaks that are significantly reduced in Tfn cells compared to Tr. (C) Graphical representation summarizing the subcategories to which the Bcl11b peaks lost in Tfn cells belong. (D) CDF analysis of gene expression changes between Bcl11b-deficient versus Bcl11b-sufficient Treg cells for indicated gene subsets. Two-tailed Kolmogorov-Smirnov test P values are shown.
Fig. 6
Fig. 6. Bcl11b promotes intensity and assures fidelity of Foxp3-bound sites in Tregcells.
(A) Genome-wide binding intensity of Foxp3 in WT and Bcl11b-deficient (KO) Treg cells. Foxp3 binding within a window ±3 kb centered on peaks identified by ChIP-seq analyses (indicated as a yellow triangle). Normalized enrichments of indicated Foxp3-bound peak sets are shown on the right as histogram plots. (B) IGV tracks of Foxp3-bound peaks and corresponding ATAC-seq peaks of the indicated categories in WT- and KO-derived Treg cells. (C and E) Graphical summary demonstrating Bcl11b or Foxp3 binding preference in WT Treg cells, for genes harboring Foxp3 peaks lost (C) or gained (E) in KO. (D and F) CDF analysis summarizing gene expression changes between Bcl11b-deficient and Bcl11b-sufficient Treg cells for indicated gene subsets categorized in (C) and (E), respectively. Two-tailed Kolmogorov-Smirnov test P values are shown. (G) Summary of ATAC-seq peaks in WT and KO Treg cells. (H) Graphical representation summarizing the subcategories to which the ATAC-seq peaks lost or gained in Bcl11b-deficient Treg cells belong.

References

    1. Ramsdell F., Ziegler S. F., FOXP3 and scurfy: How it all began. Nat. Rev. Immunol. 14, 343–349 (2014). - PubMed
    1. Rudra D., deRoos P., Chaudhry A., Niec R. E., Arvey A., Samstein R. M., Leslie C., Shaffer S. A., Goodlett D. R., Rudensky A. Y., Transcription factor Foxp3 and its protein partners form a complex regulatory network. Nat. Immunol. 13, 1010–1019 (2012). - PMC - PubMed
    1. Di Santo J. P., Immunology. A guardian of T cell fate. Science 329, 44–45 (2010). - PubMed
    1. Albu D. I., Feng D., Bhattacharya D., Jenkins N. A., Copeland N. G., Liu P., Avram D., BCL11B is required for positive selection and survival of double-positive thymocytes. J. Exp. Med. 204, 3003–3015 (2007). - PMC - PubMed
    1. Califano D., Sweeney K. J., Le H., VanValkenburgh J., Yager E., O’Connor W. Jr., Kennedy J. S., Jones D. M., Avram D., Diverting T helper cell trafficking through increased plasticity attenuates autoimmune encephalomyelitis. J. Clin. Invest. 124, 174–187 (2014). - PMC - PubMed

Publication types

MeSH terms