. 2016 Oct 25;1(4):669-679.
doi: 10.1021/acsomega.6b00223. eCollection 2016 Oct 31.

Molecular Mechanism for the Hofmeister Effect Derived from NMR and DSC Measurements on Barnase

Affiliations

Molecular Mechanism for the Hofmeister Effect Derived from NMR and DSC Measurements on Barnase

Jordan W Bye et al. ACS Omega. .

Abstract

The effects of sodium thiocyanate, sodium chloride, and sodium sulfate on the ribonuclease barnase were studied using differential scanning calorimetry (DSC) and NMR. Both measurements reveal specific and saturable binding at low anion concentrations (up to 250 mM), which produces localized conformational and energetic effects that are unrelated to the Hofmeister series. The binding of sulfate slows intramolecular motions, as revealed by peak broadening in 13C heteronuclear single quantum coherence spectroscopy. None of the anions shows significant binding to hydrophobic groups. Above 250 mM, the DSC results are consistent with the expected Hofmeister effects in that the chaotropic anion thiocyanate destabilizes barnase. In this higher concentration range, the anions have approximately linear effects on protein NMR chemical shifts, with no evidence for direct interaction of the anions with the protein surface. We conclude that the effects of the anions on barnase are mediated by solvent interactions. The results are not consistent with the predictions of the preferential interaction, preferential hydration, and excluded volume models commonly used to describe Hofmeister effects. Instead, they suggest that the Hofmeister anion effects on both stability and solubility of barnase are due to the way in which the protein interacts with water molecules, and in particular with water dipoles, which are more ordered around sulfate anions and less ordered around thiocyanate anions.


Conflict of interest statement

The authors declare no competing financial interest.

Figures

Scheme 1
Scheme 1. Hofmeister Series
Figure 1
Figure 1
Change in melting temperature (Tm) of 0.5 mg/mL barnase in the presence of increasing sodium thiocyanate (NaSCN) concentration in ultrapure water at pH 6.5. Error bars are standard deviation (n = 2). Where no error bars are visible, they are contained within the data points.
Figure 2
Figure 2
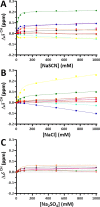
Chemical shift changes for backbone amide protons acquired from 1H,15N HSQC spectra in the presence of (A) NaSCN (●), (B) NaCl (■), or (C) Na2SO4 (▲). Symbols represent experimental data, and lines were generated from fitting to eq 1; Y24 (aqua), A30 (orange), A32 (brown), L42 (black), A43 (yellow), I51 (green), R83 (red), D86 (blue), K98 (pink), and T100 (purple).
Figure 3
Figure 3
Expansions of a region in the 1H,15N HSQC spectrum of barnase in the presence of increasing concentrations of (A) NaSCN, (B) NaCl, and (C) Na2SO4. Concentrations: 0 (black), 10 (red), 25 (blue), 50 (green), 100 (black), 250 (red), 500 (blue), 750 (green), and 1000 mM (black).
Figure 4
Figure 4
(A) Locations of solvent-exposed backbone amide protons (i.e., protons with a surface-accessible surface area >0 Å2) and the positions of amide protons exhibiting a nonlinear relationship between chemical shift and (B) NaSCN, (C) NaCl, and (D) Na2SO4 concentration.
Figure 5
Figure 5
Linear gradients for each salt plotted for all amide protons: (A) chloride vs sulfate gradients, (B) thiocyanate vs sulfate gradients, (C) thiocyanate vs chloride gradients. Black points represent solvent-inaccessible amide protons, and red points represent solvent-accessible amide proteins as calculated by the naccess software. In (A)–(C), Pearson correlation coefficients ρ are 0.26, 0.30, and 0.57 for buried amide protons, and 0.45, 0.08, and 0.43 for solvent-exposed amide protons. In the majority of cases, these translate into statistically significant correlations using the Fisher transformation.
Figure 6
Figure 6
Expansions of a region in the HNCO spectrum of barnase in the presence of increasing concentrations of (A) NaSCN, (B) NaCl, and (C) Na2SO4 (colors as in Figure 3).
Figure 7
Figure 7
Chemical shift changes for backbone carbonyl carbons in the presence of (A) NaSCN (●), (B) NaCl (■), and (C) Na2SO4 (▲). Symbols represent experimental data, and lines were generated from fitting to eq 1; I25 (aqua), Q31 (orange), L33 (brown), A43 (black), D44 (yellow), G52 (green), N84 (red), R87 (blue), T99 (pink), and D101 (purple).
Figure 8
Figure 8
(A) Locations of solvent-exposed backbone carbonyl oxygens (i.e., oxygens with a surface-accessible surface area >5 Å2), and the position of carbonyl carbons exhibiting a nonlinear relationship between chemical shift and (B) NaSCN, (C) NaCl, and (D) Na2SO4 concentration.
Figure 9
Figure 9
Chemical shift changes for carbon-bound protons acquired from 1H,13C HSQC spectra in the presence of (A) NaSCN (●), (B) NaCl (■), and (C) Na2SO4 (▲). Symbols represent experimental data, and lines were generated from fitting to eq 1; K19 Hε2 (red), A37 Hα (yellow), A37 Hβ (green), L42 Hβ1 (blue), I51 Hγ12 (orange), E60 Hα (purple), L63 Hγ (pink), R83 Hβ2 (brown), K98 Hβ1 (aqua), and K108 Hδ1 (black).
Figure 10
Figure 10
Relative change in protein melting temperature vs Gibbs free energy of ion hydration for lysozyme (●), protein L (■), protein L K28Q (▲), and ribonuclease A (◆) upon addition of 1000 mM phosphate (green), sulfate (blue), fluoride (yellow), chloride (red), nitrate (black), bromide (brown), iodide (orange), perchlorate (aqua), and thiocyanate (purple). In all cases, the counterion was sodium.

References

    1. Cox W. M.; Wolfenden J. H. Proc. R. Soc. London, Ser. A 1934, 145, 475–488. 10.1098/rspa.1934.0113. - DOI
    2. Tielrooij K. J.; Garcia-Araez N.; Bonn M.; Bakker H. J. Science 2010, 328, 1006–1009. 10.1126/science.1183512. - DOI - PubMed
    3. dos Santos A. P.; Levin Y. Faraday Discuss. 2013, 160, 75–87. 10.1039/C2FD20067H. - DOI - PubMed
    4. Collins K. D.; Wasabaugh M. W. Q. Rev. Biophys. 1985, 18, 323–422. 10.1017/S0033583500005369. - DOI - PubMed
    5. Marcus Y. Chem. Rev. 2009, 109, 1346–1370. 10.1021/cr8003828. - DOI - PubMed
    6. Jenkins H. D. B.; Marcus Y. Chem. Rev. 1995, 95, 2695–2724. 10.1021/cr00040a004. - DOI
    7. Heydweiller A. Ann. Phys. 1910, 338, 145–185. 10.1002/andp.19103381108. - DOI
    1. Hofmeister F. Arch. Exp. Pathol. Pharmakol. 1888, 25, 1–30. 10.1007/BF01838161. - DOI
    1. Von Hippel P. H.; Wong K. J. Biol. Chem. 1965, 240, 3909–3923. - PubMed
    1. Von Hippel P. H.; Schleich T. Acc. Chem. Res. 1969, 2, 257–265. 10.1021/ar50021a001. - DOI
    1. Zhang Y.; Cremer P. S. Proc. Natl. Acad. Sci. U.S.A. 2009, 106, 15249–15253. 10.1073/pnas.0907616106. - DOI - PMC - PubMed
    2. Ries-Kautt M. M.; Ducruix A. F. J. Biol. Chem. 1989, 264, 745–748. - PubMed
    3. Baldwin R. L. Biophys. J. 1996, 71, 2056–2063. 10.1016/S0006-3495(96)79404-3. - DOI - PMC - PubMed
    4. Curtis R. A.; Prausnitz J. M.; Blanch H. W. Biotechnol. Bioeng. 1997, 57, 11–21. 10.1002/(SICI)1097-0290(19980105)57:1<11::AID-BIT2>3.0.CO;2-Y. - DOI - PubMed
    5. Arakawa T.; Timasheff S. N. Biochemistry 1982, 21, 6545–6552. 10.1021/bi00268a034. - DOI - PubMed
    6. Santoro M. M.; Liu Y.; Khan S. M. A.; Hou L.-X.; Bolen D. W. Biochemistry 1992, 31, 5278–5283. 10.1021/bi00138a006. - DOI - PubMed