

S100B as an Antagonist To Interfere with the Interface Area Flanked by S100A11 and RAGE V Domain
- PMID: 31459098
- PMCID: PMC6644751
- DOI: 10.1021/acsomega.8b00922
S100B as an Antagonist To Interfere with the Interface Area Flanked by S100A11 and RAGE V Domain
Abstract
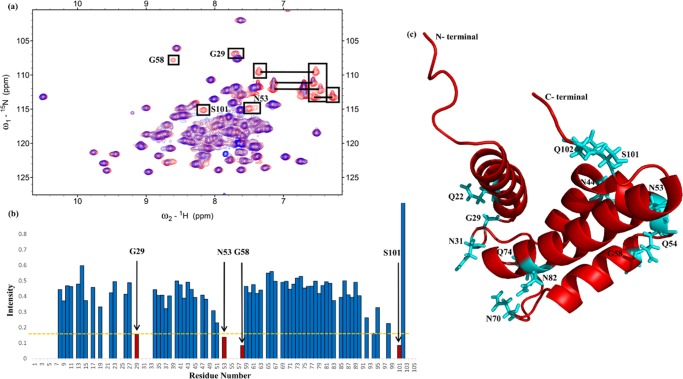
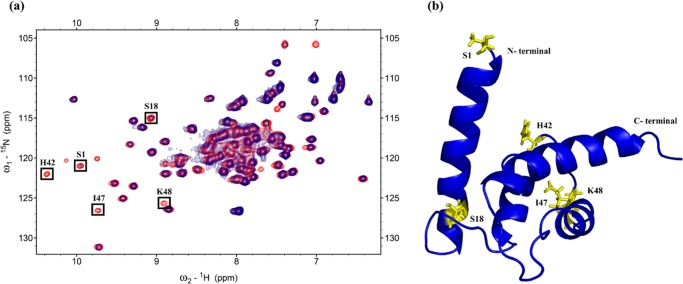
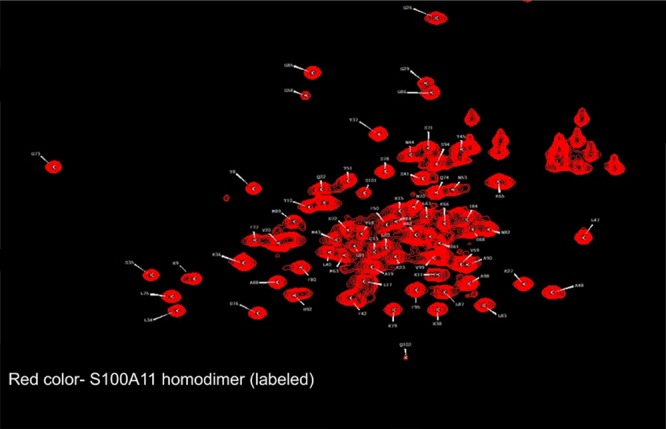
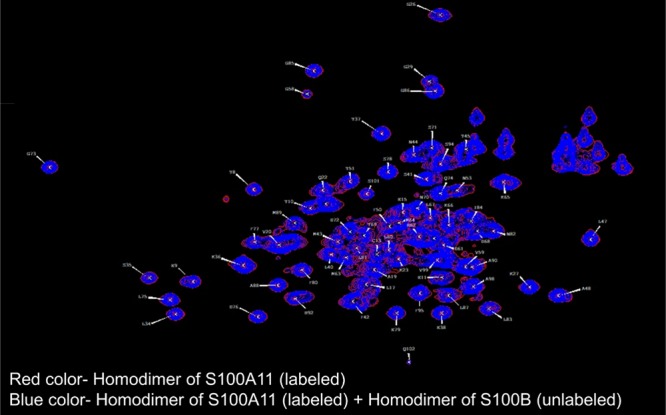
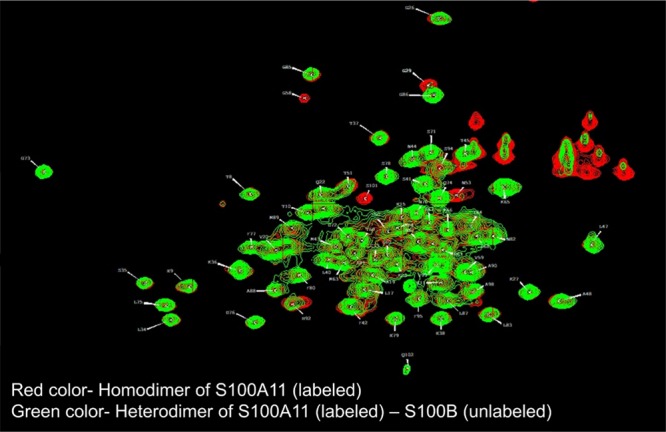
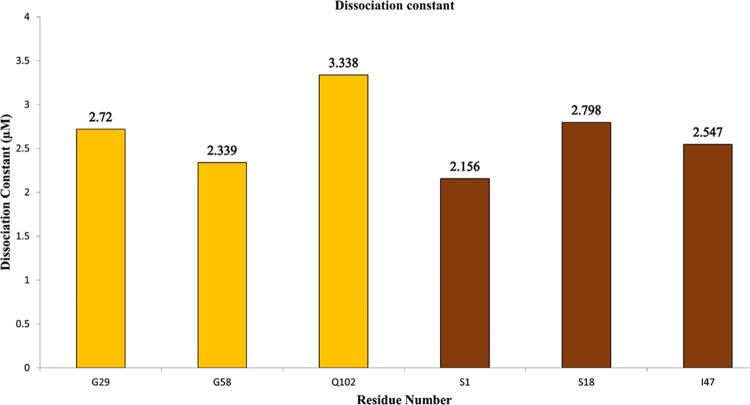
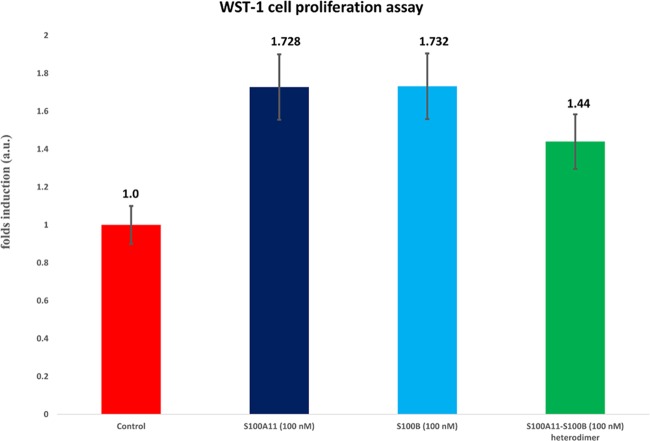
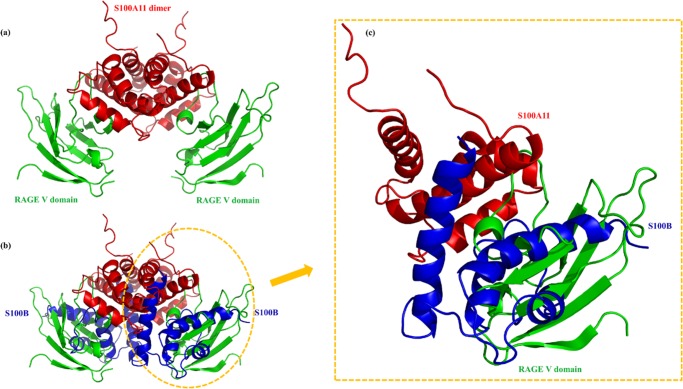
The Ca2+-sensing protein S100A11 of the S100 family is an important mediator of numerous biological functions and pathological conditions including cancer. The receptor for advanced glycation end products (RAGE) has been well accepted as the major receptor for several S100 family members. Here, we take the S100B protein as an antagonist to interfere with the interaction flanked by S100A11 and the RAGE V domain. We employed NMR spectroscopy to describe the interactions between the S100A11 and S100B proteins. 1H-15N heteronuclear single-quantum correlation-NMR titrations showed the potential binding dynamics of S100A11 and S100B interactions. In the HADDOCK program, we constructed the S100A11-S100B heterodimer complex that was then superimposed with the S100A11-S100B complex structure in the same orientation as the S100A11-RAGE V domain complex. This overlay analysis showed that S100B could interfere in the binding section of S100A11 and the RAGE V domain. Additionally, water-soluble tetrazolium-1 assay provided a functional read-out of the effects of these proteins in an in vitro cancer model. Our study establishes that the development of an S100B antagonist could perform a vital part in the treatment of S100- and RAGE-dependent human diseases.
Conflict of interest statement
The authors declare no competing financial interest.
Figures

Similar articles
-
Blocking the interface region amongst S100A6 and RAGE V domain via S100B protein.Biochem Biophys Res Commun. 2020 Dec 10;533(3):332-337. doi: 10.1016/j.bbrc.2020.09.040. Epub 2020 Sep 18. Biochem Biophys Res Commun. 2020. PMID: 32958253
-
Tranilast Blocks the Interaction between the Protein S100A11 and Receptor for Advanced Glycation End Products (RAGE) V Domain and Inhibits Cell Proliferation.J Biol Chem. 2016 Jul 1;291(27):14300-14310. doi: 10.1074/jbc.M116.722215. Epub 2016 May 12. J Biol Chem. 2016. PMID: 27226584 Free PMC article.
-
S100B as an antagonist to block the interaction between S100A1 and the RAGE V domain.PLoS One. 2018 Feb 14;13(2):e0190545. doi: 10.1371/journal.pone.0190545. eCollection 2018. PLoS One. 2018. PMID: 29444082 Free PMC article.
-
RAGE: a single receptor for several ligands and different cellular responses: the case of certain S100 proteins.Curr Mol Med. 2007 Dec;7(8):711-24. doi: 10.2174/156652407783220688. Curr Mol Med. 2007. PMID: 18331229 Review.
-
S100B-stimulated NO production by BV-2 microglia is independent of RAGE transducing activity but dependent on RAGE extracellular domain.Biochim Biophys Acta. 2004 Dec 6;1742(1-3):169-77. doi: 10.1016/j.bbamcr.2004.09.008. Biochim Biophys Acta. 2004. PMID: 15590067 Review.
Cited by
-
Lysozyme as the anti-proliferative agent to block the interaction between S100A6 and the RAGE V domain.PLoS One. 2019 May 9;14(5):e0216427. doi: 10.1371/journal.pone.0216427. eCollection 2019. PLoS One. 2019. PMID: 31071146 Free PMC article.
-
The Calcium Binding Protein S100A11 and Its Roles in Diseases.Front Cell Dev Biol. 2021 Jun 11;9:693262. doi: 10.3389/fcell.2021.693262. eCollection 2021. Front Cell Dev Biol. 2021. PMID: 34179021 Free PMC article. Review.
-
The Anti-Cancer Activity of Pentamidine and Its Derivatives (WLC-4059) Is through Blocking the Interaction between S100A1 and RAGE V Domain.Biomolecules. 2022 Dec 30;13(1):81. doi: 10.3390/biom13010081. Biomolecules. 2022. PMID: 36671465 Free PMC article.
References
-
- Moore B. W.; McGregor D. Chromatographic and electrophoretic fractionation of soluble proteins of brain and liver. J. Biol. Chem. 1965, 240, 53. - PubMed
LinkOut - more resources
Full Text Sources
Miscellaneous
