. 2019 Mar 19;4(3):5442-5450.
doi: 10.1021/acsomega.8b03323. eCollection 2019 Mar 31.

Thermoelectric Figure-of-Merit of Fully Dense Single-Crystalline SnSe

Affiliations

Thermoelectric Figure-of-Merit of Fully Dense Single-Crystalline SnSe

Pai-Chun Wei et al. ACS Omega. .

Abstract

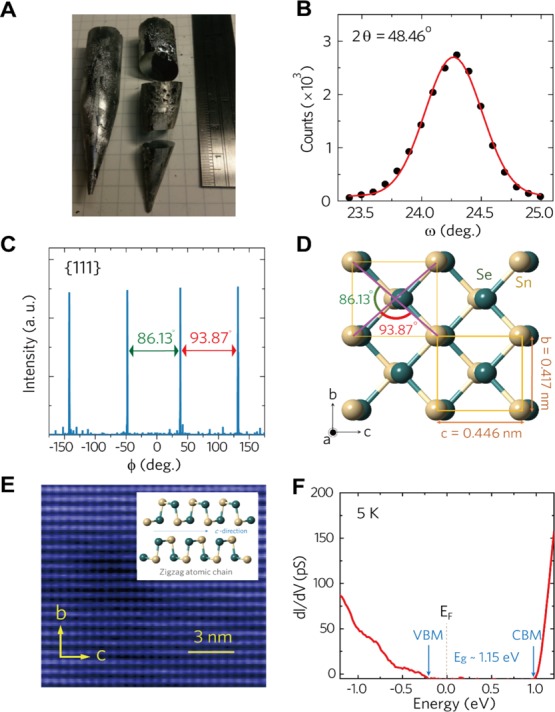
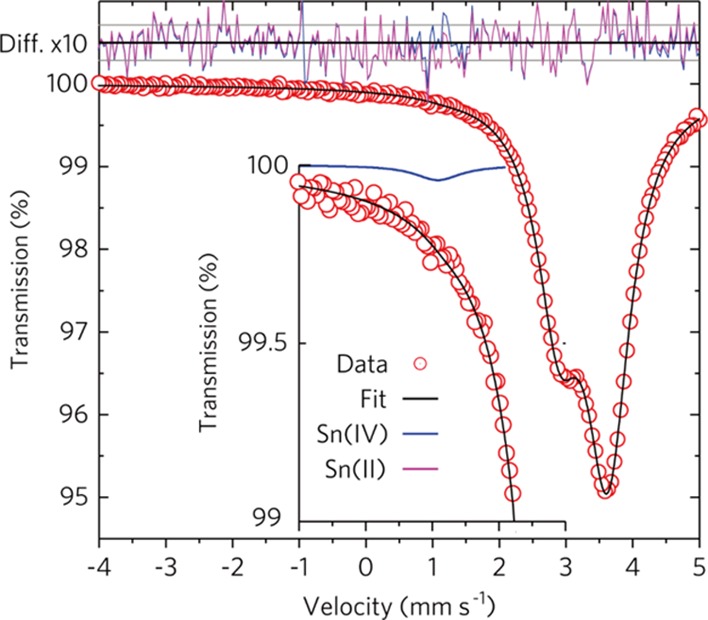
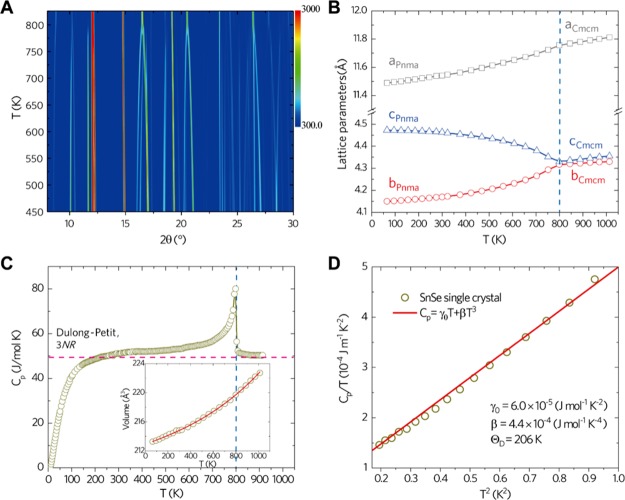
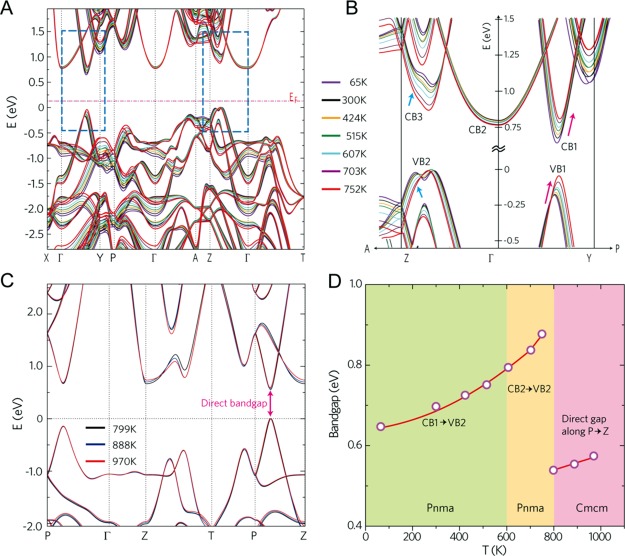
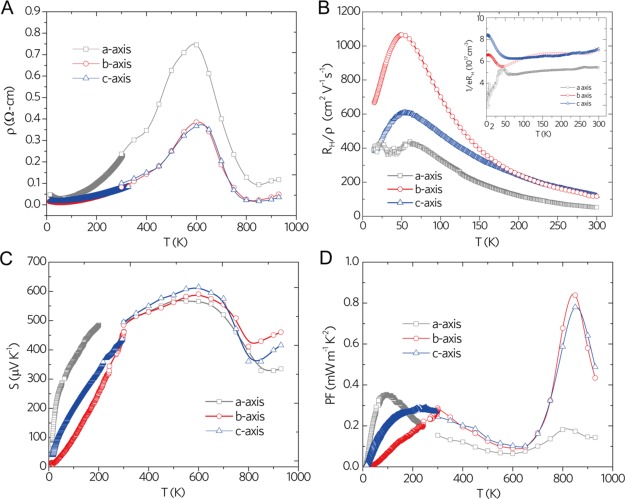
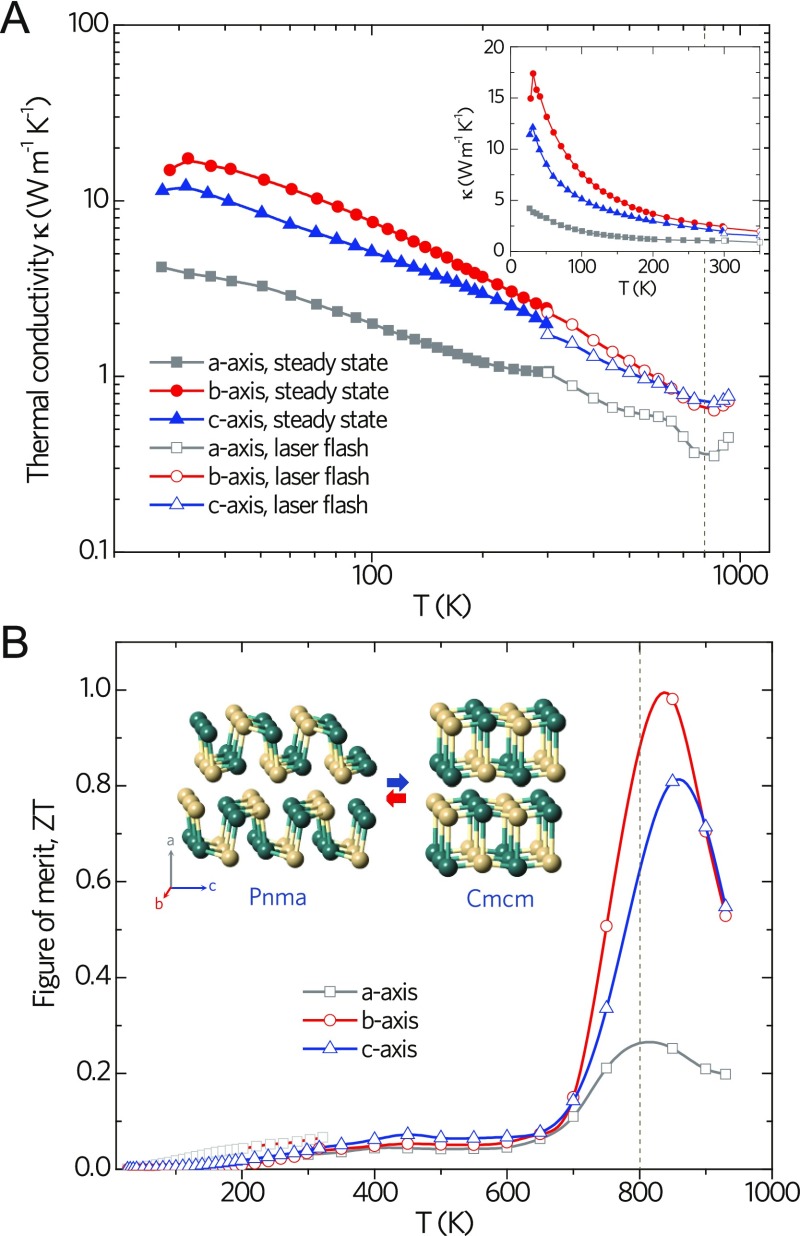
Single-crystalline SnSe has attracted much attention because of its record high figure-of-merit ZT ≈ 2.6; however, this high ZT has been associated with the low mass density of samples which leaves the intrinsic ZT of fully dense pristine SnSe in question. To this end, we prepared high-quality fully dense SnSe single crystals and performed detailed structural, electrical, and thermal transport measurements over a wide temperature range along the major crystallographic directions. Our single crystals were fully dense and of high purity as confirmed via high statistics 119Sn Mössbauer spectroscopy that revealed <0.35 at. % Sn(IV) in pristine SnSe. The temperature-dependent heat capacity (C p) provided evidence for the displacive second-order phase transition from Pnma to Cmcm phase at T c ≈ 800 K and a small but finite Sommerfeld coefficient γ0 which implied the presence of a finite Fermi surface. Interestingly, despite its strongly temperature-dependent band gap inferred from density functional theory calculations, SnSe behaves like a low-carrier-concentration multiband metal below 600 K, above which it exhibits a semiconducting behavior. Notably, our high-quality single-crystalline SnSe exhibits a thermoelectric figure-of-merit ZT ∼1.0, ∼0.8, and ∼0.25 at 850 K along the b, c, and a directions, respectively.


Conflict of interest statement

The authors declare no competing financial interest.

Figures

Figure 1
Figure 1
Structural characterization of fully dense single-crystalline SnSe. (A) Bridgman-grown SnSe crystals with the crystal direction along the (100) face. (B) Neutron rocking curve of single-crystalline SnSe (19 g) measured at room temperature. The fwhm is estimated to be 0.48(1)°, indicating the high crystallinity of our Bridgman-grown SnSe samples. (C) X-ray phi-scan profile of SnSe (111) reflection. (D) Crystal structure of Pnma-SnSe along the a direction. (E) STM topography of SnSe (100) surface obtained at a bias voltage of 1.6 V and 200 pA constant current at 5 K, inset: zigzag chains of Sn–Se atoms. (F) Tunneling spectrum dI/dV obtained at 4.8 K on (100) surface, where VBM and CBM are valence band maximum and the conduction band minimum, respectively. EF and Eg are the Fermi energy and the energy band gap, respectively.
Figure 2
Figure 2
Room-temperature Mössbauer spectra of fully dense SnSe. Top: difference plot for fits with a single SnSe doublet fit (purple) and a fit with an additional Sn(IV) singlet (blue). The scale is magnified by a factor 10. The gray lines represent the ±1σ deviation calculated from the counting statistics. Center: Mössbauer spectral data, red dots, and total fit, black line, for the model with SnSe and a minor Sn(IV) component. Inset: vertically enlarged spectrum and fit components in the −1 to 2 mm/s range. The Sn(IV) minority component displayed in blue amounts to 0.35 at. %. The SnSe doublet is displayed in magenta. Data points for data are scaled to match the error bar.
Figure 3
Figure 3
Temperature-dependent synchrotron XRD patterns and heat capacity data of SnSe. (A) Temperature-dependent XRD patterns showing the peak evolution with temperature. (B) Lattice parameters determined from Rietveld refinement and plotted as a function of temperature along a, b, and c directions. (C) Cp as a function of temperature below and above Tc (vertical blue dashed line). Inset: unit cell volume plotted as a function of temperature. (D) Estimated Debye temperature (ΘD) from the plot of Cp/T vs T2.
Figure 4
Figure 4
Band structure of SnSe using DFT. (A) Below and (C) above the phase transition, (B) expanded view of the VBM and CBM indicated in the dotted squares in (A). (D) Estimated energy band gap above and below the phase transition temperature.
Figure 5
Figure 5
Electronic transport of SnSe. (A) Electrical resistivity (ρ) of SnSe as a function of temperature. (B) Carrier mobility (μ = RH/ρ), and 1/eRH shown in the inset figure as a function of temperature. (C) Seebeck coefficient (S) and (D) TE power factor (PF = S2/ρ) of SnSe as a function of temperature.
Figure 6
Figure 6
Thermal transport and figure-of-merit of SnSe. (A) Total thermal conductivity (κ) plotted on logarithmic and linear (inset figure) scales. The kink at 300 K along the a direction is a remnant of the radiation losses. (B) TE figure-of-merit of SnSe as a function of temperature. The solid and open symbols in the upper panel correspond to measurements using the steady-state and laser flash techniques, respectively.

References

    1. Hicks L. D.; Dresselhaus M. S. Effect of Quantum-Well Structures on the Thermoelectric Figure of Merit. Phys. Rev. B: Condens. Matter Mater. Phys. 1993, 47, 12727–12731. 10.1103/physrevb.47.12727. - DOI - PubMed
    1. Snyder G. J.; Toberer E. S. Complex Thermoelectric Materials. Nat. Mater. 2008, 7, 105–114. 10.1038/nmat2090. - DOI - PubMed
    1. Pei Y.; Shi X.; Lalonde A.; Wang H.; Chen L.; Snyder G. J. Convergence of Electronic Bands for High Performance Bulk Thermoelectrics. Nature 2011, 473, 66–69. 10.1038/nature09996. - DOI - PubMed
    1. Liu Y.; Zhou M.; He J. Towards Higher Thermoelectric Performance of Bi2Te3 via Defect Engineering. Scr. Mater. 2016, 111, 39–43. 10.1016/j.scriptamat.2015.06.031. - DOI
    1. Morelli D. T.; Jovovic V.; Heremans J. P. Intrinsically Minimal Thermal Conductivity in Cubic I-V-VI2 Semiconductors. Phys. Rev. Lett. 2008, 101, 035901.10.1103/physrevlett.101.035901. - DOI - PubMed

LinkOut - more resources