

Temperature-Induced Single-Crystal-to-Single-Crystal Transformations with Consequential Changes in the Magnetic Properties of Fe(III) Complexes
- PMID: 31459962
- PMCID: PMC6648738
- DOI: 10.1021/acsomega.8b03400
Temperature-Induced Single-Crystal-to-Single-Crystal Transformations with Consequential Changes in the Magnetic Properties of Fe(III) Complexes
Erratum in
-
Correction to "Temperature-Induced Single-Crystal-to-Single-Crystal Transformations with Consequential Changes in the Magnetic Properties of Fe(III) Complexes".ACS Omega. 2019 Nov 19;4(23):20423. doi: 10.1021/acsomega.9b03593. eCollection 2019 Dec 3. ACS Omega. 2019. PMID: 31815246 Free PMC article.
Abstract
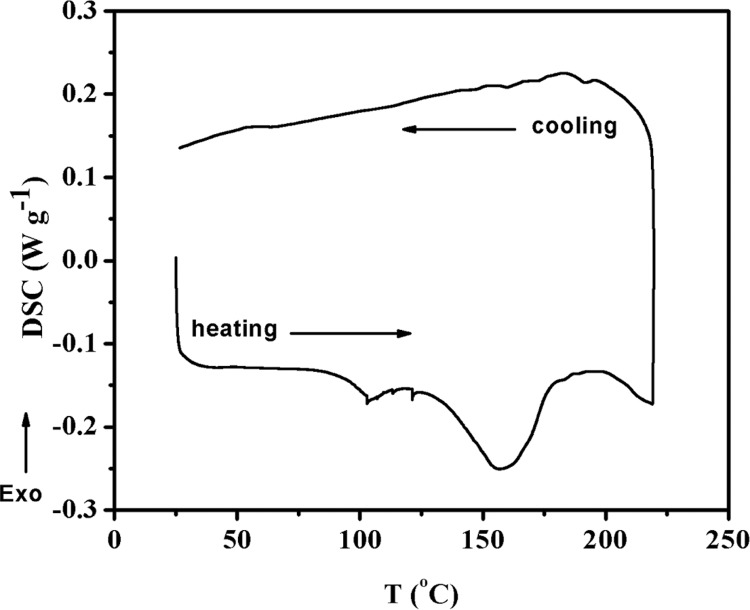
The present article deals with an one-to-one structure-property correspondence of a dinuclear iron complex, [Dipic(H2O)FeOH]2·H2O (1) (Dipic = pyridine-2,6-dicarboxylic acid). Variable-temperature X-ray single-crystal structural analysis confirms a phase transition of complex 1 to complex 2 ([Dipic(H2O)FeOH]2) at 120 °C. Further, single-crystal-to-single-crystal (SCSC) transformation was monitored by temperature-dependent single crystal X-ray diffraction, powder X-ray diffraction, time-dependent Fourier-transform infrared spectroscopy, and differential scanning calorimetry. SCSC transformation brings the change in space group of single crystal. Complex 1 crystallizes in the C2/c space group, whereas complex 2 crystallizes in the Pi̅ space group. SCSC transformation brings the change in packing diagram as well. Complex 1 shows two-dimensional network through H-bonding, whereas the packing diagram of complex 2 shows a zigzag-like arrangement. Phase transformation not only fetches structural changes but also in the magnetic properties. Difference in Fe-O-Fe bond angles of two complexes creates notable variation in their antiferromagnetic interactions with adjacent metal centers.
Conflict of interest statement
The authors declare no competing financial interest.
Figures


Similar articles
-
Thermally triggered solid-state single-crystal-to-single-crystal structural transformation accompanies property changes.Chemistry. 2015 Mar 16;21(12):4703-11. doi: 10.1002/chem.201405984. Epub 2015 Feb 6. Chemistry. 2015. PMID: 25663637
-
Solvent-triggered single-crystal-to-single-crystal transformation from a monomeric to polymeric copper(II) complex based on an aza macrocyclic ligand.Acta Crystallogr B Struct Sci Cryst Eng Mater. 2020 Apr 1;76(Pt 2):225-232. doi: 10.1107/S2052520620002371. Epub 2020 Mar 19. Acta Crystallogr B Struct Sci Cryst Eng Mater. 2020. PMID: 32831224
-
Spectroscopic and magnetic properties of a series of μ-cyano bridged bimetallic compounds of the type M(II)-NC-Fe(III) (M = Mn, Co, and Zn) using the building block [Fe(III)(CN)5imidazole]2-.Inorg Chem. 2010 Nov 15;49(22):10557-70. doi: 10.1021/ic101447q. Epub 2010 Oct 21. Inorg Chem. 2010. PMID: 20964312
-
Accessibility and selective stabilization of the principal spin states of iron by pyridyl versus phenolic ketimines: modulation of the 6A1 ↔ 2T2 ground-state transformation of the [FeN4O2]+ chromophore.Inorg Chem. 2012 Aug 6;51(15):8241-53. doi: 10.1021/ic300732r. Epub 2012 Jul 18. Inorg Chem. 2012. PMID: 22808945
-
Thermal Reactivity in Metal Organic Materials (MOMs): From Single-Crystal-to-Single-Crystal Reactions and Beyond.Materials (Basel). 2019 Dec 7;12(24):4088. doi: 10.3390/ma12244088. Materials (Basel). 2019. PMID: 31817836 Free PMC article. Review.
Cited by
-
Enhanced Catalytic Activity of a Copper(II) Metal-Organic Framework Constructed via Semireversible Single-Crystal-to-Single-Crystal Dehydration.ACS Omega. 2024 Feb 12;9(7):7511-7528. doi: 10.1021/acsomega.3c05999. eCollection 2024 Feb 20. ACS Omega. 2024. PMID: 38405543 Free PMC article.
References
-
- Duriska M. B.; Neville S. M.; Moubaraki B.; Cashion J. D.; Halder G. J.; Chapman K. W.; Balde C.; Létard J.-F.; Murray K. S.; Kepert C. J.; Batten S. R. A Nanoscale Molecular Switch Triggered by Thermal, Light, and Guest Perturbation. Angew. Chem., Int. Ed. 2009, 48, 2549.10.1002/anie.200805178. - DOI - PubMed
-
- Liu J-L.; Wu J-Y.; Huang G-Z.; Chen Y. C.; Jia J-H.; Ungur L.; Chibotaru L. F.; Chen X-M.; Tong M-L. Desolvation-Driven 100-Fold Slowdown of Tunneling Relaxation Rate in Co(II)-Dy(III) Single-Molecule Magnets through a Single-Crystal to-Single-Crystal Process. Sci. Rep. 2015, 5, 1662110.1038/srep16621. - DOI - PMC - PubMed
LinkOut - more resources
Full Text Sources
Research Materials
Miscellaneous
