. 2019 Nov;33(11):12515-12527.
doi: 10.1096/fj.201802805RR. Epub 2019 Aug 28.

Activation of ROS/MAPKs/NF-κB/NLRP3 and inhibition of efferocytosis in osteoclast-mediated diabetic osteoporosis

Affiliations

Activation of ROS/MAPKs/NF-κB/NLRP3 and inhibition of efferocytosis in osteoclast-mediated diabetic osteoporosis

Yanan An et al. FASEB J. 2019 Nov.

Abstract

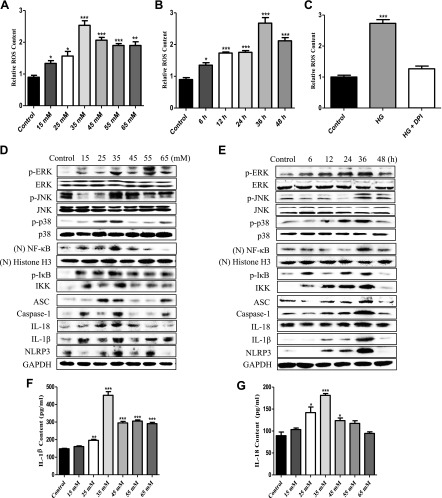
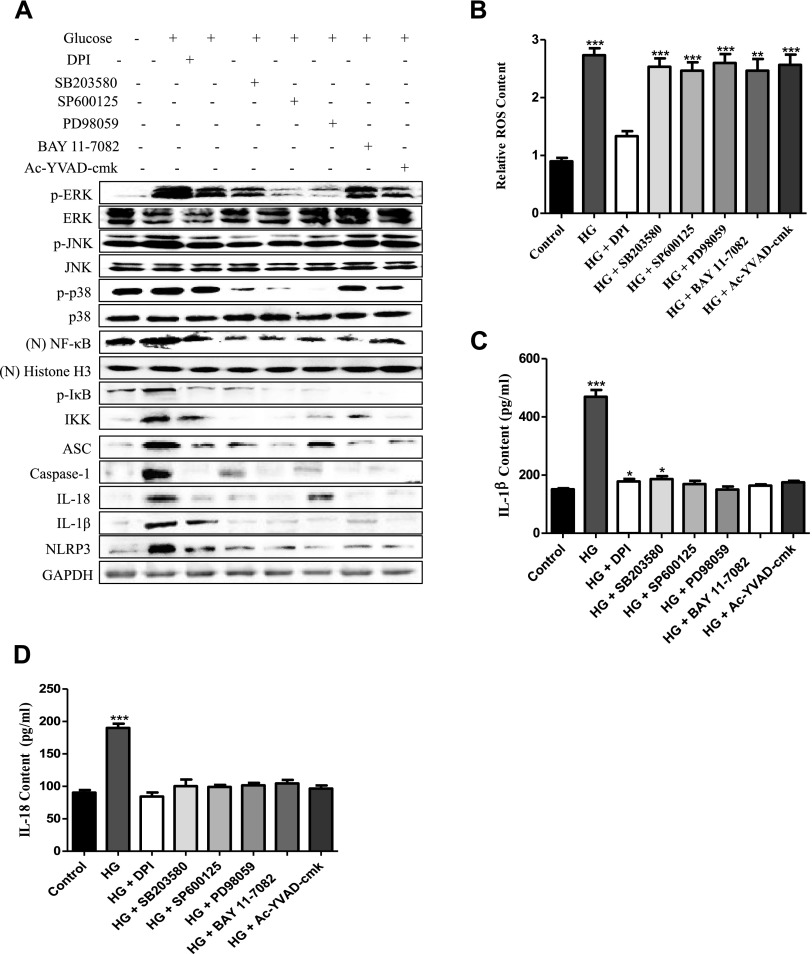
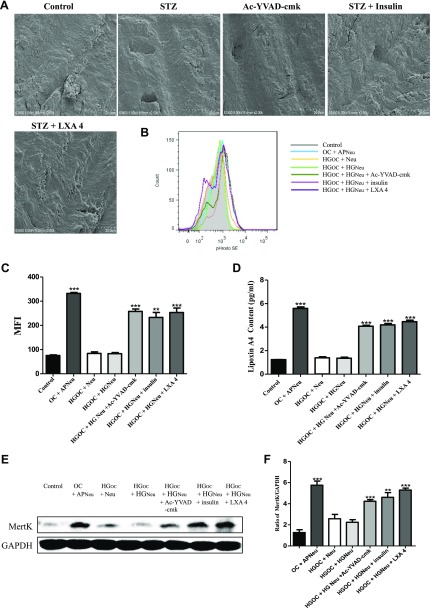
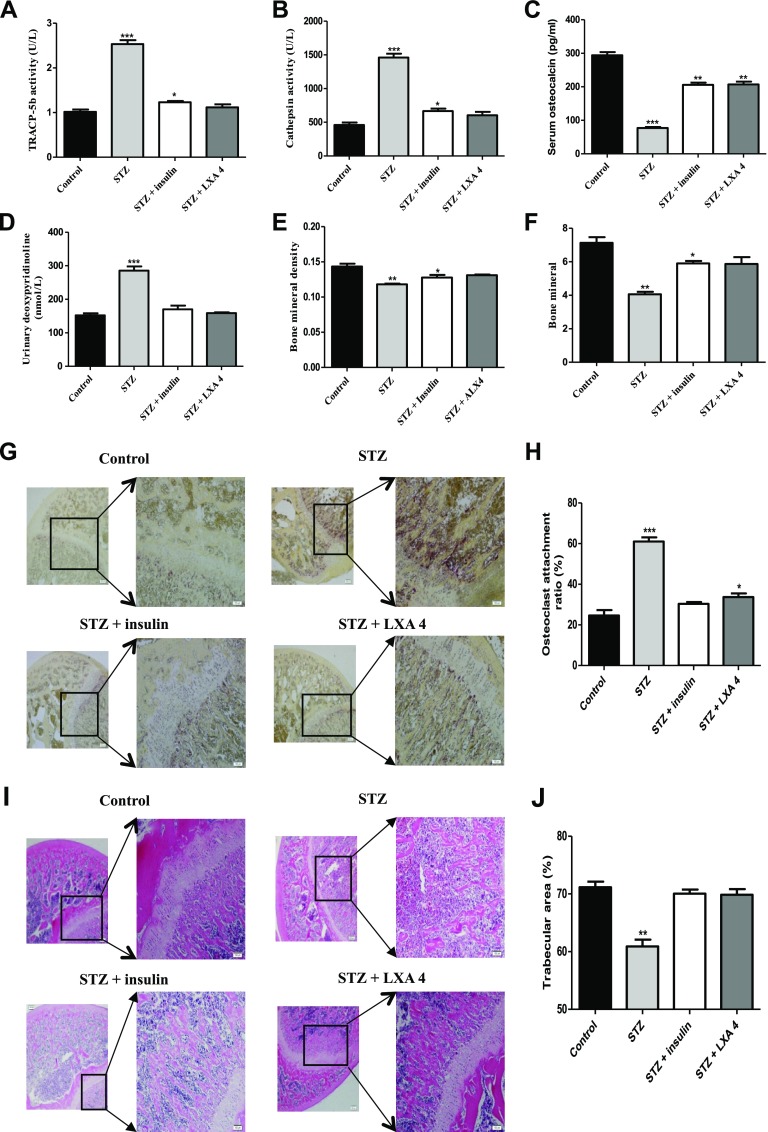
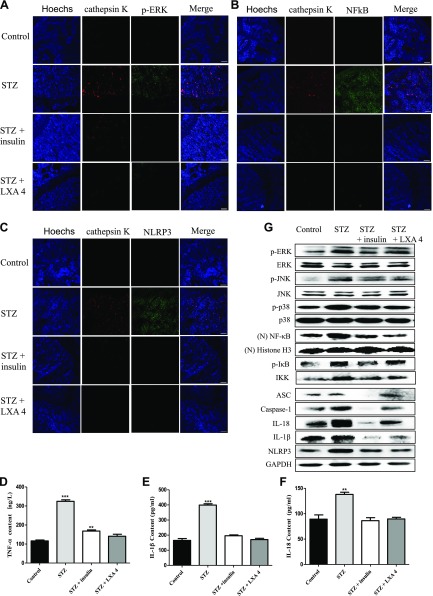
Diabetes mellitus (DM) affects bone metabolism and leads to osteoporosis; however, its pathogenetic mechanisms remain unknown. We found that high glucose (HG) conditions induced the production of reactive oxygen species (ROS) and the expression of proteins related to MAPKs [phosphorylated (p)-ERK, p-JNK, and p-p38], NF-κB (NF-κB, p-IκB, and IKK), and NACHT-LRR-PYD domains-containing protein 3 (NALP3) (NLRP3) [apoptosis-associated speck-like protein containing a caspase activation and recruitment domain (ASC), caspase-1, IL-18, IL-1β, and NLRP3] in osteoclasts (OCs) in vitro. Further analysis showed that in HG-induced OCs, ROS is an upstream signal for MAPKs, NF-κB, and the NLRP3 inflammasome. Moreover, MAPKs mediated the activation of NF-κB and NLRP3, whereas NF-κB up-regulated the NLRP3 inflammasome response. Interestingly, HG inducement enhanced the bone resorption of OCs but inhibited their efferocytosis, whereas insulin and lipoxin A4 (4) treatment reversed this phenomenon. In streptozotocin-induced diabetic rats in vivo, the numbers and the bone-resorption capacity of OCs as well as the serum levels of TRACP-5b were significantly increased, and the expression of MAPK-, NF-κB-, and NLRP3 inflammasome-related proteins in the proximal tibia were also significantly elevated; however, treatment with insulin and LXA4 reversed this elevation. Together, these results demonstrated that the activation of ROS/MAPKs/NF-κB/NLRP3 and the inhibition of efferocytosis in OCs are the main causes of osteoporosis in DM.-An, Y., Zhang, H., Wang, C., Jiao, F., Xu, H., Wang, X., Luan, W., Ma, F., Ni, L., Tang, X., Liu, M., Guo, W., Yu, L. Activation of ROS/MAPKs/NF-κB/NLRP3 and inhibition of efferocytosis in osteoclast-mediated diabetic osteoporosis.

Keywords: diabetes mellitus osteoporosis; infalmmasome; osteoclasts; reactive oxygen species.


Conflict of interest statement

The authors thank Dr. Yang Wang (Jilin University) for her help in manuscript revision. This work was supported by the Project of Science and Technology Department of Jilin Province (20180414036GH); the Education Department of Jilin Province (2016444); the State Key Project of Research and Development Plan (2017YFD0502200 and 2016YFD0501302); the National Nature Science Foundation of China (31172364 and 81801972); the Fund for Science and Technology Development of Jilin Province (20150101108JC); the Important National Science and Technology Specific Projects (2012ZX10003002); the Program for New Century Excellent Talents in University (NCET-09-0434); and the Science, Technology and Innovation Commission of Shenzhen Municipality (JCYJ2016031100720906 and JSGG20160301100442775). The authors declare no conflicts of interest.

Figures

Figure 1
Figure 1
HG induced the production of NOX2-dependent cytosolic ROS and the expression of MAPK-, NF-κB–, and NLRP3 inflammasome–related proteins in vitro. A, B) For the quantification of cytosolic ROS, OCs were incubated in 24-well plates (2 × 10⁵ cells/well) and then treated with HG at concentrations from 15 to 65 mM (A) for 5 time intervals (6–48 h) (B). C) OCs were pretreated with DPI (50 µM) for 1 h and then treated with 35 mM HG for 36 h. Cytosolic ROSs were labeled by DHR 123 (1 µM) and detected by a spectrofluorophotometer. The data were analyzed with SPSS software. ***P < 0.001 compared with the control groups in the same cell line. The data are representative of 3 experiments with similar results. D, E) Activation (phosphorylation) of MAPK- (p-ERK, p-JNK, and p-p38), (N) NF-κB–, p-IκB–, IKK–, and NLRP3 inflammasome (ASC, caspase-1, IL-18, IL-1β, and NLRP3)–related proteins, in OCs treated with different doses (15–65 mM) (D) of glucose for different times (6–48 h) (E). Western blot was used to detect the expression of p-ERK, p-JNK, p-p38, NF-κB, p-IκB, IKK, ASC, caspase-1, IL-18, IL-1β, and NLRP3. GAPDH and Histone H3 were used as an internal reference to ensure equal loading. (N) NF-κB, nuclear NF-κB; (N) Histone H3, nuclear Histone H3. F, G) Quantitative detection of IL-1β (F) and IL-18 (G) secretion was performed by ELISA. ***P < 0.001 compared with the control groups in the same cell line. The data are representative of 3 experiments with similar results.
Figure 2
Figure 2
The NLRP3 inflammasome response induced by HG was ROS/MAPKs/NF-κB–dependent in vitro. OCs were pretreated with DPI (50 µM), PD98059 (40 μM), SP600125 (10 μM), SB203580 (10 μM), BAY 11-7082 (10 μM), or Ac-YVAD-cmk (40 μM) for 1 h and then treated with 35 mM HG for 36 h. A) Western blot was used to detect the expression of p-ERK, p-JNK, p-p38, (N) NF-κB, p-IκB, IKK, ASC, caspase-1, IL-18, IL-1β, and NLRP3. GAPDH and Histone H3 were used as an internal reference to ensure equal loading. (N) NF-κB, nuclear NF-κB; (N) Histone H3 nuclear Histone H3 B) Cytosolic ROS were labeled by DHR 123 (1 µM) and detected by a spectrofluorophotometer. The data were analyzed with SPSS software. ***P < 0.001 compared with the control groups in the same cell line. The data are representative of 3 experiments with similar results. C, D) Quantitative detection of IL-1β (C) and IL-18 (D) secretion was performed by ELISA. ***P < 0.001 compared with the control groups in the same cell line. The data are representative of 3 experiments with similar results.
Figure 3
Figure 3
HG conditions induced increased bone resorption capacity and inhibited the occurrence of efferocytosis in OCs. A) OCs were seeded on slices of bovine bone and induced with 35 mm glucose for 36 h with or without Ac-YVAD-cmk, insulin, and LXA4 pretreatment. SEM was then used to analyze the numbers of resorption pits. B, C) OCs were cocultured with apoptotic or nonapoptotic neutrophils labeled with pHrodo dye for 30 min. The fluorescence intensity of pHrodo in OCs cocultured with apoptotic neutrophils was detected by flow cytometry. The results are presented as the mean fluorescence intensities (MFIs). ***P < 0.001 compared with the control groups of OCs cocultured with neutrophils (nonapoptotic). The data are representative of 3 experiments with similar results. The histogram figure represents the comparison of the 35-mm HG–induced group and the control group. D) Quantitative detection of cell supernatant LXA4 secretion was performed by ELISA. ***P < 0.001 compared with the control groups. E) Western blot was conducted to assess the level of MertK. F) The ratio of MertK to GAPDH was calculated. *P < 0.05, **P < 0.01, ***P < 0.001 compared with the control groups in the same cell line. The data are representative of 3 experiments with similar results. Control, untreated OCs; OC + APNeu, OCs and apoptotic neutrophil coincubation; HGOC + Neu, HG-treated OCs incubated with normal neutrophils; HGOC + HGNeu, OCs and neutrophils treated with HG and then coincubated; HGOC + HGNeu + Ac-YVAD-cmk, OCs and neutrophils treated with HG and then coincubated with Ac-YVAD-cmk; HGOC + HGNeu + insulin, OCs and neutrophils treated with HG and then coincubated with insulin; HGOC + HGNeu + LXA4, OCs and neutrophils treated with HG and then coincubated with LXA4.
Figure 4
Figure 4
Insulin and LXA4 treatment improved the indicators of osteoporosis in STZ-induced diabetic rats in vivo. AD) The levels of TRAP (A), cathepsin K (B), and osteocalcin in the serum (C), and deoxypyridinoline in the urine (D) were detected by ELISA. *P < 0.05, **P < 0.01, ***P < 0.001 compared with the control groups. The data are representative of 8 rat experiments with similar results. E, F) DXA was used to assay the BMD (E) and bone mineral content (F). *P < 0.05, **P < 0.01, ***P < 0.001 compared with the control groups. G) Paraformaldehyde-fixed, decalcified, and paraffin-embedded proximal tibias obtained from the control, diabetic, insulin-, or LXA4-supplemented diabetic rats were processed for TRAP staining. TRAP-positive cells appear red (original magnification, ×20). H) The percentage of OC attachment ratio was calculated. *P < 0. 05, ***P < 0.001 compared with the control groups. I) The bone tissue was stained with H&E (original magnification, ×20). J) The percentage of trabecular area was calculated by ImageJ. **P < 0.01 compared with the control groups. The data are representative of 8 rat experiments with similar results.
Figure 5
Figure 5
The expression of proteins involved in MAPK signaling, NF-κB signaling, and the NLRP3 inflammasome in OC-mediated osteoporosis was assessed in STZ-induced diabetic rats in vivo. AC) Immunofluorescence was used to analyze the proximal tibia for cathepsin K colocalization with p-ERK (A), NF-κB (B), and NLRP3 (C). The images were obtained by laser-scanning confocal microscopy with an original magnification, ×20 objective lens. Scale bars, 50 μm. DF) The levels of TNF-α (D), IL-1β (E), and IL-18 (F) in rat serum were detected by ELISA. *P < 0.05, **P < 0.01, ***P < 0.001 compared with the control groups. The data are representative of 8 rat experiments with similar results. G) MAPK/NF-κB/NLRP3 inflammasome–related protein levels were assessed in the proximal tibia. Total protein was extracted from the proximal tibia of rats 3 wk after the STZ injection. The protein levels of p-ERK, p-JNK, nuclear NF-κB, p-IκB, IKK, ASC, caspase-1, IL-18, IL-1β, and NLRP3 were determined by Western blot and are expressed relative to the internal standard, GAPDH, and Histone H3 The data are representative of 8 rat experiments with similar results.

References

    1. Bain S., Ramamurthy N. S., Impeduglia T., Scolman S., Golub L. M., Rubin C. (1997) Tetracycline prevents cancellous bone loss and maintains near-normal rates of bone formation in streptozotocin diabetic rats. Bone 21, 147–153 - PubMed
    1. Hie M., Yamazaki M., Tsukamoto I. (2009) Curcumin suppresses increased bone resorption by inhibiting osteoclastogenesis in rats with streptozotocin-induced diabetes. Eur. J. Pharmacol. 621, 1–9 - PubMed
    1. Saito M., Marumo K. (2010) Collagen cross-links as a determinant of bone quality: a possible explanation for bone fragility in aging, osteoporosis, and diabetes mellitus. Osteoporos. Int. 21, 195–214 - PubMed
    1. Lu H., Kraut D., Gerstenfeld L. C., Graves D. T. (2003) Diabetes interferes with the bone formation by affecting the expression of transcription factors that regulate osteoblast differentiation. Endocrinology 144, 346–352 - PubMed
    1. Vestergaard P. (2009) Bone metabolism in type 2 diabetes and role of thiazolidinediones. Curr. Opin. Endocrinol. Diabetes Obes. 16, 125–131 - PubMed

Publication types

MeSH terms

Substances