. 2019 Aug 28;14(8):e0220896.
doi: 10.1371/journal.pone.0220896. eCollection 2019.

The effect of using a cycling workstation on mouse dexterity

Affiliations

The effect of using a cycling workstation on mouse dexterity

Anna Anderson et al. PLoS One. .

Abstract

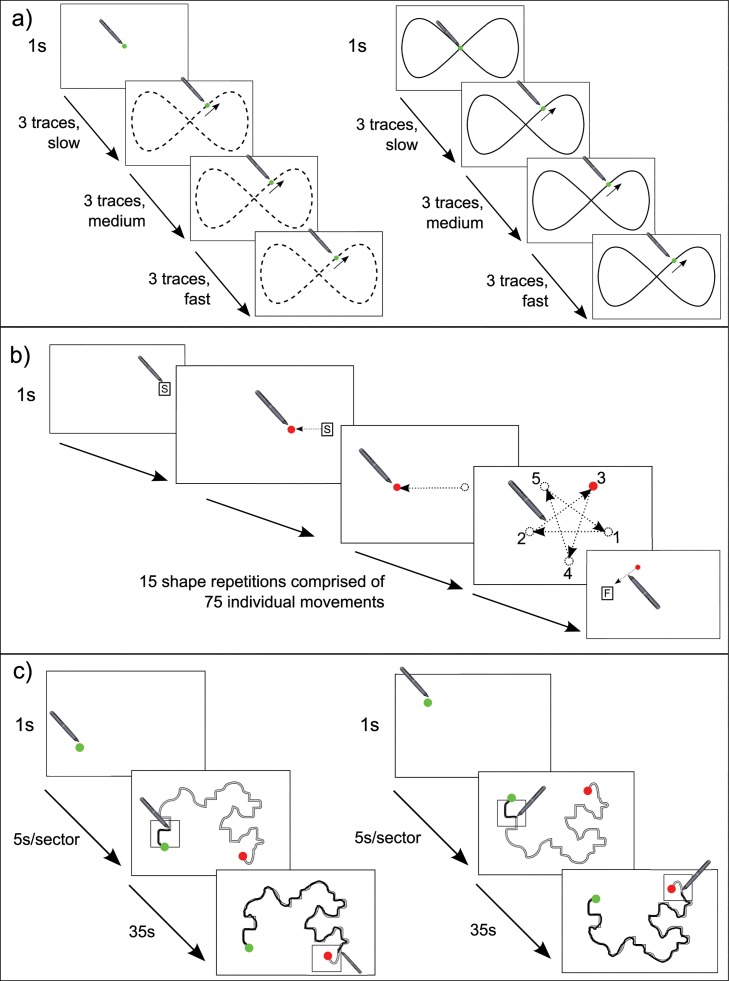
This study investigated the effect of using a cycling workstation on mouse dexterity, including if and how this changed with practice. Thirty-four healthy adults were allocated to a sitting group (n = 17) or cycling group (n = 17). All participants completed standardised computer tasks on 6 occasions: baseline and final-all participants were seated; practice 1 to 4-sitting group participants were seated, cycling group participants pedalled on an under desk cycle. Three computer tasks were employed: (1) Tracking (continuous task)-participants used the mouse pointer to track a dot in a figure of 8 pattern at 3 different speeds without a guide then with a guide (2) Aiming (discrete task)-participants moved the mouse pointer to a dot which repeatedly disappeared then reappeared again in different locations, creating the outline of a pentagram (3) Steering (continuous task)-participants steered the mouse pointer around two different pathways. Accuracy was measured during the Tracking and Steering tasks as the root mean square error and penalised path accuracy respectively. Speed was measured during the Aiming task as the movement time. Data was analysed using frequentist and Bayes Factor analyses. During the continuous tasks (Tracking and Steering), accuracy was impaired among participants using the cycling workstation, both compared to their accuracy when seated and to the accuracy of participants in the sitting group. In contrast, no deficits in speed were noted among participants using the cycling work station during the discrete task (Aiming). No learning effects were observed among either group for any tasks. These findings suggest using a cycling workstation may impair the accuracy but not speed of mouse use, regardless of task practice. Overall this supports the implementation of cycling workstations in typical office settings, but suggests cycling workstations may impair productivity among workers performing high precision mouse tasks.


Conflict of interest statement

The authors have declared that no competing interests exist.

Figures

Fig 1
Fig 1. Experimental set up for participants in the cycling group.
(A) Overall experimental set up. (B) Close up view of the DeskCycle.
Fig 2
Fig 2. Illustrations of the three subtests included in the Clinical Kinematic Assessment Tool (CKAT) test battery.
(A) Tracking (left–no guide; right–with guide); (B) Aiming; (C) Steering (left–shape A; right–shape B). Figure reproduced with permission from Flatters et al. (2014) [28].
Fig 3
Fig 3. Tracking.
Shows line graphs of average root mean square error (RMSE) during the tracking subtest across all sessions. Graph A (top) = no guide; Graph B = with guide. Circles represent the cycling group, triangles the sitting group. Smaller RMSE values indicate greater accuracy. Error bars represent standard error of the mean.
Fig 4
Fig 4. Aiming.
Shows line graph of mean movement time during the aiming subtest across all sessions. Circles represent the cycling group, triangles the sitting group. Lower scores correspond to faster (better) performance. Error bars represent standard error of the mean.
Fig 5
Fig 5. Steering.
Shows line graph of mean penalised path accuracy (pPA) during the steering subtest across all sessions. Graph A (top) = shape A data, Graph B (bottom) = shape B. Circles represent the cycling group, triangles the sitting group. Smaller pPA values indicate greater accuracy. Error bars represent standard error of the mean.

References

    1. Lee IM, Shiroma EJ, Lobelo F, Puska P, Blair SN, Katzmarzyk PT, et al. Effect of physical inactivity on major non-communicable diseases worldwide: an analysis of burden of disease and life expectancy. Lancet. 2012;380(9838):219–29. 10.1016/S0140-6736(12)61031-9 - DOI - PMC - PubMed
    1. Arem H, Moore SC, Patel A, Hartge P, Berrington de Gonzalez A, Visvanathan K, et al. Leisure time physical activity and mortality: a detailed pooled analysis of the dose-response relationship. JAMA Intern Med. 2015;175(6):959–67. 10.1001/jamainternmed.2015.0533 - DOI - PMC - PubMed
    1. Ding D, Lawson KD, Kolbe-Alexander TL, Finkelstein EA, Katzmarzyk PT, van Mechelen W, et al. The economic burden of physical inactivity: a global analysis of major non-communicable diseases. Lancet. 2016;388(10051):1311–24. 10.1016/S0140-6736(16)30383-X - DOI - PubMed
    1. Biswas A, Oh PI, Faulkner GE, Bajaj RR, Silver MA, Mitchell MS, et al. Sedentary time and its association with risk for disease incidence, mortality, and hospitalization in adults: a systematic review and meta-analysis. Ann Intern Med. 2015;162(2):123–32. 10.7326/M14-1651 - DOI - PubMed
    1. Patterson R, McNamara E, Tainio M, de Sá TH, Smith AD, Sharp SJ, et al. Sedentary behaviour and risk of all-cause, cardiovascular and cancer mortality, and incident type 2 diabetes: a systematic review and dose response meta-analysis. Eur J Epidemiol. 2018. - PMC - PubMed

Publication types