

Major adverse cardiovascular events in people with chronic kidney disease in relation to disease severity and diabetes status
- PMID: 31461449
- PMCID: PMC6713399
- DOI: 10.1371/journal.pone.0221044
Major adverse cardiovascular events in people with chronic kidney disease in relation to disease severity and diabetes status
Abstract
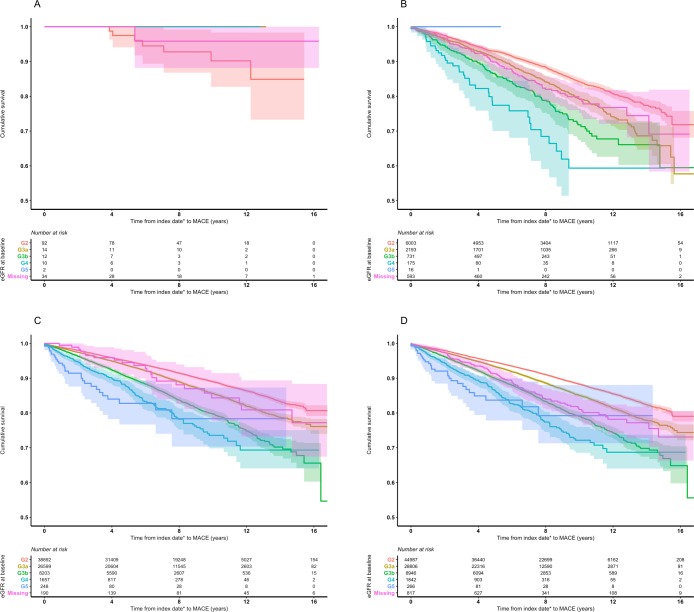
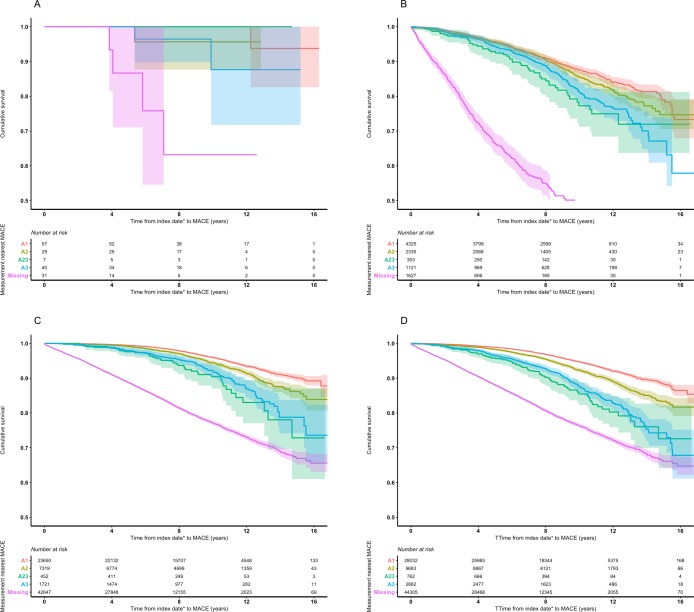
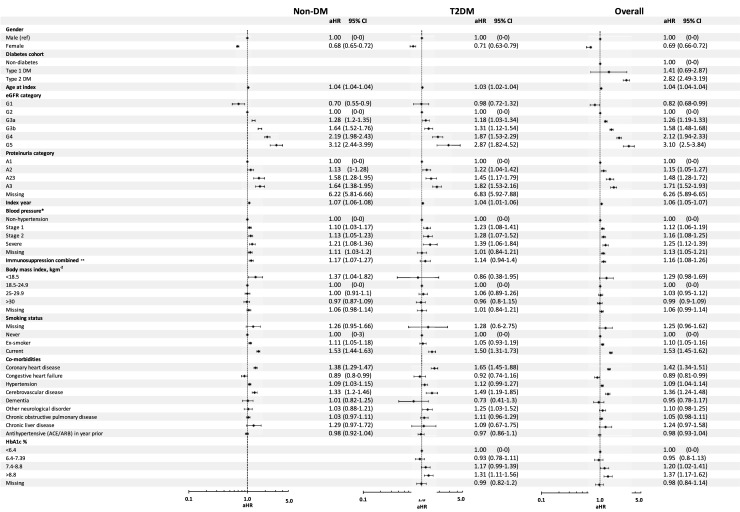
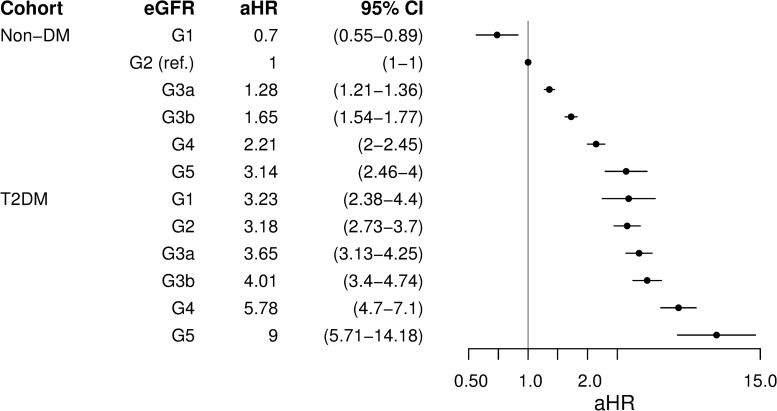
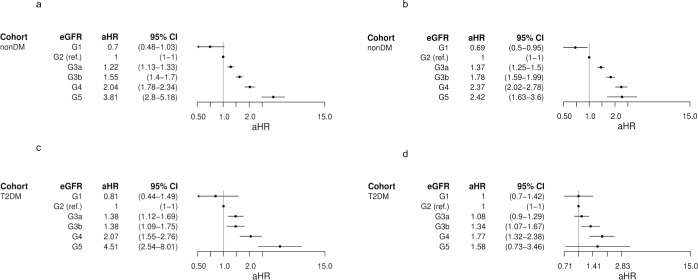
Diabetes plays an important role in the complex relationship between chronic kidney disease (CKD) and cardiovascular disease. This retrospective observational study compared the influence of estimated glomerular filtration rate (eGFR) and proteinuria on the risk of major adverse cardiovascular event (MACE; myocardial infarction or stroke) in CKD patients with and without diabetes. Data were from a linked database of UK electronic health records. Individuals with CKD and no prior MACE were classified as type 1 diabetes (T1DM; n = 164), type 2 diabetes (T2DM; n = 9,711), and non-diabetes (non-DM; n = 75,789). Monthly updated time-dependent Cox proportional hazard models were constructed to calculate adjusted hazard ratios (aHRs) for progression to MACE from first record of abnormal eGFR or proteinuria (index date). In non-DM, aHRs (95% CIs) by baseline eGFR category (referent G2) were G1: 0.70 (0.55-0.90), G3a: 1.28 (1.20-1.35), G3b: 1.64 (1.52-1.76), G4: 2.19 (1.98-2.43), and G5: 3.12 (2.44-3.99), and by proteinuria category (referent A1) were A2: 1.13 (1.00-1.28), A2/3 (severity indeterminable): 1.58 (1.28-1.95), and A3: 1.64 (1.38-1.95). In T2DM, aHRs were G1: 0.98 (0.72-1.32), G3a: 1.18 (1.03-1.34), G3b: 1.31 (1.12-1.54), G4: 1.87 (1.53-2.29), G5: 2.87 (1.82-4.52), A2: 1.22 (1.04-1.42), A2/3: 1.45 (1.17-1.79), and A3: 1.82 (1.53-2.16). Low numbers in T1DM precluded analysis. Modelling T2DM and non-DM together, aHRs were, respectively, G1: 3.23 (2.38-4.40) and 0.70 (0.55-0.89); G2: 3.18 (2.73-3.70) and 1.00 (referent); G3a: 3.65 (3.13-4.25) and 1.28 (1.21-1.36); G3b: 4.01 (3.40-4.74) and 1.65 (1.54-1.77); G4: 5.78 (4.70-7.10) and 2.21 (2.00-2.45); G5: 9.00 (5.71-14.18) and 3.14 (2.46-4.00). In conclusion, reduced eGFR and proteinuria were independently associated with increased risk of MACE regardless of diabetes status. However, the risk of MACE in the same eGFR state was 4.6-2.4 times higher in T2DM than in non-DM.
Conflict of interest statement
I have read the journal's policy and the authors of this manuscript have the following competing interests: CJC is a director of and EB, TRB, and SJJ are employees of Pharmatelligence, a research consultancy that received funding from MedImmune (now AztraZeneca PLC) for this study. MS, LJ, PA, and MJ are employees of AstraZeneca PLC. This does not alter our adherence to PLOS ONE policies on sharing data and materials.
Figures

References
-
- National Kidney Foundation. K/DOQI clinical practice guidelines for chronic kidney disease: evaluation, classification, and stratification. Am J Kidney Dis. 2002;39(suppl): S1–266. - PubMed
-
- Kidney Disease: Improving Global Outcomes (KDIGO) CKD Work Group. KDIGO 2012 clinical practice guideline for the evaluation and management of chronic kidney disease. Kidney Int Suppl. 2013;1: 1–150.
-
- Liu M, Li X-C, Lu L, Cao Y, Sun R-R, Chen S, et al. Cardiovascular disease and its relationship with chronic kidney disease. Eur Rev Med Pharmacol Sci. 2014;18: 2918–2926. - PubMed
Publication types
MeSH terms
LinkOut - more resources
Full Text Sources
Medical
Research Materials
Miscellaneous
