. 2019 Aug 27;28(9):2306-2316.e5.
doi: 10.1016/j.celrep.2019.07.097.

UCP2 Deficiency Increases Colon Tumorigenesis by Promoting Lipid Synthesis and Depleting NADPH for Antioxidant Defenses

Affiliations

UCP2 Deficiency Increases Colon Tumorigenesis by Promoting Lipid Synthesis and Depleting NADPH for Antioxidant Defenses

Esther Aguilar et al. Cell Rep. .

Abstract

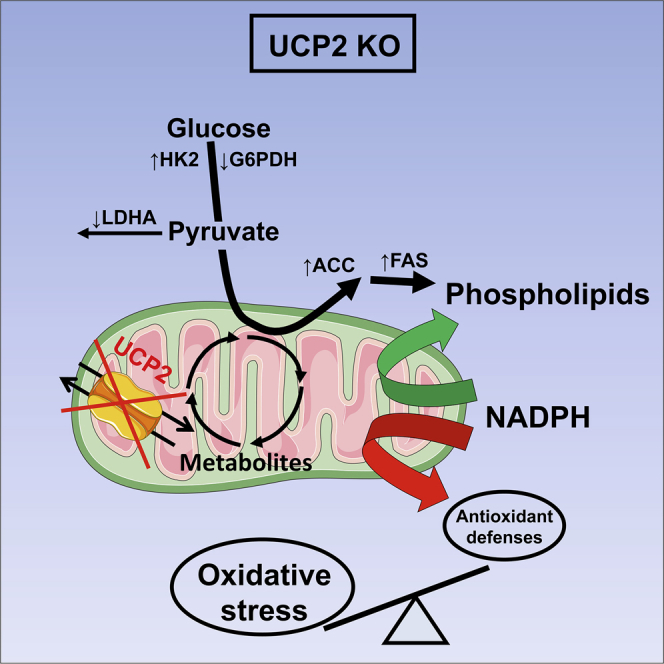
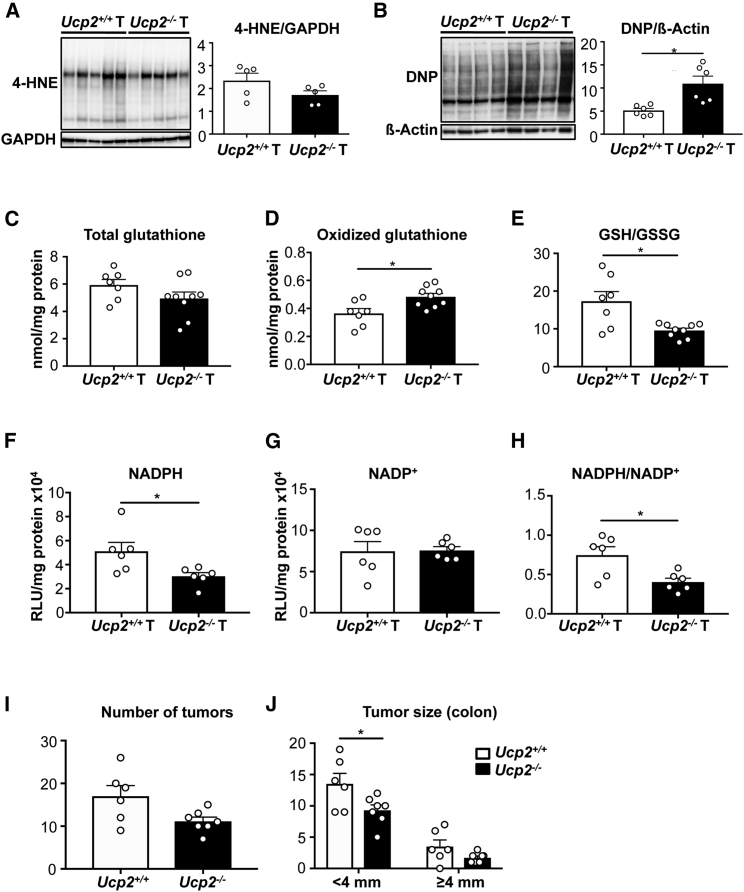
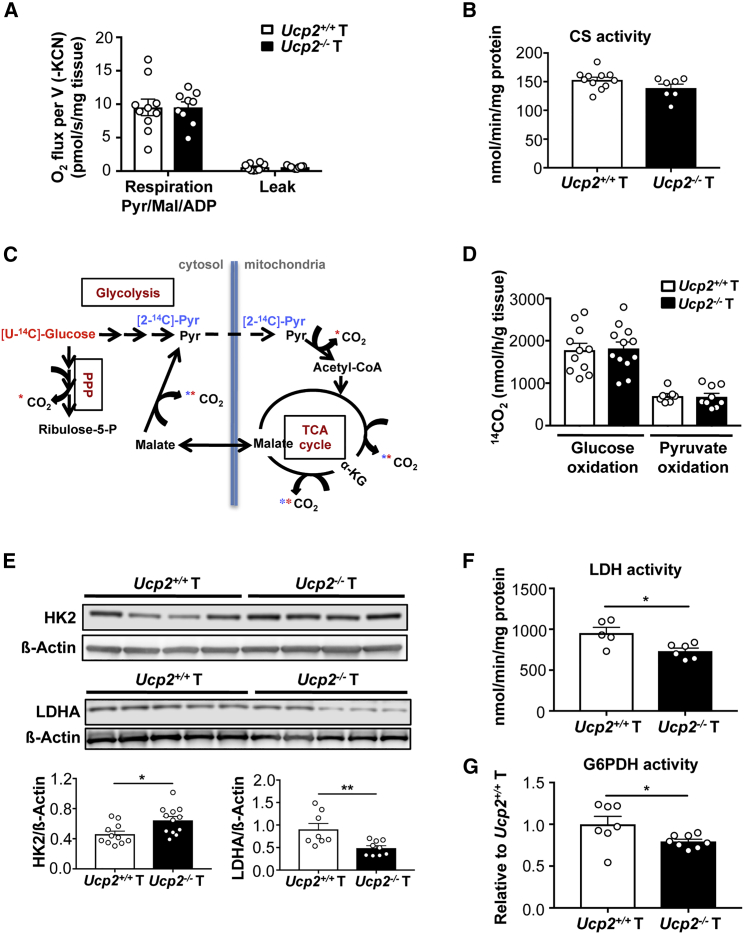
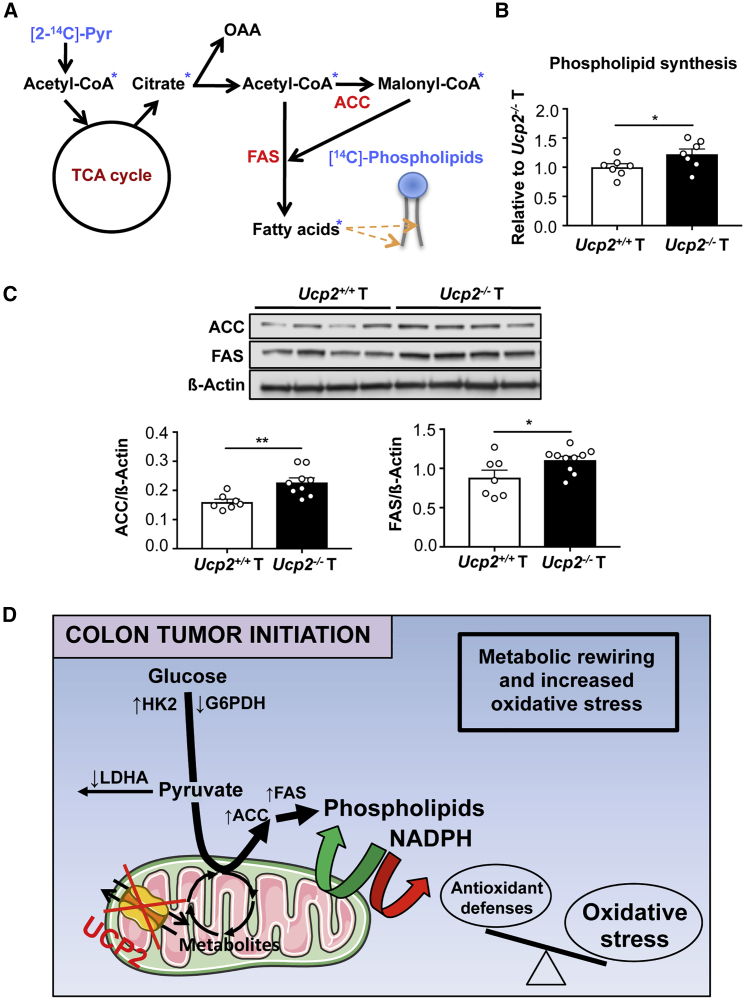
Colorectal cancer (CRC) is associated with metabolic and redox perturbation. The mitochondrial transporter uncoupling protein 2 (UCP2) controls cell proliferation in vitro through the modulation of cellular metabolism, but the underlying mechanism in tumors in vivo remains unexplored. Using murine intestinal cancer models and CRC patient samples, we find higher UCP2 protein levels in tumors compared to their non-tumoral counterparts. We reveal the tumor-suppressive role of UCP2 as its deletion enhances colon and small intestinal tumorigenesis in AOM/DSS-treated and ApcMin/+ mice, respectively, and correlates with poor survival in the latter model. Mechanistically, UCP2 loss increases levels of oxidized glutathione and proteins in tumors. UCP2 deficiency alters glycolytic pathways while promoting phospholipid synthesis, thereby limiting the availability of NADPH for buffering oxidative stress. We show that UCP2 loss renders colon cells more prone to malignant transformation through metabolic reprogramming and perturbation of redox homeostasis and could favor worse outcomes in CRC.

Keywords: colorectal cancer; lipid synthesis; mitochondria; mitochondrial carrier; oxidative stress; tumor metabolic reprogramming; tumor metabolism; uncoupling protein 2.


Conflict of interest statement

The authors declare no competing interests.

Figures

None
Graphical abstract
Figure 1
Figure 1
UCP2 Protein Is Overexpressed in Established Colon and Intestinal Tumors (A) Protocol for AOM/DSS-induced colorectal tumorigenesis in C57BL6/J mice. (B) UCP2 mRNA expression measured by qPCR in colonic non-tumoral (NT) tissue and colon tumors (T) from AOM/DSS-treated Ucp2+/+ mice. Values are expressed relative to NT (n = 6). (C) Immunoblot of UCP2 in whole mitochondrial extracts from duodenum (Duo), jejunum (Jej), ileum (Ile), cecum (Cec), and colon. Lung is shown as a positive control for UCP2 expression. Ucp2−/− samples were used as negative controls (n = 3). (D) Western blot analysis of UCP2 expression in colons of non-treated Ucp2+/+ mice and in colonic NT tissue of AOM/DSS-treated Ucp2+/+ mice. Data represent means ± SEMs (n = 3). (E) Immunoblot of UCP2 in mitochondrial extracts from colon NT tissue and T from AOM/DSS-treated Ucp2+/+ mice (n = 8). (F) Immunoblot of UCP2 expression in mitochondrial extracts from jejunum NT tissue and T from ApcMin/+ mice (n = 4). (G) UCP2 mRNA levels in human T from stages II (n = 4) and III (n = 6) and matched normal mucosa (N) from colorectal cancer (CRC) patients. Values are expressed relative to N. (H) Immunoblot of UCP2 in six pairs of T samples and matched N from CRC patients (n = 6). In all of the panels, data are the means ± SEMs. See also Figure S1 and Table S1.
Figure 2
Figure 2
Targeting UCP2 Expression Increases Colorectal Tumorigenesis in AOM/DSS-Treated Mice (A) Total number of colon tumors in AOM/DSS-treated mice quantified by blue methylene staining. Data indicate means ± SEMs (Ucp2+/+ n = 8, Ucp2−/− n = 13). (B) Representative H&E-stained sections from colon tumors from AOM/DSS-treated Ucp2+/+ and Ucp2−/− mice. Scale bar, 200 μm. (C) Size of individual colon tumors in AOM/DSS-treated mice, presented as means ± SEMs (Ucp2+/+ n = 8, Ucp2−/− n = 13). (D) Total number of tumors along the small intestine and colon in Ucp2+/+ApcMin/+ and Ucp2−/−ApcMin/+ mice. Data represent means ± SEMs (n = 7). (E) Number of tumors in the duodenum, jejunum, ileum, and colon in Ucp2+/+ApcMin/+ and Ucp2−/−ApcMin/+ mice. Data represent means ± SEMs (n = 7). (F) Size of individual jejunum tumors from ApcMin/+ mice, presented as means ± SEMs (n = 7). (G) Kaplan-Meier survival curve. Each survival curve consists of data from 11 mice. See also Figure S2.
Figure 3
Figure 3
UCP2 Loss in AOM/DSS-Treated Mice Leads to a Differential Metabolic Gene Expression in Colon Tumors (A) Heatmap of the log2 relative expression values for each gene in each tumor (T) type plotted in red–blue color scale, with red indicating high gene expression and blue indicating low gene expression (n = 5). (B) Bar plot ranking of the top 10 Gene Ontology (GO) cellular components based on fold enrichment. (C) Pie chart of the biological processes associated with the upregulated genes after UCP2 loss in colon tumors. Biological categories were obtained using GO annotations from the PANTHER classification system. (D) GO analysis of the total number of differentially expressed genes involved in metabolic processes. (E) Gene function analysis using the software Ingenuity Pathway Analysis (IPA). Graph shows top molecular and cellular functions altered in Ucp2−/− tumors compared to Ucp2+/+ tumors. Bars above the line are statistically significant (p < 0.05) (n = 5). See also Table S2.
Figure 4
Figure 4
The Absence of UCP2 in Colon Tumors Promotes Glutathione Oxidation and Protein Carbonylation and Depletes NADPH Levels (A) Western blot analysis for 4-hydroxy-2-nonenal (4-HNE)-modified proteins in colon tumor (T) samples. Data indicate means ± SEMs (n = 5). (B) Representative immunoblot of protein oxidation levels (total carbonyl groups with dinitrophenyl [DNP]) in colon T samples. Data indicate means ± SEMs (n = 6). (C–E) Total glutathione (C), oxidized glutathione (GSSG) (D), and ratio of reduced glutathione (GSH) versus GSSG (E). Total GSH and GSSG were normalized by protein content. Data indicate means ± SEMs (Ucp2+/+ T n = 7, Ucp2−/− T n = 9). (F–H) NADPH (F) and NADP+ (G) levels normalized to protein content and ratio of reduced NADPH versus oxidized NADP+ (H). Data indicate means ± SEMs (n = 6). (I) Total number of colon tumors in mice fed with BHA and AOM/DSS treated. Data indicate means ± SEMs (Ucp2+/+ n = 6, Ucp2−/− n = 7). (J) Size of individual colon tumors in mice fed with BHA and AOM/DSS treated, presented as means ± SEMs (Ucp2+/+ n = 6, Ucp2−/− n = 7).
Figure 5
Figure 5
UCP2 Invalidation Increases HK2 Protein Expression and Decreases LDHA and G6PDH Activities in Colon Tumors (A) Mitochondrial respiration rate was determined in the presence of 10 mM pyruvate, 5 mM malate, and 1.4 mM ADP. The leak was measured after adding 1 μg/mL oligomycin (Ucp2+/+ T n = 10, Ucp2−/− T n = 9). (B) CS enzyme activity normalized to protein content. Data represent means ± SEMs (Ucp2+/+ T n = 11, Ucp2−/− T n = 7). (C) Scheme showing the 14CO2-producing reactions from [U-14C]-glucose (red) and [2-14C]-pyruvate (blue). (D) [U-14C]-glucose (Ucp2+/+ n = 11, Ucp2−/− n = 12) and [2-14C]-pyruvate (Ucp2+/+ n = 7, Ucp2−/− T n = 9) oxidation into 14CO2 of Ucp2+/+and Ucp2−/− colon tumors (T). Data indicate means ± SEMs. (E) Immunoblots and quantifications of HK2 and LDHA expression using whole-cell extracts from colon tumors. Data indicate means ± SEMs (n = 8–12). (F) LDH enzyme activity. Data represent means ± SEMs (Ucp2+/+ n = 5, Ucp2−/− n = 6). (G) G6PDH enzyme activity relative to Ucp2+/+ T (Ucp2+/+ n = 7, Ucp2−/− n = 8). See also Figures S3 and S4.
Figure 6
Figure 6
UCP2 Loss Promotes Phospholipid Synthesis and Increases Expression of Lipogenic Enzymes in Colon Tumors (A) Scheme showing the incorporation of radioactivity from [2-14C]-pyruvate into phospholipids. (B) [2-14C]-pyruvate esterification into phospholipids. Data indicate means ± SEMs (n = 7). (C) Representative immunoblot analysis of ATP citrate lyase (ACLY), ACC, and FAS using whole-cell extracts. Data indicate means ± SEMs (n = 7–10). (D) Altered metabolic and redox landscape accompanying UCP2 loss favoring colon tumor initiation. Green arrows indicate upregulated reactions, and red arrows indicate downregulated reactions. UCP2 loss in colon tumors redirects glucose metabolism toward phospholipid synthesis. This is achieved by increasing the protein expression of HK2, ACC, and FAS and decreasing the enzyme activity of LDHA and G6PDH. The high demand of NADPH for fatty acid synthesis depletes the levels of this cofactor within Ucp2−/− colon tumors, becoming limiting for the antioxidant defense system. Consequently, the levels of oxidative stress increase in Ucp2−/− colon tumors, impairing the cellular redox balance.

References

    1. Ahmed E.K., Rogowska-Wrzesinska A., Roepstorff P., Bulteau A.L., Friguet B. Protein modification and replicative senescence of WI-38 human embryonic fibroblasts. Aging Cell. 2010;9:252–272. - PubMed
    1. Alves-Guerra M.C., Rousset S., Pecqueur C., Mallat Z., Blanc J., Tedgui A., Bouillaud F., Cassard-Doulcier A.M., Ricquier D., Miroux B. Bone marrow transplantation reveals the in vivo expression of the mitochondrial uncoupling protein 2 in immune and nonimmune cells during inflammation. J. Biol. Chem. 2003;278:42307–42312. - PubMed
    1. Arsenijevic D., Onuma H., Pecqueur C., Raimbault S., Manning B.S., Miroux B., Couplan E., Alves-Guerra M.C., Goubern M., Surwit R. Disruption of the uncoupling protein-2 gene in mice reveals a role in immunity and reactive oxygen species production. Nat. Genet. 2000;26:435–439. - PubMed
    1. Blanc J., Alves-Guerra M.C., Esposito B., Rousset S., Gourdy P., Ricquier D., Tedgui A., Miroux B., Mallat Z. Protective role of uncoupling protein 2 in atherosclerosis. Circulation. 2003;107:388–390. - PubMed
    1. Bouillaud F., Alves-Guerra M.C., Ricquier D. UCPs, at the interface between bioenergetics and metabolism. Biochim. Biophys. Acta. 2016;1863:2443–2456. - PubMed

Publication types

MeSH terms