. 2019 Aug 27;28(9):2317-2330.e8.
doi: 10.1016/j.celrep.2019.07.063.

Synthetic Essentiality of Metabolic Regulator PDHK1 in PTEN-Deficient Cells and Cancers

Affiliations

Synthetic Essentiality of Metabolic Regulator PDHK1 in PTEN-Deficient Cells and Cancers

Nilanjana Chatterjee et al. Cell Rep. .

Abstract

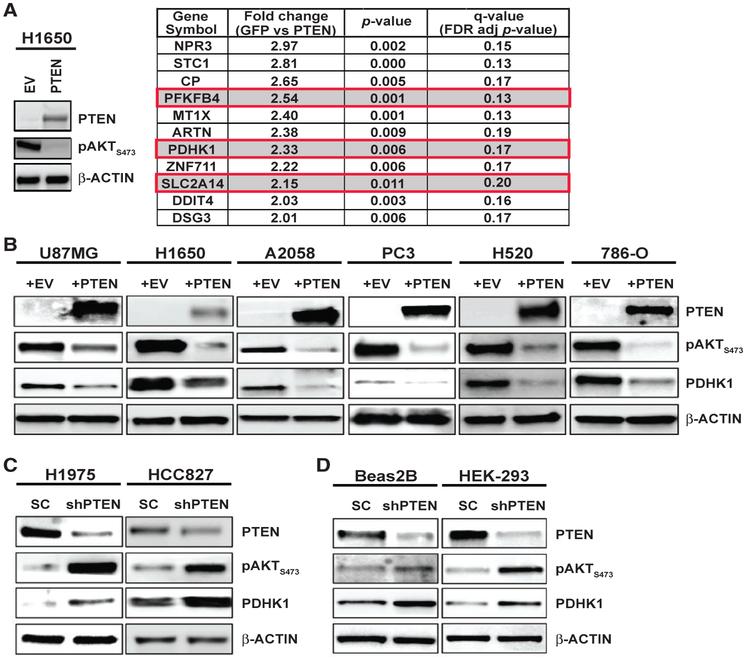
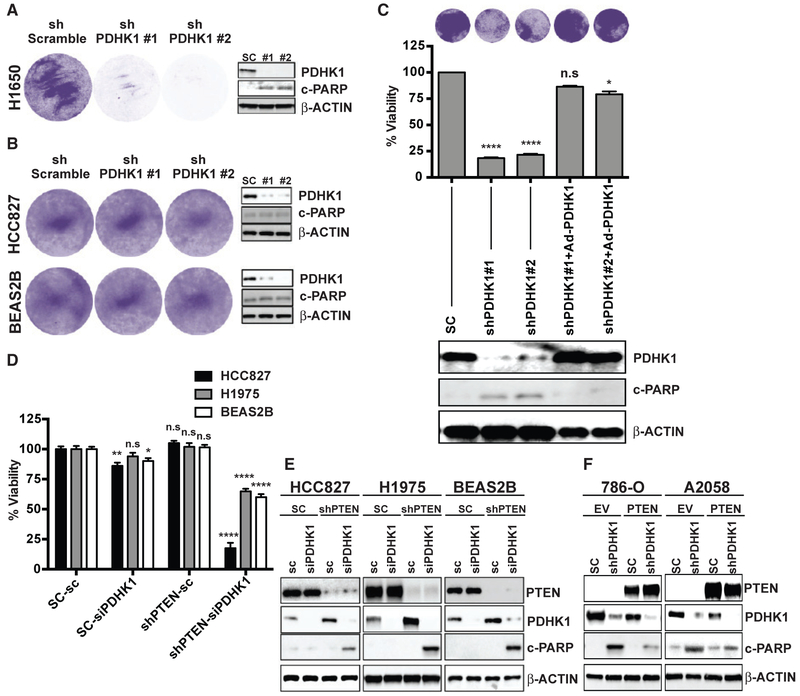
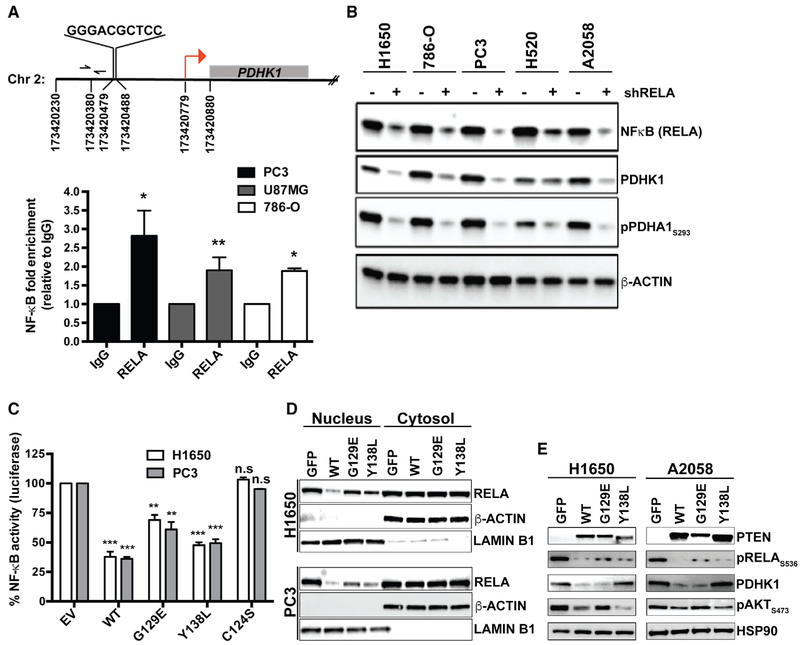
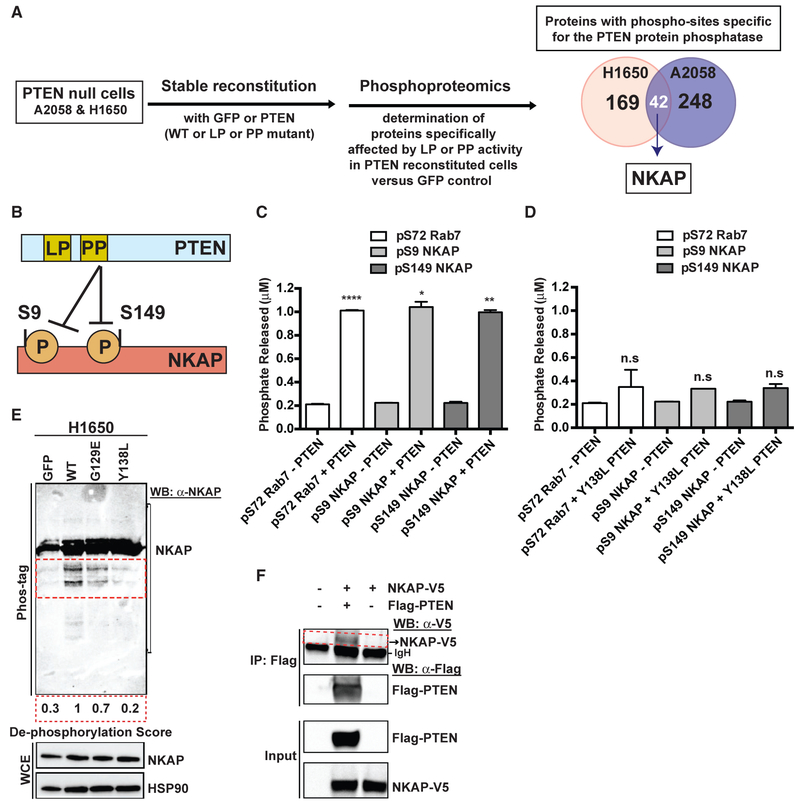
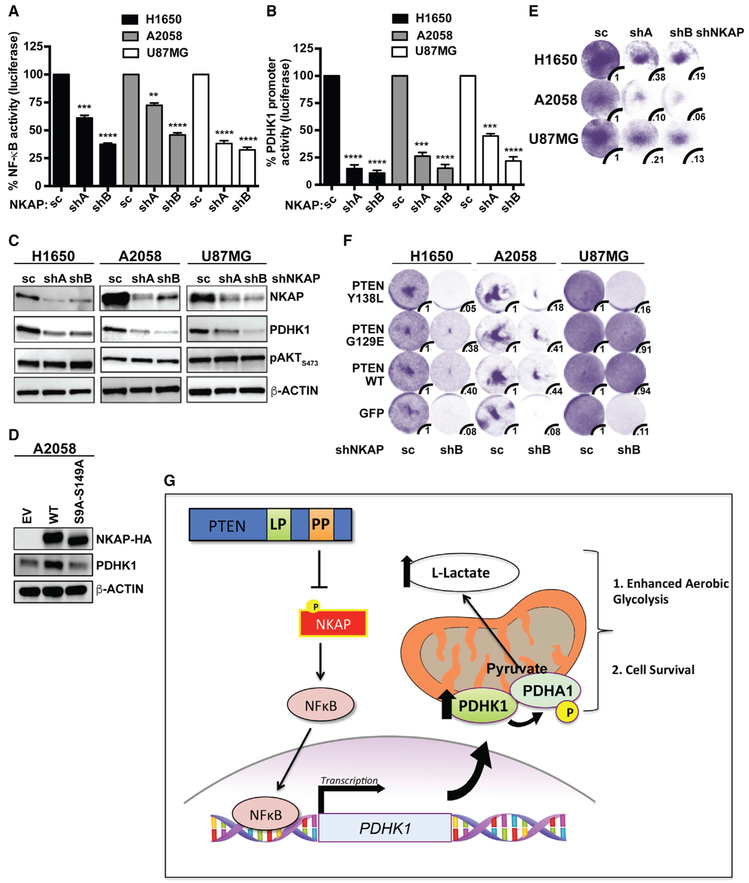
Phosphatase and tensin homolog deleted on chromosome 10 (PTEN) is a tumor suppressor and bi-functional lipid and protein phosphatase. We report that the metabolic regulator pyruvate dehydrogenase kinase1 (PDHK1) is a synthetic-essential gene in PTEN-deficient cancer and normal cells. The PTEN protein phosphatase dephosphorylates nuclear factor κB (NF-κB)-activating protein (NKAP) and limits NFκB activation to suppress expression of PDHK1, a NF-κB target gene. Loss of the PTEN protein phosphatase upregulates PDHK1 to induce aerobic glycolysis and PDHK1 cellular dependence. PTEN-deficient human tumors harbor increased PDHK1, a biomarker of decreased patient survival. This study uncovers a PTEN-regulated signaling pathway and reveals PDHK1 as a potential target in PTEN-deficient cancers.

Keywords: NF-κB; NKAP; PDHK1; PTEN; cancer; metabolism; protein phosphatase; signaling; synthetic lethality.


Conflict of interest statement

DECLARATION OF INTERESTS

T.G.B. is an advisor to Array Biopharma, Revolution Medicines, Novartis, AstraZeneca, Takeda, Springworks, and Jazz Pharmaceuticals and receives research funding from Novartis and Revolution Medicines.

Figures

Figure 1.
Figure 1.. PTEN Loss or Inactivation Upregulates PDHK1 in Cancer and Normal Cells
(A) Left: western blots showing PTEN and phospho-AKT expression in PTEN-deficient H1650 cancer cells stably expressing PTEN or empty vector (EV). Right: list of genes significantly upregulated (fold change > 2, multiple t tests, *p < 0.05, q < 0.2, n = 3 replicates) in GFP-expressing H1650 cells compared with H1650 cells stably re-expressing PTEN, by microarray analysis. Highlighted in red boxes are the top upregulated energy metabolism genes, including PDHK1, in H1650-GFP cells. (B) Western blots showing PTEN, phospho-AKT, and PDHK1 expression in PTEN-deficient cancer cell lines stably expressing PTEN or empty vector (EV). (C and D) Same as (B) in PTEN-proficient cancer (C) or normal (non-cancer) (D) cell lines with stable PTEN knockdown. shPTEN, shRNA to PTEN; SC, scrambled control shRNA. See also Figure S1 and Tables S1 and S2.
Figure 2.
Figure 2.. PTEN Loss or Inactivation Induces Cellular Dependence on PDHK1 for Survival
(A and B) Effects of stable PDHK1 knockdown in PTEN-deficient cancer (H1650) (A) or PTEN-proficient cancer (HCC827) and normal (Beas2B) cell lines (B) on cell growth by crystal violet staining assay (left) and apoptosis induction as measured by cleaved PARP levels by immunoblot analysis (right) are shown. shPDHK1#1 and shPDHK1#2, shRNAs to PDHK1; shScramble, scrambled control shRNA. (C) Effects of stable PDHK1 knockdown and adenovirus-based shRNA resistant PDHK1 re-expression in PTEN-deficient H1650 cancer cells on cell growth by crystal violet staining assay (top) or CellTiter-Glo luminescent assay (middle) and apoptosis induction as measured by cleaved PARP levels by immunoblot analysis (bottom) are shown. shPDHK1#1 and shPDHK1#2, shRNAs to PDHK1; SC, scrambled control shRNA. Data are shown as mean ± SEM (n = 8 replicates). *p < 0.05 and ****p < 0.0001; n.s., not significant compared with “scrambled control shRNA expressing PTEN-deficient cells” by Dunn’s multiple-comparisons one-way ANOVA. (D and E) Effects of transient PDHK1 knockdown in PTEN-proficient cancer and normal cell lines with or without stable PTEN knockdown on cell viability by crystal violet staining assay (D) and apoptosis induction as measured by cleaved PARP levels by immunoblotting (E) are shown. siPDHK1, PDHK1 specific small interfering RNAs; sc, scrambled control siRNA; shPTEN, shRNA to PTEN; SC, scrambled control shRNA. Data are shown as mean ± SEM (n = 4 replicates). *p < 0.05, **p < 0.01, and ****p < 0.0001; n.s., not significant compared with “scrambled control siRNA and shRNA expressing PTEN-proficient cells” by Tukey’s multiple-comparisons one-way ANOVA. (F) Effects of stable PDHK1 knockdown in PTEN-deficient cancer cell lines stably expressing PTEN or empty vector (EV) on apoptosis induction as measured by cleaved PARP levels by immunoblotting are shown. shPDHK1, shRNA to PDHK1; SC, scrambled control shRNA. See also Figures S3–S6.
Figure 3.
Figure 3.. PTEN Protein Phosphatase Represses PDHK1 Independent of PI3K/AKT, and PTEN Protein Phosphatase Deficiency Renders PDHK1 Essential for Cell Survival
(A) Real-time qRT-PCR analysis of PDHK1 mRNA expression in PTEN-deficient A2058 cancer cells stably expressing PTENWT or PTENG129E or PTENY138L or GFP. Data are shown as mean ± SD (n = 2 replicates). ****p < 0.0001; n.s., not significant compared with “GFP-expressing PTEN-deficient cells” by Tukey’s multiple-comparisons one-way ANOVA. (B) Western blots showing phospho-AKT and PDHK1 expression in PTEN-deficient cancer cell lines in response to 1 μM BKM-120 (PI3-kinase inhibitor) or vehicle (DMSO) treatment for 24 h. (C) Western blots showing phospho-AKT, phospho-S6(mTOR effector), and PDHK1 expression in PTEN-proficient cancer cell lines expressing empty vector (EV) or myristoylated-AKT (Myr-AKT) to constitutively activate AKT signaling. (D) Effects of pharmacologic inhibition of PDHK1 with DCA (dose response: 5, 10, and 20 mM) in PTEN-deficient cancer cell lines stably expressing PTENW7 or PTENG129E or PTENY138L or GFP on cell growth by crystal violet staining assay are shown, with quantification of cell viability in 20 mM DCA treatment relative to vehicle (water) treatment reported as rescue score (STAR Methods). See also Figure S7.
Figure 4.
Figure 4.. PTEN Protein Phosphatase Represses PDHK1 by Suppressing NF-κB Activation
(A) Top: identification of NF-κB consensus binding site in the promoter of PDHK1 gene located between nucleotide positions 173420479 and 173420488 in chromosome 2, ~300 bp upstream of the transcription start site (TSS; red arrow) at nucleotide position 173420779. Bottom: NF-κB (RELA) recruitment at PDHK1 promoter in PTEN-deficient cancer cells by ChIP assay. Primers (forward and reverse arrows) used to amplify a 118 bp region (spanning nucleotide position 173420380) ~40 bp upstream of the NF-κB binding site in the PDHK1 promoter are shown. Fold enrichment (RELA ChIP DNA [pg] to IgG DNA [pg]) data are shown as mean ± SEM (n = 3 replicates). *p < 0.05 and **p < 0.01 compared with “IgG control” by two-tailed unpaired t test with Welch’s correction. (B) Western blots showing NF-κB (RELA), PDHK1, and phospho-PDHA1 expression in PTEN-deficient cancer cell lines with or without stable RELA knockdown. shRELA, shRNA to RELA. (C) Effects of PTENWT or PTENG129E or PTENY138L or empty vector (EV) expression in PTEN-deficient cancer cell lines on NF-κB activity by luciferase reporter assays (STAR Methods) are shown. Data are shown as mean ± SD (n = 2 replicates). **p < 0.01 and ***p < 0.001 compared with “empty vector control expressing PTEN-deficient cells” by Tukey’s multiple-comparisons one-way ANOVA. (D) Effects of PTENWT or PTENG129E or PTENY138L or GFP expression in PTEN-deficient cancer cell lines on NF-κB (RELA) subcellular localization by nuclear-cytoplasmic fractionation and immunoblotting are shown. Western blots were also probed with anti-LaminB1 and anti-actin β antibodies as nuclear and cytoplasmic markers, respectively. (E) Western blots showing PTEN, phospho-RELA, PDHK1, and phospho-AKT expression in PTEN-deficient cancer cell lines stably expressing PTENWT, PTENG129E, PTEN138L, or GFP. See also Figure S8 and Table S3.
Figure 5.
Figure 5.. PTEN Dephosphorylates NF-κB-Activating Protein (NKAP)
(A) Left: workflow of the unbiased, global phospho-proteomic profiling in PTEN-deficient cancer cell lines stably expressing PTENWT or PTENG129E or PTENY138L or GFP to identify the phospho-peptides (and corresponding proteins) affected specifically by the protein or lipid phosphatase (PP or LP) activity of PTEN. Right: Venn diagram showing the number of proteins with phospho-sites specifically affected by the protein phosphatase activity of PTEN in H1650 (n = 169) and A2058 (n = 248) cells, with the phospho-proteins (including NF-κB-activating protein, NKAP highlighted in white) affected in both cell lines shown in the overlap (n = 42). (B) Schematic representation of NKAP phospho-sites at serines 9 and 149 affected by the protein phosphatase activity of PTEN. (C and D) Phosphate released (μM) from a phospho-S9-NKAP or phospho-S149-NKAP or phospho-S72-Rab7 (control) peptide after incubation without or with recombinant WT PTEN (C) or protein phosphatase mutant Y138L PTEN (D) enzyme in an in vitro malachite green-based colorimetric assay. Data are shown as mean ± SD (n = 2 replicates). *p < 0.05, **p < 0.01, and ****p < 0.0001 compared with “no PTEN” control by two-tailed unpaired t test with Welch’s correction. (E) Detection of phospho-NKAP and its de-phosphorylated species (indicated by the red dotted inset) in PTEN-deficient cancer cell lines stably expressing either PTENWT or PTENG129E or PTENY138L or GFP by Phos-tag PAGE and immunoblotting. De-phosphorylation score indicates the extent to which expression of each PTEN mutant in PTEN-deficient cells suppresses NKAP de-phosphorylation relative to PTENWT (set at 1). A lower de-phosphorylation score indicates less de-phosphorylation of NKAP. (F) Co-immunoprecipitation of NKAP (indicated by the red dotted inset) with PTEN upon overexpression of both NKAP-V5 and FLAG-PTEN and not NKAP-V5 overexpression alone or no overexpression in 293T cells followed by IP-FLAG is shown. Arrowhead denotes NKAP-V5, while the dark band below is background due to secondary antibody cross-reactivity to the immunoglobulin heavy chain (IgH) used in IP. See also Figure S9.
Figure 6.
Figure 6.. Depletion of NKAP Decreases NF-κB Activation and PDHK1 Expression and Induces Synthetic Lethality Specifically upon PTEN Protein Phosphatase Loss
(A and B) Effects of stable NKAP knockdown in PTEN-deficient cancer cell lines on NF-κB activity (A) or PDHK1 promoter activation (B) by luciferase reporter assays (STAR Methods) are shown. shA and shB, shRNAs to NKAP; SC, scrambled control shRNA. Data are shown as mean ± SEM (n = 3 replicates). **p < 0.01, ***p < 0.001, and ****p < 0.0001 compared with “scrambled control shRNA expressing PTEN-deficient cells” by Tukey’s multiple-comparisons one-way ANOVA. (C) Western blots showing NKAP, PDHK1, and phospho-AKT expression in PTEN-deficient cancer cell lines with or without stable NKAP knockdown. shA and shB, shRNAs to NKAP; SC, scrambled control shRNA. (D) Western blots showing HA-NKAP and PDHK1 expression in PTEN-deficient A2058 cancer cells stably expressing empty vector (EV) or wild-type NKAP (HA-NKAPWT) or de-phosphorylation-deficient mutant NKAP (HA-NKAPS9A-S149A). (E and F) Effects of stable NKAP knockdown in PTEN-deficient cancer cell lines without (E) or with stable PTENWT or PTENG129E or PTENY138L or GFP expression (F) on cell growth by crystal violet staining assay are shown, with quantification of cell viability under each condition relative to cells expressing the scrambled control shRNA. shA and shB, shRNAs to NKAP; SC, scrambled control shRNA. (G) Model of cellular survival and energy metabolism regulation specifically by the protein-phosphatase activity of PTEN via a NKAP-NF-κB-PDHK1-driven signaling axis. Loss of the PTEN protein-phosphatase activity promotes NKAP phosphorylation, NF-κB activation, and PDHK1 upregulation, thereby enhancing aerobic glycolysis and rendering PTEN protein-phosphatase deficient cells dependent on NKAP and PDHK1 for survival. See also Figure S10.

References

    1. Aguissa-Touré AH, and Li G (2012). Genetic alterations of PTEN in human melanoma. Cell. Mol. Life Sci. 69, 1475–1491. - PMC - PubMed
    1. Aoki Y, and Kao PN (1997). Cyclosporin A-sensitive calcium signaling represses NFkappaB activation in human bronchial epithelial cells and enhances NFkappaB activation in Jurkat T-cells. Biochem. Biophys. Res. Commun. 234, 424–431. - PubMed
    1. Beltrao P, Albanèse V, Kenner LR, Swaney DL, Burlingame A, Villén J, Lim WA, Fraser JS, Frydman J, and Krogan NJ (2012). Systematic functional prioritization of protein posttranslational modifications. Cell 150, 413–425. - PMC - PubMed
    1. Berger N, Ben Bassat H, Klein BY, and Laskov R (2007). Cytotoxicity of NF-kappaB inhibitors Bay 11-7085 and caffeic acid phenethyl ester to Ramos and other human B-lymphoma cell lines. Exp. Hematol. 35, 1495–1509. - PubMed
    1. Blakely CM, Pazarentzos E, Olivas V, Asthana S, Yan JJ, Tan I, Hrustanovic G, Chan E, Lin L, Neel DS, et al. (2015). NF-κB-activating complex engaged in response to EGFR oncogene inhibition drives tumor cell survival and residual disease in lung cancer. Cell Rep. 11, 98–110. - PMC - PubMed

Publication types

MeSH terms