. 2020 Mar;45(4):675-682.
doi: 10.1038/s41386-019-0499-0. Epub 2019 Aug 28.

Orbitofrontal cortex is selectively activated in a primate model of attentional bias to cocaine cues

Affiliations

Orbitofrontal cortex is selectively activated in a primate model of attentional bias to cocaine cues

Eunha Baeg et al. Neuropsychopharmacology. 2020 Mar.

Abstract

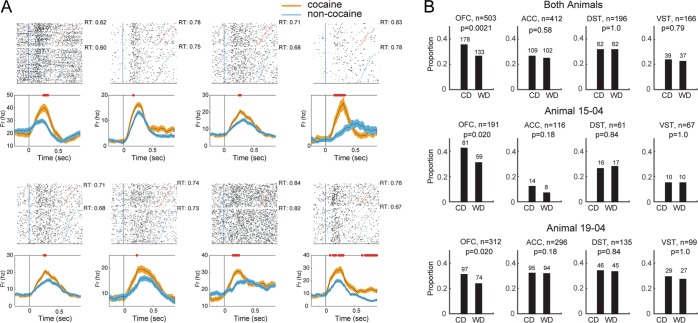
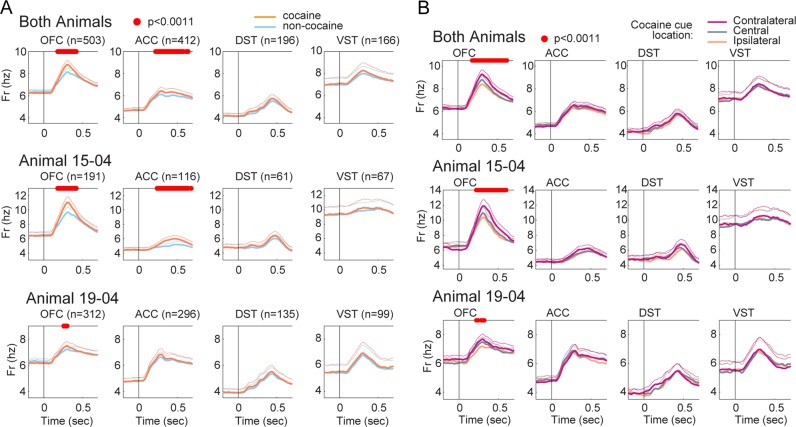
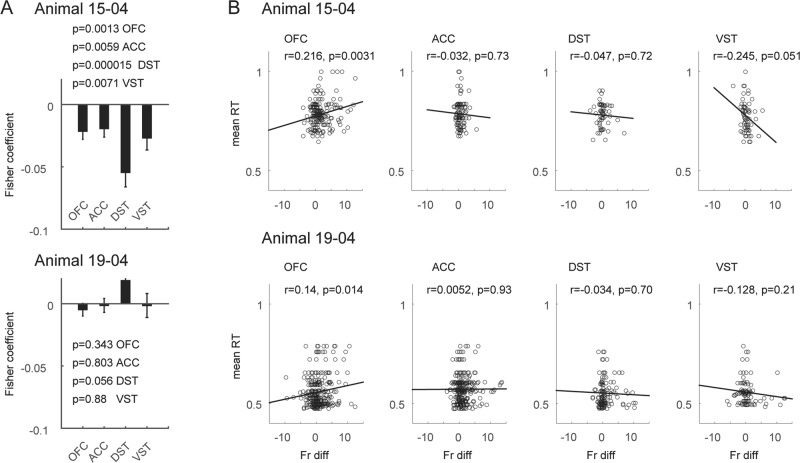
Attentional bias to drug-associated cues correlates with extent of current use, and risk of relapse among those attempting abstinence. Electroencephalogram (EEG) and functional imaging measures in clinical studies have previously investigated the neural basis of attentional bias, but the lack of animal models precluded investigation at the single-unit level. To complement results obtained from clinical studies, we have employed a non-human primate model of attentional bias to cocaine cues while simultaneously recording single-unit activity in cortical and striatal regions implicated in reward processing. Rhesus macaques conditioned to associate particular colors with cocaine or water reward performed an attentional bias task, in which those colors served as irrelevant distractors. Concurrently, multiple electrode arrays for recording single-unit activity were acutely implanted into the orbitofrontal cortex, anterior cingulate cortex, dorsal anterior striatum, and ventral striatum. As in clinical studies, attentional bias was indicated by elongated response times on trials with cocaine-associated distractors compared with trials with water-associated, or control unconditioned distractors. In both animals studied, across an unbiased sample of neurons, the orbitofrontal cortex differentiated distractor condition by the proportion of single-units activated, as well as by population response. In one of the two, the anterior cingulate cortex did as well, but neither striatal region did in either animal. These direct measures of single-unit activity in a primate model complement clinical imaging observations suggesting that cortical mechanisms, especially in orbitofrontal cortex, are likely involved in attentional bias to cocaine-associated environmental cues.


Figures

Fig. 1
Fig. 1
Task structures, behavior, and anatomical placements. a Attentional bias task structure. Touching the black target resulted in water reward. Distractors appeared simultaneously with target, but were irrelevant to task contingency. Locations of target and distractor were pseudo random on each trial. b Cue conditioning (self-administration) task structure. First block provided ten water reward (0.07 ml/kg) trials, second block presented 10 i.v. cocaine reward (0.1 mg/kg) trials. c Bias task accuracy. Animal 15-04 is shown in the left bar for each condition, and 19-04 is shown in the right bar. Comparisons are for both animals combined. Accuracy did not differ by distractor condition. d Bias task response times. Cocaine-associated distractors were associated with elongated response times compared with water and non-associated distractors, *p < 0.05. e Summary of electrode placements for each animal. o, OFC; x, ACC; Δ, VST; □, DST. Depths of electrode placements were calculated based on the position of the cranial cylinder in co-registered MR and CT images
Fig. 2
Fig. 2
Neural encoding of cocaine-associated distractors: single units. a Representative cue encoding neurons from OFC. Top shows rasters for cocaine and non-cocaine trials, with the response time marked in color. Within each cue type, trials are arranged in order of decreasing response time, with mean response time for each set of trials indicated. Peri-event histogram for each neuron is shown below the raster plot (mean +/−  SEM). Red dots are placed at the end of 200 msec windows wherein response differs by paired t test (p < 0.0011, Bonferroni correction p = 0.05/46 windows). b The proportion of single units whose firing rate changed following cue onset differed (by chi-square) for the CD and WD conditions only in OFC. The 200 msec pre-cue baseline period was compared to the period 50–250 msec afer cue onset. Only the CD and WD conditions were compared in order to make the number of trials in each condition equivalent. N indicates the total number of neurons, and the number above each bar indicates the number (out of n) that changed firing rate from baseline
Fig. 3
Fig. 3
Neural encoding of cocaine-associated distractors: population response. a Mean population response in each region (+ SEM) during attentional bias task, showing the significant encoding by OFC in both animals combined, as well as each separately. Red dots are placed at the end of 200 msec windows (stepped at 20 msec), wherein response differs by paired t test (Bonferroni-corrected p < 0.0011). b Spatial encoding of distractor location in OFC. For each panel, the 2 × 3 array shown in Fig. 1 was divided into three by combining the upper and lower positions that were contralateral, ipsilateral, or central, relative to the hemisphere being recorded from. When the distractor is associated with cocaine, there is a significant contralateral hemifield selectivity. Red dots signify end of 200 msec windows, wherein the response differs by paired t test (Bonferroni-corrected p < 0.0011), thin line is + SEM
Fig. 4
Fig. 4
Relationship of firing rate and response time. a For trial by trial analysis, the change in firing rate from baseline (0.5 s prior to stimulus onset) was linearly regressed against the response time for that trial. Each resulting R-value was Fisher transformed, and the mean across all neurons was plotted in each region. The p-value is for comparison of the mean Fisher transformed R with zero. b The session by session relationship of firing rate with response time was determined by regressing the mean change from baseline for each neuron with the mean response time for that session. All correct trial types were used for both a and b

References

    1. Field M, Cox WM. Attentional bias in addictive behaviors: a review of its development, causes, and consequences. Drug Alcohol Depend. 2008;97:1–20. doi: 10.1016/j.drugalcdep.2008.03.030. - DOI - PubMed
    1. Leeman RF, Robinson CD, Waters AJ, Sofuoglu M. A critical review of the literature on attentional bias in cocaine use disorder and suggestions for future research. Exp Clin Psychopharmacol. 2014;22:469–83. - PMC - PubMed
    1. Logothetis NK. What we can do and what we cannot do with fMRI. Nature. 2008;453:869–78. doi: 10.1038/nature06976. - DOI - PubMed
    1. Kim SG, Ogawa S. Biophysical and physiological origins of blood oxygenation level-dependent fMRI signals. J Cereb Blood Flow Metab. 2012;32:1188–206. doi: 10.1038/jcbfm.2012.23. - DOI - PMC - PubMed
    1. Schoenbaum G, Shaham Y. The role of orbitofrontal cortex in drug addiction: a review of preclinical studies. Biol Psychiatry. 2008;63:256–62. doi: 10.1016/j.biopsych.2007.06.003. - DOI - PMC - PubMed

Publication types