. 2019 Aug 27;20(17):4198.
doi: 10.3390/ijms20174198.

N-Heterocyclic Carbene-Platinum Complexes Featuring an Anthracenyl Moiety: Anti-Cancer Activity and DNA Interaction

Affiliations

N-Heterocyclic Carbene-Platinum Complexes Featuring an Anthracenyl Moiety: Anti-Cancer Activity and DNA Interaction

Sébastien Harlepp et al. Int J Mol Sci. .

Abstract

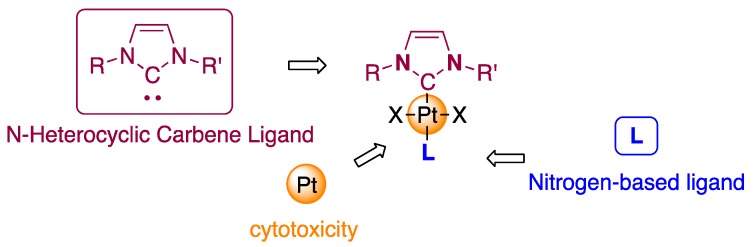
A platinum (II) complex stabilized by a pyridine and an N-heterocyclic carbene ligand featuring an anthracenyl moiety was prepared. The compound was fully characterized and its molecular structure was determined by single-crystal X-ray diffraction. The compound demonstrated high in vitro antiproliferative activities against cancer cell lines with IC50 ranging from 10 to 80 nM. The presence of the anthracenyl moiety on the N-heterocyclic carbene (NHC) Pt complex was used as a luminescent tag to probe the metal interaction with the nucleobases of the DNA through a pyridine-nucleobase ligand exchange. Such interaction of the platinum complex with DNA was corroborated by optical tweezers techniques and liquid phase atomic force microscopy (AFM). The results revealed a two-state interaction between the platinum complex and the DNA strands. This two-state behavior was quantified from the different experiments due to contour length variations. At 24 h incubation, the stretching curves revealed multiple structural breakages, and AFM imaging revealed a highly compact and dense structure of platinum complexes bridging the DNA strands.

Keywords: AFM and optical tweezers microscopy; N-heterocyclic carbene; antitumoral activity; platinum; two-state interaction.


Conflict of interest statement

The authors declare no conflict of interest.

Figures

Figure 1
Figure 1
Chemical structures of platinum N-heterocyclic carbene (NHC) complexes that show high cytotoxic activities against cancer cells.
Figure 2
Figure 2
Molecular structure of the NHC platinum complexes used in this study.
Figure 3
Figure 3
Molecular structure of the platinum complex 1. Selected bond lengths (Å) and angles (°): C(1)-Pt(1), 1.961(1); N(3)-Pt(1), 2.088(3); Pt(1)-I(1), 2.5732(3); Pt(1)-I(2), 2.6013(3); C(1)-Pt(1)-N(3), 174.88(14); C(1)-Pt(1)-I(1); 87.72(10); C(1)-Pt(1)-I(2), 92.03(10); I(1)-Pt(1)-I(2), 172.401(14); N(1)-C(1)-Pt(1)-I(1), −88.3(3); N(2)-C(1)-Pt(1)-I(1), 87.9(3).
Figure 4
Figure 4
(A) DNA–platinum complex force-extension curves evolution at different incubation time. The curves evolve from the raw DNA (black) curve, to short time range around 3 min where DNA length increases (dark blue) before it decreases continuously over longer times (gold, light blue, and red). (B) Raw DNA stretching curve (red) with the modified Marko–Siggia WLC model (black). The adjusting parameters in that case are for the contour length L0 = 2.87 µm and for the persistence length Lp = 40 nm in good agreement with the tabulated values. (C) For more clarity, the fit obtained from the curves represented in the panel A with the same color codes. (D) Contour length of the DNA molecules as a function of time. The length after 3 min is 3.1 µm this length the decreases from 2.7 to 2.24 µm after 29 min of incubation.
Figure 5
Figure 5
DNA length extracted from the atomic force microscopy (AFM) images as a function of platinum complex incubation time. The contour length L increases rapidly after 5 min before a continuous decrease. The image shows the DNA (a) conformations and length at (b) 5, (c) 10, (d) 40 min, and (e) 20 h. The sizes on bottom of the images represent the horizontal full scale of the images represented.
Figure 6
Figure 6
(a) Measurements of the emission spectra after excitation at λ = 368 nm (0.29 mg of 2 were dissolved in 50 µL of DMSO and added to a solution of 1.8 mg of salmon sperm DNA in water (1.950 mL), CPt = 1.34 × 10⁻⁴, (10 base pairs compared to Pt)). (b) Origin or the luminescence upon interaction with DNA (50).
Figure 7
Figure 7
(A) Luminescence studies on the interaction between DNA and platinum. Two ratios were used in this study. The black curves represent the 100 Pt/bp ratio whereas the blue ones represent the 10 Pt/bp ratio. Time evolution is represented by the color gradient that varies from dark to light colors. The time schedule varies as follow darkest curve is 1 min of incubation, then 10, 20, and 30 min are represented. (B) The dots represent the evolution of the normalized maximal intensity obtained on each curve as a function of time. The lines are the normalized chemical model for the intercalation as a function of time and relative concentration. (C) Chemical evolution of the different species in solution as a function of time. (D) Evolution of the contour length as a function of time obtained with the AFM measurements (black dots), the optical tweezers (red squares) and the simulation green line.
Figure 8
Figure 8
Persistence length decrease as a function of time for the optical tweezers (red dots) and AFM (black dots). An exponential adjustment was added on top of the experimental points to help visualization.
Figure 9
Figure 9
(A) DNA molecule incubated 40 min with the platinum compound. Interstrand crosslinks appear after 40 min (arrow). (B) DNA molecule incubated 24 h with the platinum compound. Compact structures appear (white arrows). (C) Successive force-extension curves on the same DNA molecule after 24 h incubation with the platinum compounds.

References

    1. Rosenberg B., Vancamp L., Krigas T. Inhibition of cell division in Escherichia Coli by electrolysis products from a platinum electrode. Nature. 1965;205:698–699. doi: 10.1038/205698a0. - DOI - PubMed
    1. Rosenblum W.I. Erythrocyte Velocity and a Velocity Pulse in Minute Blood Vessels on the Surface of the Mouse Brain. Circ. Res. 1969;24:887–892. doi: 10.1161/01.RES.24.6.887. - DOI - PubMed
    1. Rougier P., Zarba J.J., Ducreux M., Basile M., Pignon J.P., Mahjoubi M., Benahmed M., Droz J.P., Cvitkovic E., Armand J.P. Phase II study of cisplatin and 120-hour continuous infusion of 5-fluorouracil in patients with advanced pancreatic adenocarcinoma. Ann. Oncol. 1993;4:333–336. doi: 10.1093/oxfordjournals.annonc.a058495. - DOI - PubMed
    1. Williams S.D., Stablein D.M., Einhorn L.H., Muggia F.M., Weiss R.B., Donohue J.P., Paulson D.F., Brunner K.W., Jacobs E.M., Spaulding J.T. Immediate adjuvant chemotherapy versus observation with treatment at relapse in pathological stage II testicular cancer. N. Engl. J. Med. 1987;317:1433–1438. doi: 10.1056/NEJM198712033172303. - DOI - PubMed
    1. Alberts D.S., Liu P.Y., Hannigan E.V., O’Toole R., Williams S.D., Young J.A., Franklin E.W., Clarke-Pearson D.L., Malviya V.K., DuBeshter B. Intraperitoneal cisplatin plus intravenous cyclophosphamide versus intravenous cisplatin plus intravenous cyclophosphamide for stage III ovarian cancer. N. Engl. J. Med. 1996;335:1950–1955. doi: 10.1056/NEJM199612263352603. - DOI - PubMed

LinkOut - more resources