. 2019 Aug 28;20(1):447.
doi: 10.1186/s12859-019-2946-7.

Determination of growth-coupling strategies and their underlying principles

Affiliations

Determination of growth-coupling strategies and their underlying principles

Tobias B Alter et al. BMC Bioinformatics. .

Abstract

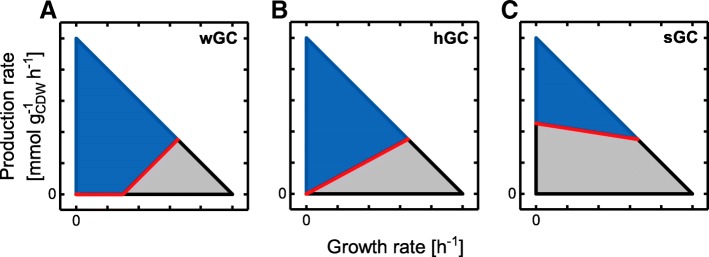
Background: Metabolic coupling of product synthesis and microbial growth is a prominent approach for maximizing production performance. Growth-coupling (GC) also helps stabilizing target production and allows the selection of superior production strains by adaptive laboratory evolution. To support the implementation of growth-coupling strain designs, we seek to identify biologically relevant, metabolic principles that enforce strong growth-coupling on the basis of reaction knockouts.

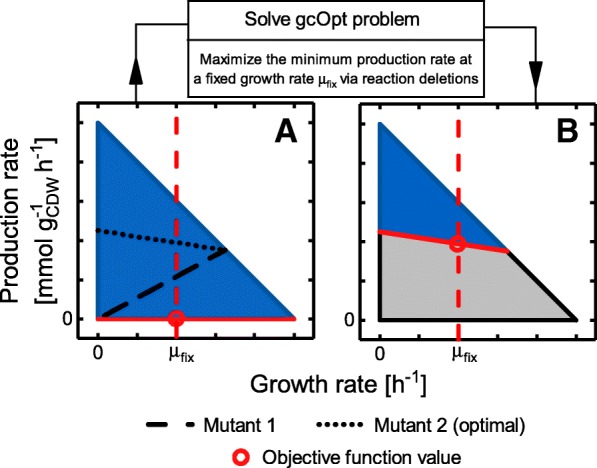
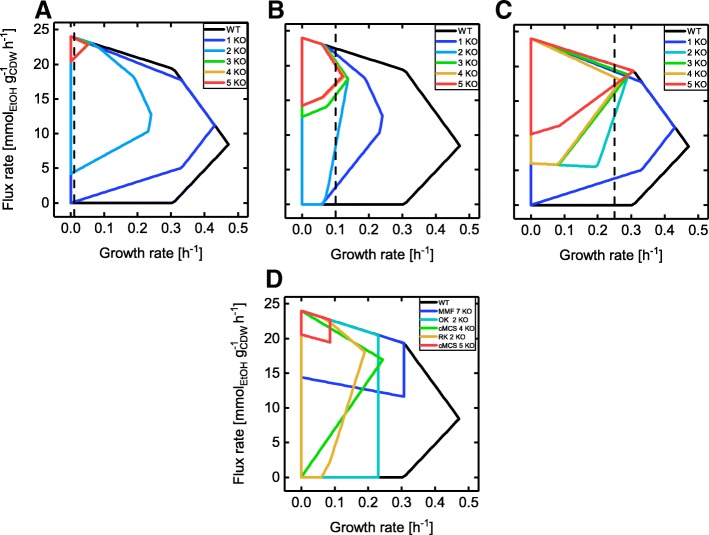
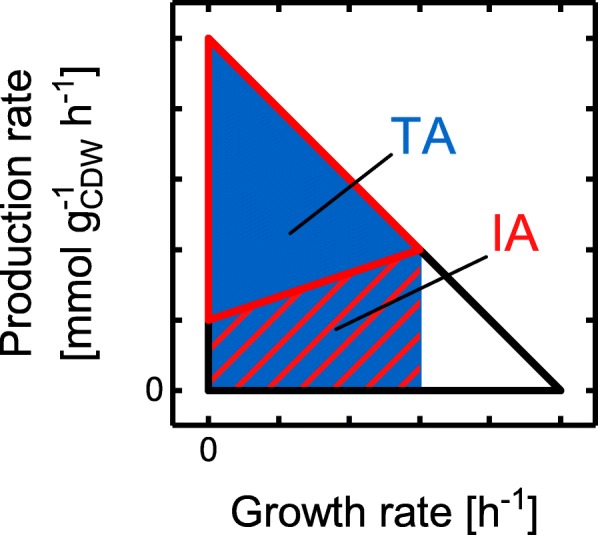
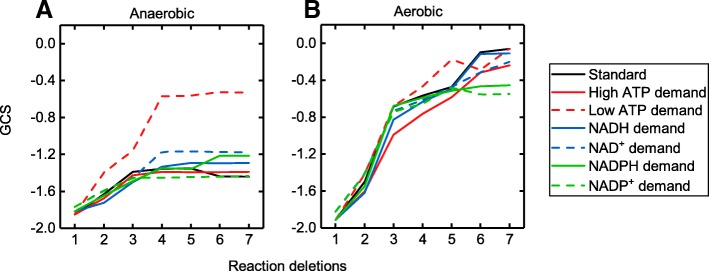
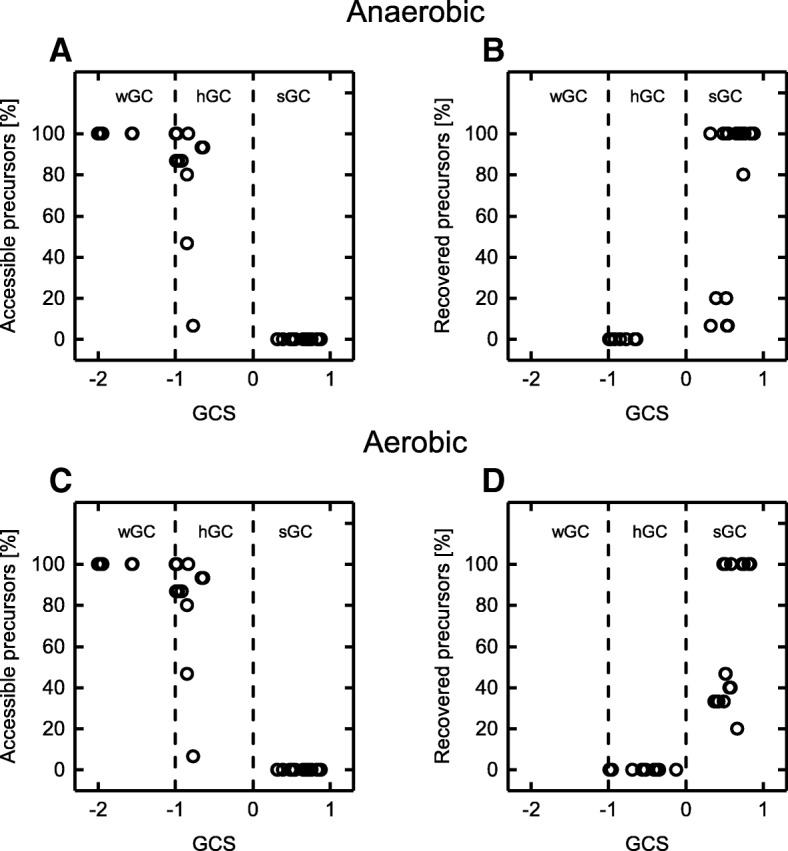
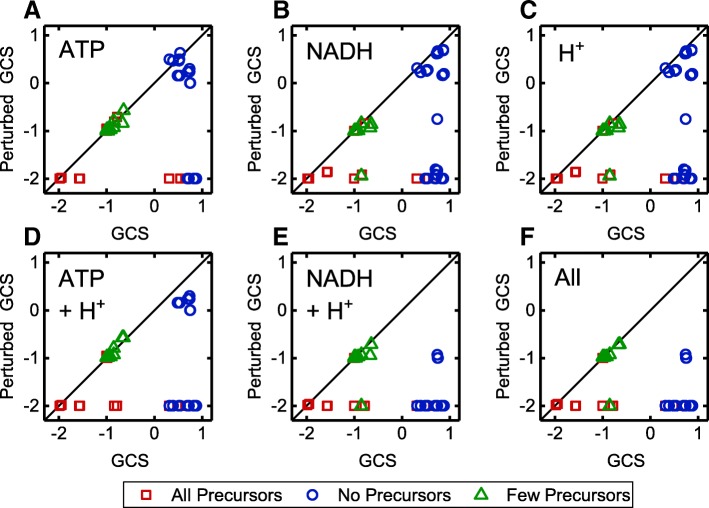
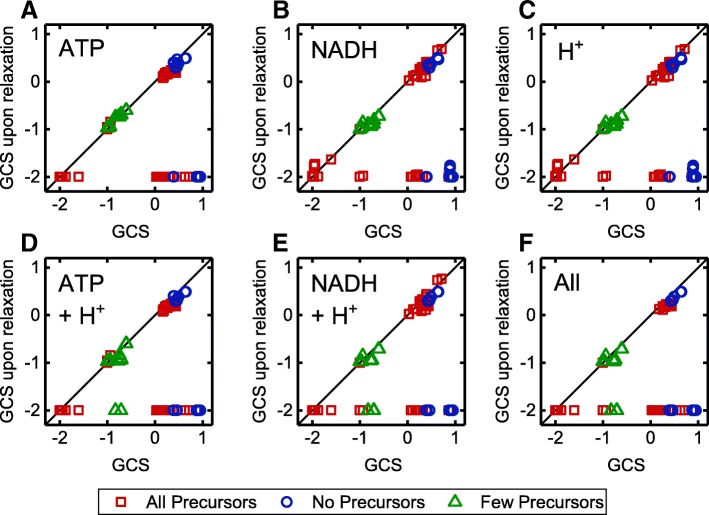
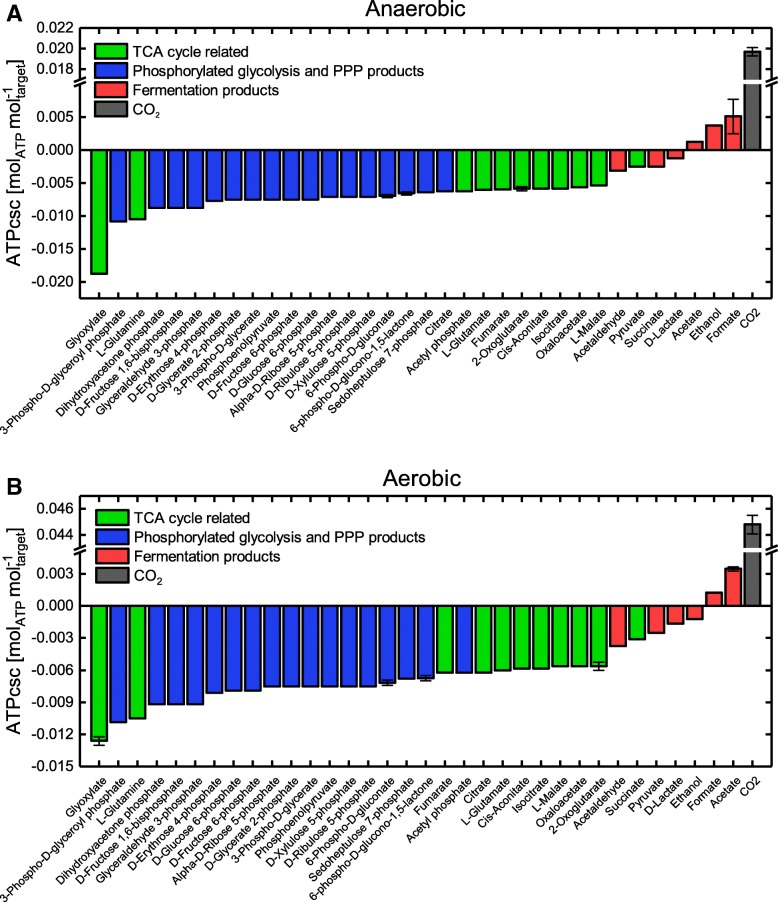
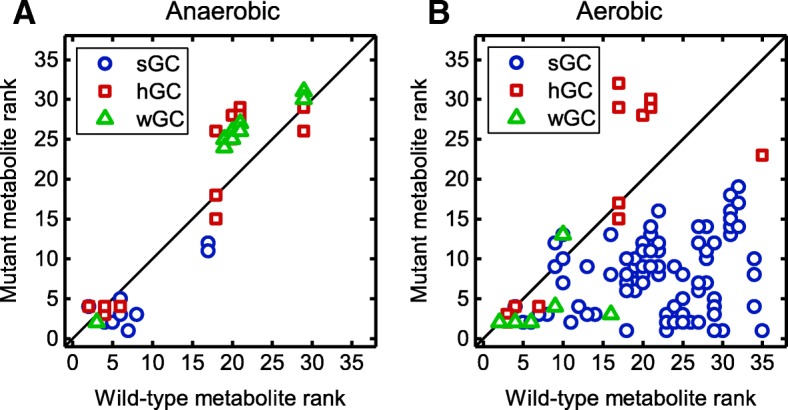
Results: We adapted an established bilevel programming framework to maximize the minimally guaranteed production rate at a fixed, medium growth rate. Using this revised formulation, we identified various GC intervention strategies for metabolites of the central carbon metabolism, which were examined for GC generating principles under diverse conditions. Curtailing the metabolism to render product formation an essential carbon drain was identified as one major strategy generating strong coupling of metabolic activity and target synthesis. Impeding the balancing of cofactors and protons in the absence of target production was the underlying principle of all other strategies and further increased the GC strength of the aforementioned strategies.

Conclusion: Maximizing the minimally guaranteed production rate at a medium growth rate is an attractive principle for the identification of strain designs that couple growth to target metabolite production. Moreover, it allows for controlling the inevitable compromise between growth coupling strength and the retaining of microbial viability. With regard to the corresponding metabolic principles, generating a dependency between the supply of global metabolic cofactors and product synthesis appears to be advantageous in enforcing strong GC for any metabolite. Deriving such strategies manually, is a hard task, due to which we suggest incorporating computational metabolic network analyses in metabolic engineering projects seeking to determine GC strain designs.

Keywords: Bilevel algorithms; Growth-coupled production; Model-guided metabolic engineering; Optimality principles; Stoichiometric modeling.


Conflict of interest statement

The authors declare that they have no competing interests.

Figures

Fig. 1
Fig. 1
Exemplary production envelopes showing three distinct types of GC. a weak, b holistic and c strong growth-coupling. The grey area represents the production envelope of the wild-type strain which is inaccessible for the mutant strain. The lower production rate bound, hence the minimally guaranteed production rate, is marked by the red line
Fig. 2
Fig. 2
Schematic principle of gcOpt. a represents an exemplary production envelope of a wild-type strain showing no GC, with the black dashed and dotted lines denoting the lower production rate bounds of possible mutant strains. The red dashed line denotes the optimization principle of gcOpt, which is maximization of the minimally guaranteed production rate at a medium fixed growth rate. b is a production envelope of a reaction deletion mutant strain showing the best possible GC, where the grey area represents the production envelope of the wild-type strain which is inaccessible for the mutant strain
Fig. 3
Fig. 3
Ethanol production envelopes of GC strain designs identified by gcOpt in comparison to designs taken from literature. Maximal intervention sizes between one and five reaction deletions were used (a-c) and compared to several methods reported in the literature (d) (MMF strategy from [4], all others from [20]). Black lines denote the production envelopes of the wild-type. The vertical black dashed lines mark the chosen fixed growth rates μfix for the respective computations (0.01 h−1 (a), 0.1 h−1 (b) and 0.25 h−1 (c)). The maximal glucose uptake rate was constrained to 12 mmol g−1 h−1 for all respective simulations
Fig. 4
Fig. 4
Illustration of the yield space areas used for calculating GCS. Scheme of a wild-type yield space showing no GC (black hull curve) and a GC strain design (red hull curve). The blue area TA illustrates the yield space of the wild-type up to the maximal growth rate of the mutant strain. The inaccessible yield space IA below the lower yield bound of the mutant is marked by the red hatched area
Fig. 5
Fig. 5
Mean GCS progressions as a function of the number of reaction deletions. GC strain designs were identified by gcOpt for all metabolites of the E. coli iAF1260 core model under anaerobic (a) and aerobic (b) conditions. The different lines embrace independent simulations applying a particular cofactor demand as illustrated by the legend
Fig. 6
Fig. 6
Biomass precursor availabilities for all identified GC strain designs under anaerobic and aerobic conditions. Standard ATPM requirements (a, c) and an unbounded, reversible ATP hydrolysis reaction (b, d) were employed. The vertical dashed lines separate the GCS range into three regions denoting wGC, hGC and sGC
Fig. 7
Fig. 7
GCS of identified strain designs for anaerobic conditions and the corresponding GCS under certain relaxations. Relaxations concern ATPM (a), NADH/NAD conversion (b) and H+ translocation constraints (c) or combinations of those (d-f). The different colors or symbols relate to Fig. 6 showing the accessibility of biomass precursor for the same strain designs is shown. Red squares, blue circles and green triangles symbolize designs that allow for the synthesis of all, no or a reduced number of biomass precursors, respectively
Fig. 8
Fig. 8
GCS of GC strain designs for aerobic conditions and the corresponding GCS under certain relaxations. Relaxations concern ATPM (a), NADH/NAD conversion (b) and H+ translocation constraints (c) or combinations of those (d-f). The different colors or symbols relate to Fig. 6 showing the accessibility of biomass precursor for the same strain designs is shown. Red squares, blue circles and green triangles symbolize designs that allow for the synthesis of all, no or a reduced number of biomass precursors, respectively
Fig. 9
Fig. 9
ATP synthesis capability values normalized by the number of carbon atoms (ATPcsc) for several metabolites of the central carbon metabolism. The E. coli iAF1260 core metabolic model was employed under anaerobic (a) and aerobic (b) conditions using glucose as the sole carbon and energy substrate. The order of the metabolites according to the ATPcsc value depicts the energy hierarchy of metabolites. Error bars denote the standard deviation of ATPcsc calculations at different growth rates spanning the feasible range of growth states. The color code links the metabolites to glycolysis and pentose phosphate pathway (PPP) (blue), TCA cycle (green) and fermentative pathways (red), respectively
Fig. 10
Fig. 10
Rank of target metabolites in the energy hierarchy of energy for wild-type and GC mutant strains. Comparison of the rank of GC target products of the E. coli iAF1260 core model in the energy hierarchy of metabolites of GC mutants and the wild-type under anaerobic (a) and aerobic (b) conditions. The hierarchy is based on the ATPcsc values

References

    1. Nakamura CE, Whited GM. Metabolic engineering for the microbial production of 1,3-propanediol. Curr Opin Biotechnol. 2003;14:454–459. doi: 10.1016/j.copbio.2003.08.005. - DOI - PubMed
    1. Fong SS, Burgard AP, Herring CD, Knight EM, Blattner FR, Maranas CD, et al. In silico design and adaptive evolution of Escherichia coli for production of lactic acid. Biotechnol Bioeng. 2005;91:643–648. doi: 10.1002/bit.20542. - DOI - PubMed
    1. Jantama K, Haupt MJ, Svoronos SA, Zhang X, Moore JC, Shanmugam KT, et al. Combining metabolic engineering and metabolic evolution to develop nonrecombinant strains of Escherichia coli C that produce succinate and malate. Biotechnol Bioeng. 2008;99:1140–1153. doi: 10.1002/bit.21694. - DOI - PubMed
    1. Trinh CT, Unrean P, Srienc F. Minimal Escherichia coli cell for the most efficient production of ethanol from hexoses and pentoses. Appl Environ Microbiol. 2008;74:3634–3643. doi: 10.1128/AEM.02708-07. - DOI - PMC - PubMed
    1. Jiang L-Y, Chen S-G, Zhang Y-Y, Liu J-Z. Metabolic evolution of Corynebacterium glutamicum for increased production of L-ornithine. BMC Biotechnol. 2013;13:47. doi: 10.1186/1472-6750-13-47. - DOI - PMC - PubMed

MeSH terms

LinkOut - more resources