. 2019 Aug 28;11(507):eaav3879.
doi: 10.1126/scitranslmed.aav3879.

Inhaled corticosteroid suppression of cathelicidin drives dysbiosis and bacterial infection in chronic obstructive pulmonary disease

Affiliations

Inhaled corticosteroid suppression of cathelicidin drives dysbiosis and bacterial infection in chronic obstructive pulmonary disease

Aran Singanayagam et al. Sci Transl Med. .

Abstract

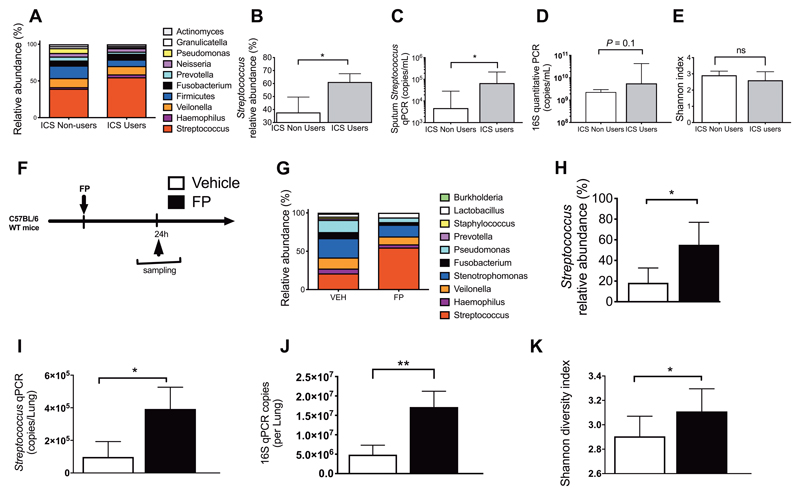
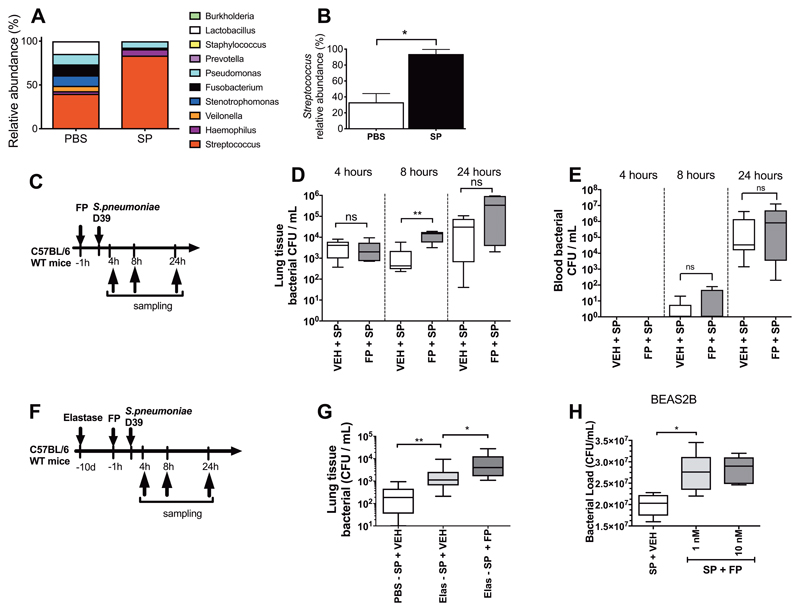
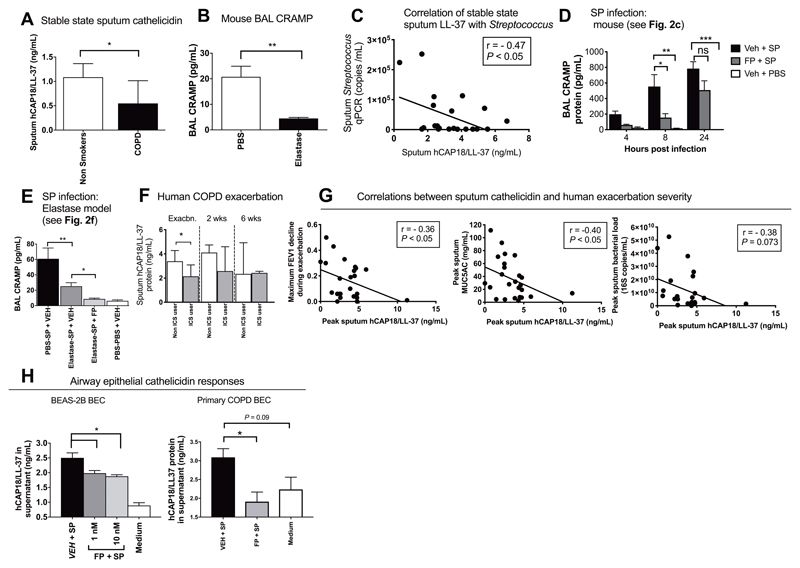
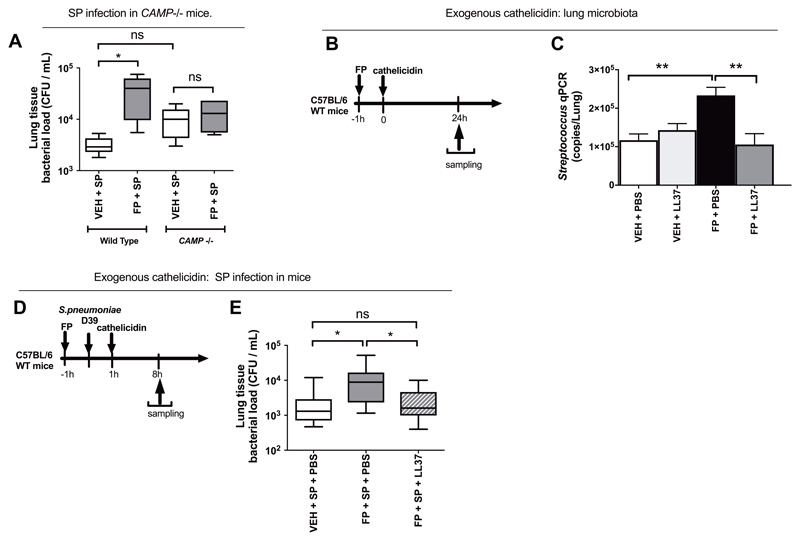
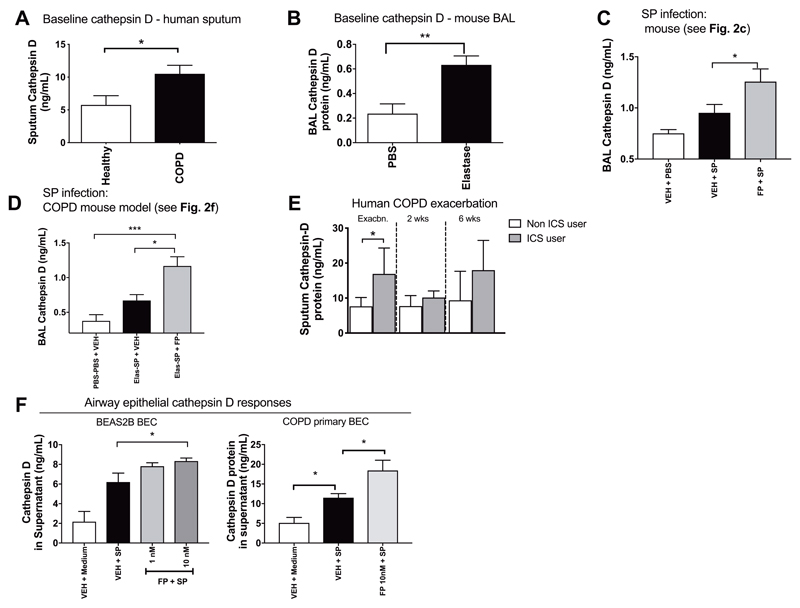
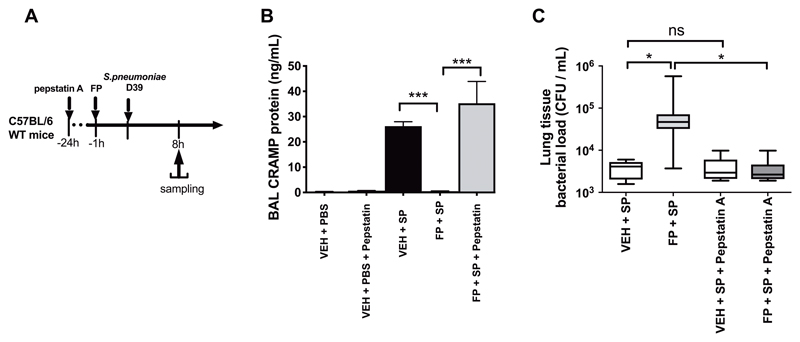
Bacterial infection commonly complicates inflammatory airway diseases such as chronic obstructive pulmonary disease (COPD). The mechanisms of increased infection susceptibility and how use of the commonly prescribed therapy inhaled corticosteroids (ICS) accentuates pneumonia risk in COPD are poorly understood. Here, using analysis of samples from patients with COPD, we show that ICS use is associated with lung microbiota disruption leading to proliferation of streptococcal genera, an effect that could be recapitulated in ICS-treated mice. To study mechanisms underlying this effect, we used cellular and mouse models of streptococcal expansion with Streptococcus pneumoniae, an important pathogen in COPD, to demonstrate that ICS impairs pulmonary clearance of bacteria through suppression of the antimicrobial peptide cathelicidin. ICS impairment of pulmonary immunity was dependent on suppression of cathelicidin because ICS had no effect on bacterial loads in mice lacking cathelicidin (Camp -/-) and exogenous cathelicidin prevented ICS-mediated expansion of streptococci within the microbiota and improved bacterial clearance. Suppression of pulmonary immunity by ICS was mediated by augmentation of the protease cathepsin D. Collectively, these data suggest a central role for cathepsin D/cathelicidin in the suppression of antibacterial host defense by ICS in COPD. Therapeutic restoration of cathelicidin to boost antibacterial immunity and beneficially modulate the lung microbiota might be an effective strategy in COPD.


Conflict of interest statement

Competing interests relevant to manuscript: S.L.J. has personally received consultancy fees from Myelo Therapeutics GmbH, Concert Pharmaceuticals, Bayer, and Sanofi Pasteur, and Aviragen; he and his institution received consultancy fees from Synairgen, Novartis, Boehringer Ingelheim, Chiesi, GlaxoSmithKline, and Centocor. S.L.J. is an inventor on patents on the use of inhaled interferons for treatment of exacerbations of airway diseases (Interferon-beta therapy for anti-virus therapy for respiratory diseases. International Patent Application No. PCT/GB05/50031 and Interferon-Lambda therapy for treatment of respiratory disease UK Patent application No. 6779645.9). M.A.C. was employed by Chiesi Pharmaceuticals from January 2015 to November 2017. The remaining authors declare no competing interests.

Figures

Figure 1
Figure 1. Inhaled corticosteroids alter the lower respiratory tract microbiota inducing proliferation of Streptococcus genera.
(A-E) Evaluation of the lung microbiota in sputum samples from patients with COPD (n=10 ICS users and n=13 ICS non-users). (a) Relative abundance of the top ten operational taxonomic units (OTUs) in ICS users and non-users. (B) Relative abundance of Streptococcus (C) Streptococcus qPCR copies (D) total bacterial loads assessed by 16S qPCR and (E) Shannon diversity index in sputum samples from ICS users versus non-users. (F) Experimental outline. C57BL/6 mice were treated intranasally with 20ug fluticasone propionate or vehicle control. Lung tissue was harvested at 24 hours post-administration and lung microbiota was evaluated by 16S rRNA sequencing. (G) Relative abundance of the top ten operational taxonomic units (OTUs) in FP and vehicle treated mice. (H) Relative abundance of Streptococcus (I) Streptococcus qPCR copies (J) total bacterial loads assessed by 16S qPCR and (K) Shannon diversity index in FP and vehicle control treated mice. In (f)-(k) experiments comprise n=6-8 mice/group. Data shown as median (+/- IQR) and analyzed using Mann Whitney U test. n.s. non-significant *p<0.05 **p<0.01 ***p<0.001.
Figure 2
Figure 2. Fluticasone propionate impairs pulmonary clearance of Streptococcus pneumoniae.
(A-B) Lung microbiota was evaluated by 16S rRNA sequencing in lung tissue from mice challenged with S. pneumoniae (SP) and PBS treated controls at 8 hours post-challenge. (A) Relative abundance of the top ten operational taxonomic units (OTUs) (B) Relative abundance of Streptococcus. (C) Experimental outline. C57BL/6 mice were treated with 20ug FP or vehicle DMSO control and additionally infected with S. pneumoniae D39. Bacterial loads in (D) lung tissue and (E) blood were measured at the indicated timepoints post-infection by quantitative culture. (F) Experimental outline. C57BL/6 mice were treated intranasally with a single dose of elastase or PBS as control. Ten days later, mice were treated intranasally with fluticasone propionate (20μg) or vehicle DMSO control and challenged with S. pneumoniae D39. (G) Bacterial loads were measured at 8 hours post-infection. (H) BEAS-2B cells were treated with 1 or 10nM fluticasone propionate, stimulated with S. pneumoniae D39 and bacterial loads were measured in cell supernatants by quantitative culture at 24 hours post-infection. Bacterial load data are displayed as box and whisker plots showing median (line within box), IQR (box) and minimum to maximum (whiskers). Experiments comprise n=6-8 mice/group, representative of at least two independent experiments. Data analyzed using Mann Whitney U test or one-way ANOVA with Bonferroni post-test. n.s. non-significant *p<0.05 **p<0.01 ***p<0.001.
Figure 3
Figure 3. Cathelicidin responses to bacterial infection are impaired by inhaled corticosteroid and negatively correlate with COPD exacerbation severity.
(A) Stable state sputum hCAP18/LL-37 concentrations were measured in 37 subjects with COPD (GOLD stage 0-II) and 19 healthy control subjects by ELISA. (B) Cathelicidin-related anti-microbial peptide (CRAMP) concentrations were measured in mice at 10 days following intranasal treatment with 1.2 units of porcine pancreatic elastase or PBS control. (C) Correlation between sputum hCAP18/LL-37 and Streptococcal qPCR copies in 23 subjects with COPD. (D) C57BL/6 mice were treated intranasally with fluticasone propionate (20μg) or vehicle DMSO control and challenged intranasally with S. pneumoniae D39. CRAMP concentrations in BAL were measured by ELISA at the indicated timepoints. (E) C57BL/6 mice were treated intranasally with porcine pancreatic elastase or PBS control. Ten days later, mice were treated intranasally with fluticasone propionate, challenged with S.pneumoniae D39 and CRAMP concentrations in BAL measured at 8 hours post-infection. (F) Subjects with COPD (n=27) were monitored prospectively and sputum samples taken during exacerbation. Sputum hCAP18/LL-37 concentrations were measured by ELISA at the indicated timepoints. (G) Correlation between sputum hCAP18/LL-37 and FEV1 decline, sputum MUC5AC concentrations and sputum bacterial loads. (H, left) BEAS-2B cells were treated with 1 or 10nM fluticasone propionate, stimulated with S. pneumoniae D39 and hCAP18/LL-37 concentrations in cell supernatants were measured at 8 hours by ELISA. (h, right) Primary bronchial epithelial cells from 6 subjects with COPD were cultured, treated with 10nM FP, stimulated ex vivo with S. pneumoniae and hCAP18/LL-37 concentrations in cell supernatants were measured at 8 hours. In panels (B), (D), (E) and (H) data shown as mean (+/- sem) and analyzed by one-way ANOVA with Bonferroni’s post-test. For human sputum analyses in (A) and (F) data are shown as median (IQR) and analyzed by Mann Whitney U test. In (C) and (G), correlation analysis used was nonparametric (Spearman’s correlation). Animal experiments comprise n=5-8 mice/group, representative of at least two independent experiments. BEAS2B experiments comprise n=4 independent experiments. n.s. non-significant *p<0.05 **p<0.01 ***p<0.001
Figure 4
Figure 4. Impairment of pulmonary immunity by fluticasone propionate is dependent on cathelicidin.
(A) Wild type or CAMP -/- C57BL/6 mice were treated with 20ug fluticasone propionate or vehicle DMSO control and challenged intranasally with S. pneumoniae D39. Lung bacterial loads were measured by quantitative culture at 8h post-infection (B) Experimental outline. C57BL/6 mice were treated intranasally with 20ug fluticasone propionate or vehicle control and additionally with 10 ug recombinant LL-37. Lung tissue was harvested at 24h post-administration. (C) Lung Streptococcus was measured by qPCR (D) Experimental outline. C57BL/6 mice were treated intranasally with 20ug fluticasone propionate or vehicle DMSO control, challenged with S. pneumoniae D39 and additionally treated with 10 ug recombinant LL-37. Lung tissue was harvested at 8h post-administration. (E) Lung bacterial loads measured by quantitative culture. Data in (C) shown as mean (+/- S.E.M). Bacterial load data displayed as box and whisker plots showing median (line within box), IQR (box) and minimum to maximum (whiskers). Animal experiments comprise n=5-10 mice/group, representative of at least two independent experiments. Data analyzed by one-way ANOVA with Bonferroni post-test. n.s. non-significant *p<0.05 **p<0.01.
Figure 5
Figure 5. Airway cathepsin D is increased in COPD and further enhanced by inhaled corticosteroid administration during bacterial infection.
(A) Stable state sputum cathepsin D concentrations were measured in 37 subjects with COPD (GOLD stage 0-II) and 19 healthy control subjects by ELISA. (B) Cathepsin D concentrations were measured in mice at 10 days following intranasal treatment with 1.2 units of porcine pancreatic elastase or PBS control. (C) C57BL/6 mice were treated intranasally with fluticasone propionate (20μg) or vehicle DMSO control and challenged with S. pneumoniae D39. Cathepsin D concentrations in BAL were measured by ELISA at 8 hours post-infection. (D) C57BL/6 mice were treated intranasally with porcine pancreatic elastase or PBS control. Ten days later, mice were treated intranasally with fluticasone propionate, challenged with S.pneumoniae D39 and cathepsin D concentrations in BAL measured at 8 hours post-infection. (E) Subjects with COPD (n=27) were monitored prospectively and sputum samples taken during exacerbation. Sputum cathepsin-D concentrations were measured by ELISA at the indicated timepoints. (F, left) BEAS-2B cells were treated with 1 or 10nM fluticasone propionate, stimulated with S. pneumoniae D39 and cathepsin D concentrations in cell supernatants were measured at 8 hours. (F, right) Primary airway epithelial cells from 6 subjects with COPD were cultured, treated with 10nM FP, stimulated ex vivo with S. pneumoniae and cathepsin D concentrations in cell supernatants were measured at 8 hours. In panels (B)-(D) and (F) data shown as mean (+/- sem) and analyzed by one-way ANOVA with Bonferroni’s post-test. For human sputum analyses in (A) and (E), data are shown as median (IQR) and analyzed by Mann Whitney U test. Animal experiments comprise n=6-8 mice/group, representative of at least two independent experiments. n.s. non-significant *p<0.05 **p<0.01 ***p<0.001.
Figure 6
Figure 6. Inhibition of cathepsin D reverses FP-mediated suppression of cathelicidin and restores lung bacterial control.
(A) Experimental outline. C57BL/6 mice were treated with 60mg/kg intraperitoneal pepstatin-A, 24 hours prior to intranasal treatment with 20μg fluticasone propionate or vehicle control and challenge with S. pneumoniae D39. (B) CRAMP concentrations in BAL were measured by ELISA at 8h post-infection. (C) Lung bacterial loads were measured by quantitative culture at 8 hours post-infection. Data in (B) shown as mean (+/- S.E.M). Bacterial load data in (C) displayed as box and whisker plots showing median (line within box), IQR (box) and minimum to maximum (whiskers). Animal experiments comprise n=8-10 mice/group, representative of at least two independent experiments. Data analyzed by one-way ANOVA with Bonferroni post-test. n.s. non-significant *p<0.05 **p<0.01 ***p<0.001.

References

    1. Patel IS, Seemungal TA, Wilks M, Lloyd-Owen SJ, Donaldson GC, Wedzicha JA. Relationship between bacterial colonisation and the frequency, character, and severity of COPD exacerbations. Thorax. 2002 Sep;57:759. - PMC - PubMed
    1. Sethi S, Evans N, Grant BJ, Murphy TF. New strains of bacteria and exacerbations of chronic obstructive pulmonary disease. The New England journal of medicine. 2002 Aug 15;347:465. - PubMed
    1. Gomez-Junyent J, Garcia-Vidal C, Viasus D, Millat-Martinez P, Simonetti A, Santos MS, Ardanuy C, Dorca J, Carratala J. Clinical features, etiology and outcomes of community-acquired pneumonia in patients with chronic obstructive pulmonary disease. PloS one. 2014;9:e105854. - PMC - PubMed
    1. Seemungal TA, Donaldson GC, Paul EA, Bestall JC, Jeffries DJ, Wedzicha JA. Effect of exacerbation on quality of life in patients with chronic obstructive pulmonary disease. American journal of respiratory and critical care medicine. 1998 May;157:1418. - PubMed
    1. Donaldson GC, Seemungal TA, Bhowmik A, Wedzicha JA. Relationship between exacerbation frequency and lung function decline in chronic obstructive pulmonary disease. Thorax. 2002 Oct;57:847. - PMC - PubMed

Publication types

MeSH terms