

doi: 10.1038/s41375-019-0557-y.
Epub 2019 Aug 28.
BCR signaling contributes to autophagy regulation in chronic lymphocytic leukemia
Affiliations
- PMID: 31462734
- PMCID: PMC6995694
- DOI: 10.1038/s41375-019-0557-y
Item in Clipboard
BCR signaling contributes to autophagy regulation in chronic lymphocytic leukemia
Leukemia.
2020 Feb.
No abstract available
Conflict of interest statement
The authors declare that they have no conflict of interest.
Figures
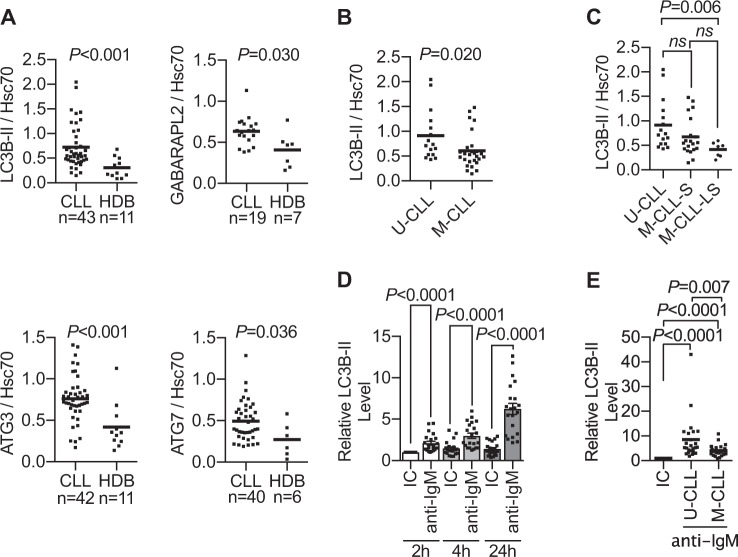
Characterization of autophagy-marker protein levels at baseline and following BCR engagement. a Protein was extracted from snap-frozen PBMCs isolated from CLL patients or HDB purified by negative selection. The level of LC3B-II (n = 43), GABARAPL2 (n = 19), ATG3 (n = 42), and ATG7 (n = 40) was quantified by immunoblotting and normalized protein levels relative to the Hsc70 loading control are shown. Mean values are indicated. A Mann–Whitney test was used for statistical analysis. b Basal LC3B-II protein levels in CLL samples (n = 43) divided by IGHV mutational status into mutated (M-CLL) and unmutated (U-CLL) cases, and (c) BCR signaling capacity defined by U-CLL, M-CLL signallers (M-CLL-S) (>5% iCa2+ flux), and M-CLL low signallers (M-CLL-LS) (≤5% iCa2+ flux). Mean values are indicated. A Mann–Whitney test was used for statistical analysis. d CLL samples were treated with bead-bound isotype control antibody (IC), anti-IgM, or anti-IgD for 2, 4, or 24 h, and the level of LC3B-II (n = 21) assessed by immunoblotting. Blots were quantified and the mean fold change (±SEM) in the level of LC3B-II with anti-IgM normalized to the IC at 2 h is shown. A Wilcoxon’s matched-pairs signed-rank test was used for statistical analysis. e A larger cohort of patient samples (n = 45) were treated with bead-bound anti-IgM for 24 h and LC3B-II levels divided according to IGHV status into M-CLL and U-CLL as previously described. Mean values are indicated. A Mann–Whitney test was used for statistical analysis
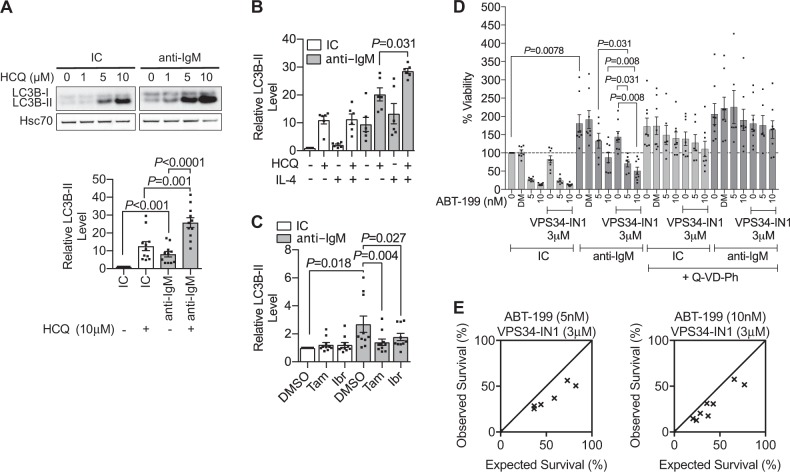
BCR-mediated autophagy is dependent on BCR signaling and provides a survival advantage to CLL cells. a CLL samples (n = 11) were treated with bead-bound isotype control antibody (IC) or anti-IgM with or without HCQ at indicated concentrations for 24 h and LC3B-II levels evaluated by immunoblotting. A representative immunoblot is shown. Blots were quantified and the mean fold change (±SEM) in LC3B-II level with each treatment vs. IC without HCQ is shown in the accompanying graph. A t-test was used for statistical analysis. b CLL samples (n = 6) were treated with or without IL-4 (10 ng/ml), in the presence or absence of HCQ, for 24 h before treatment with bead-bound IC or anti-IgM for 24 h. LC3B-II levels were evaluated by immunoblotting and the mean fold change (±SEM) in LC3B-II levels with each treatment vs. IC without HCQ is shown. A Wilcoxon’s matched-pairs signed-rank test was used for statistical analysis. c CLL samples (n = 10) were treated with HCQ and a SYK (tamatinib; Tam) or BTK (ibrutinib; Ibr) inhibitor (both 5 μM) for 1 h before stimulation with bead-bound IC or anti-IgM for 24 h and the LC3B-II level evaluated by immunoblotting. Hsc70 was used as a loading control. A representative immunoblot is shown. Blots were quantified and the mean fold change (±SEM) in LC3B-II level with each treatment vs. IC DMSO is shown in the accompanying graph. A Wilcoxon’s matched-pairs signed-rank test was used for statistical analysis. d CLL samples were treated for 6 h with bead-bound IC or anti-IgM before treatment with autophagy inhibitor, VPS34-IN1 (3 μM), either alone or in combination with venetoclax (5 nM n = 6, or 10 nM n = 8 where shown) for 24 h. All conditions were carried out with or without Q-VD-Ph (10 μM) to identify caspase-dependent drug-mediated cell killing. Cell viability was assessed by the CellTiter-Glo Cell Viability Assay. The mean (+SEM) percentage of viable cells relative to IC is shown. A Wilcoxon’s matched-pairs signed-rank test was used for statistical analysis. e Synergy between VPS34-IN1 (3 μM) and venetoclax (5 nm, left and 10 nM, right) was evaluated as detailed in the Supplementary Materials and Methods. XY line, observed survival = expected survival. Points below the line, synergistic interactions; points above the line, additive interactions
References
Publication types
MeSH terms
Substances
Grants and funding
LinkOut - more resources
Full Text Sources
Other Literature Sources
