. 2019 Aug;572(7771):603-608.
doi: 10.1038/s41586-019-1487-6. Epub 2019 Aug 28.

Metastatic-niche labelling reveals parenchymal cells with stem features

Affiliations

Metastatic-niche labelling reveals parenchymal cells with stem features

Luigi Ombrato et al. Nature. 2019 Aug.

Erratum in

Abstract

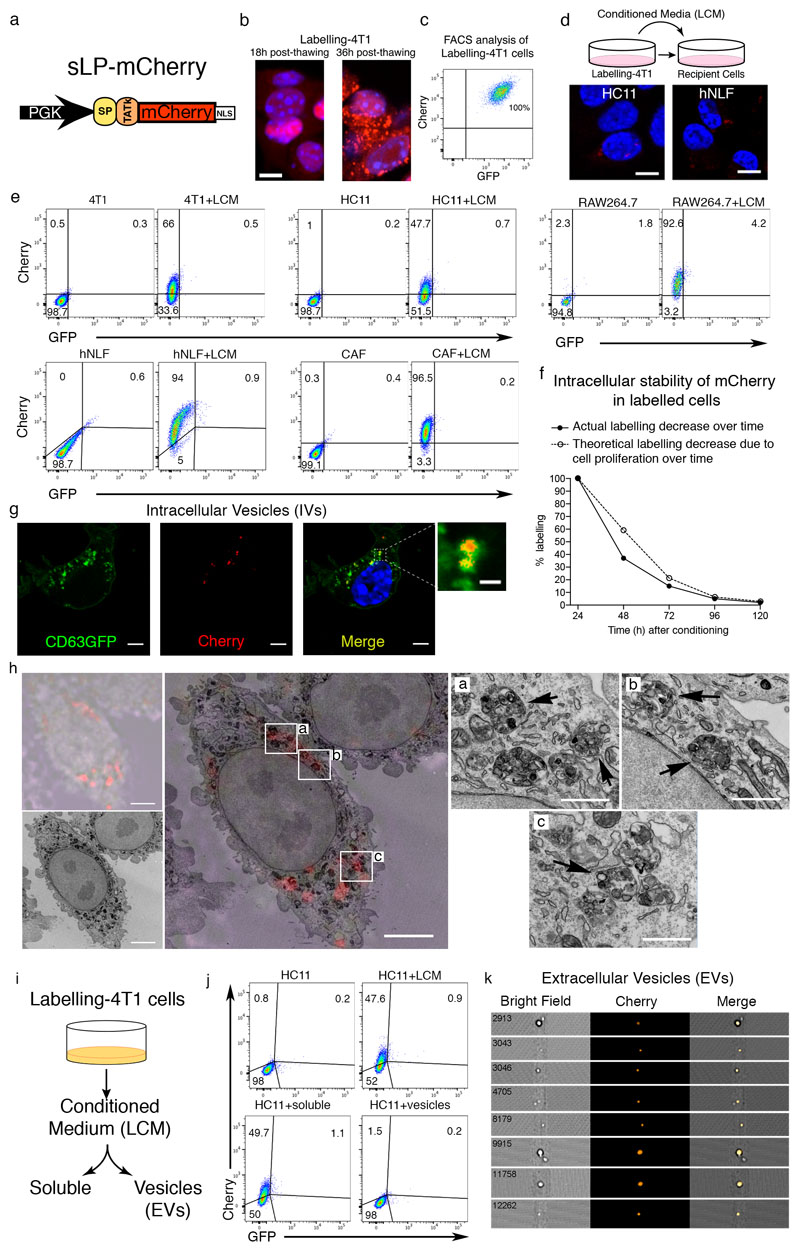
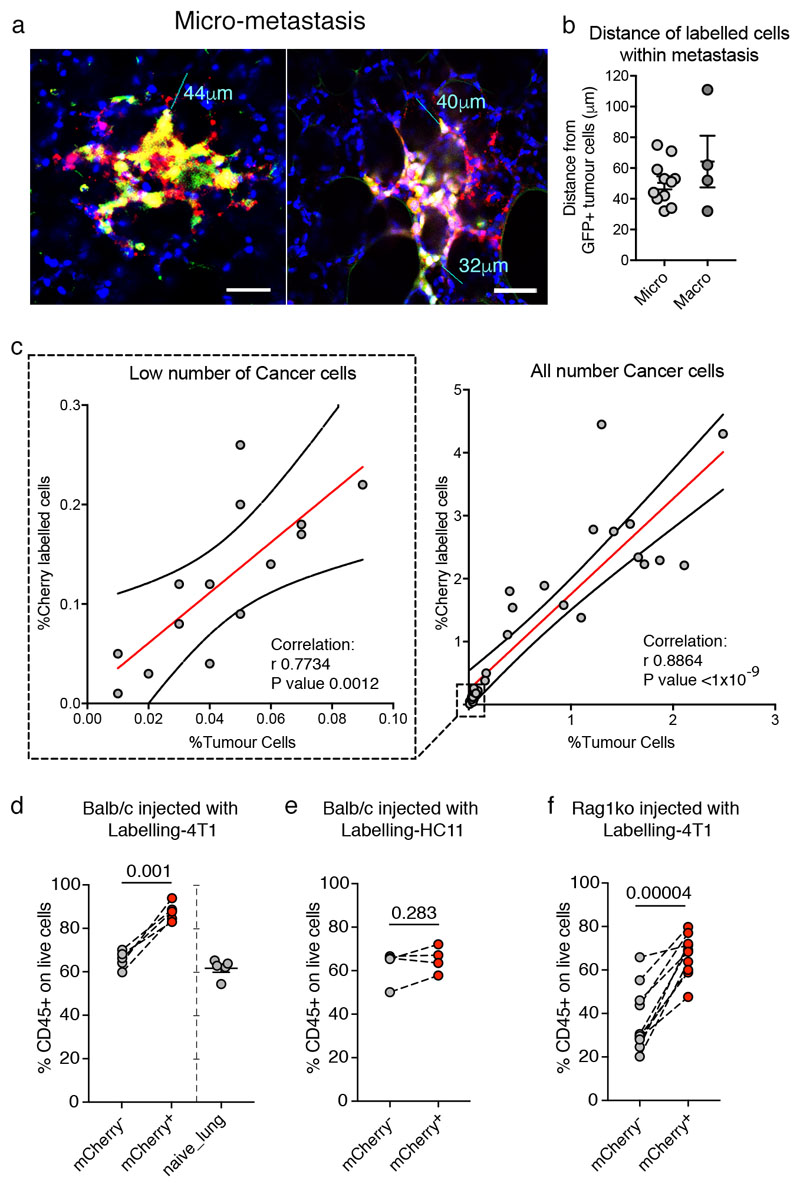
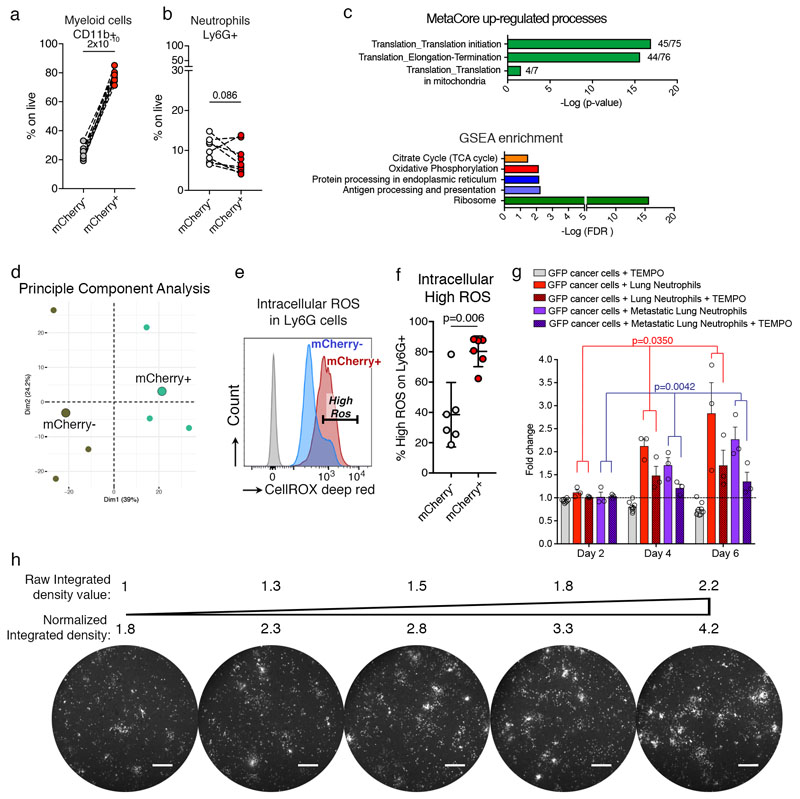
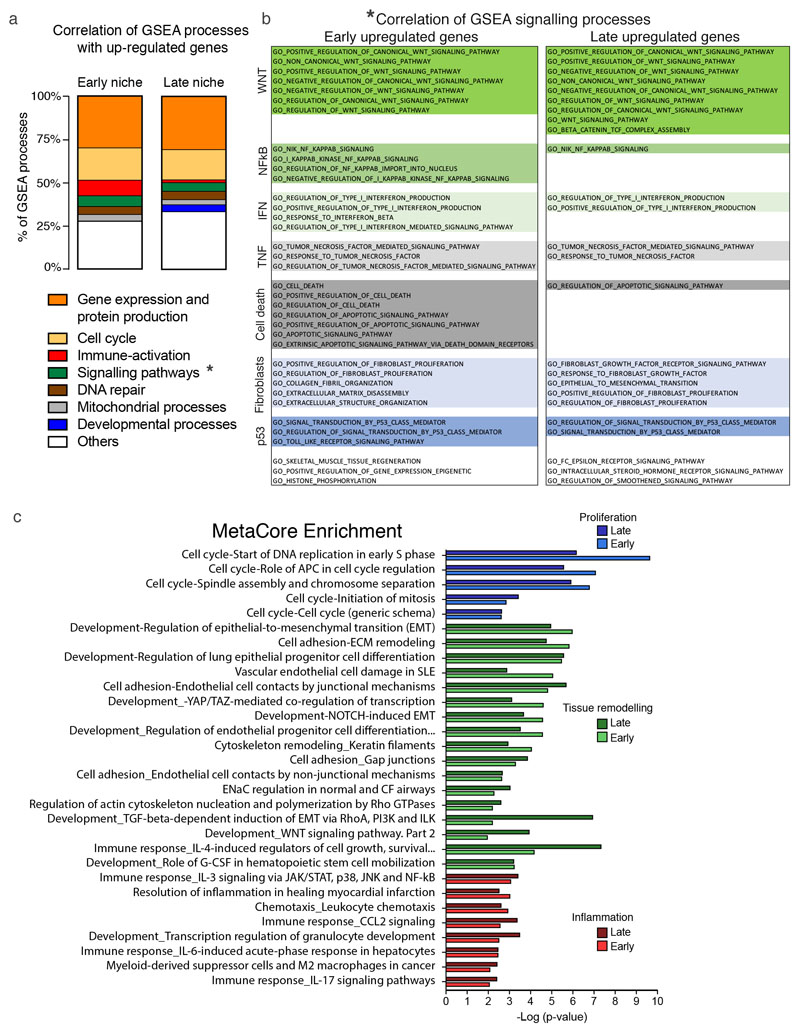
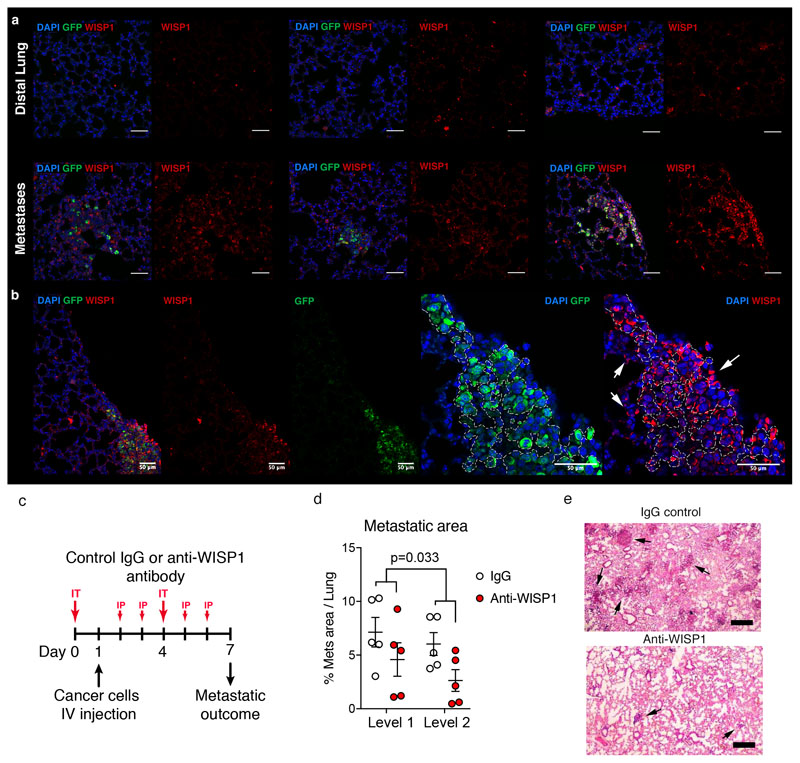
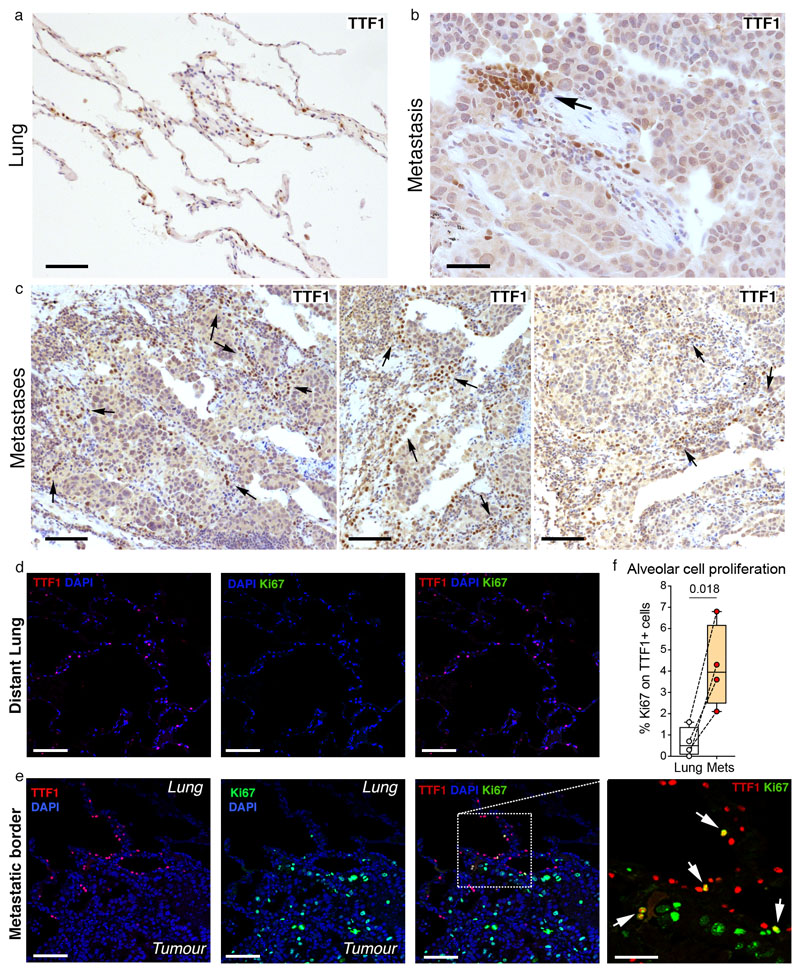
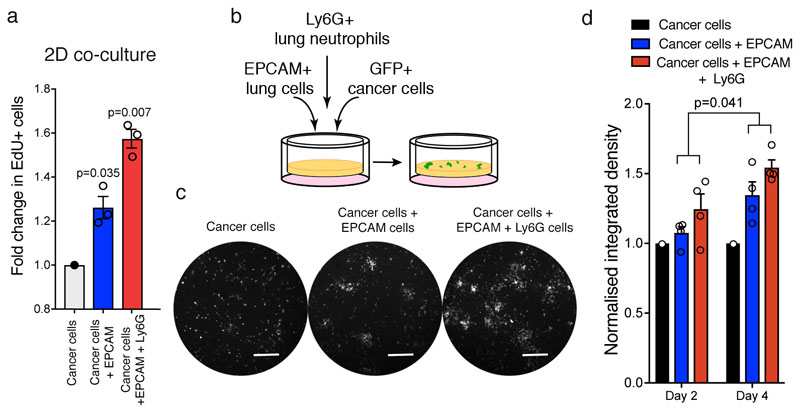
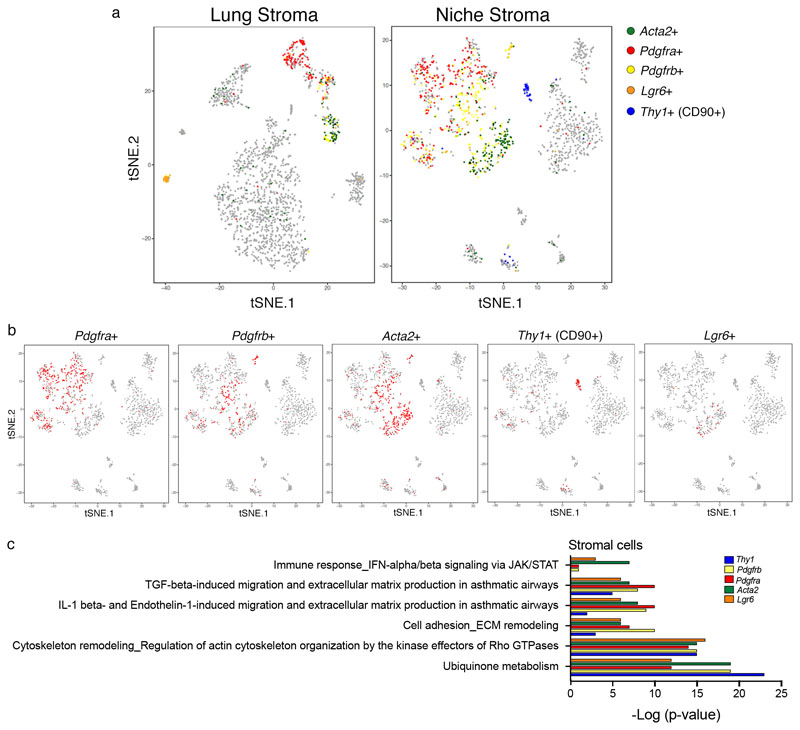
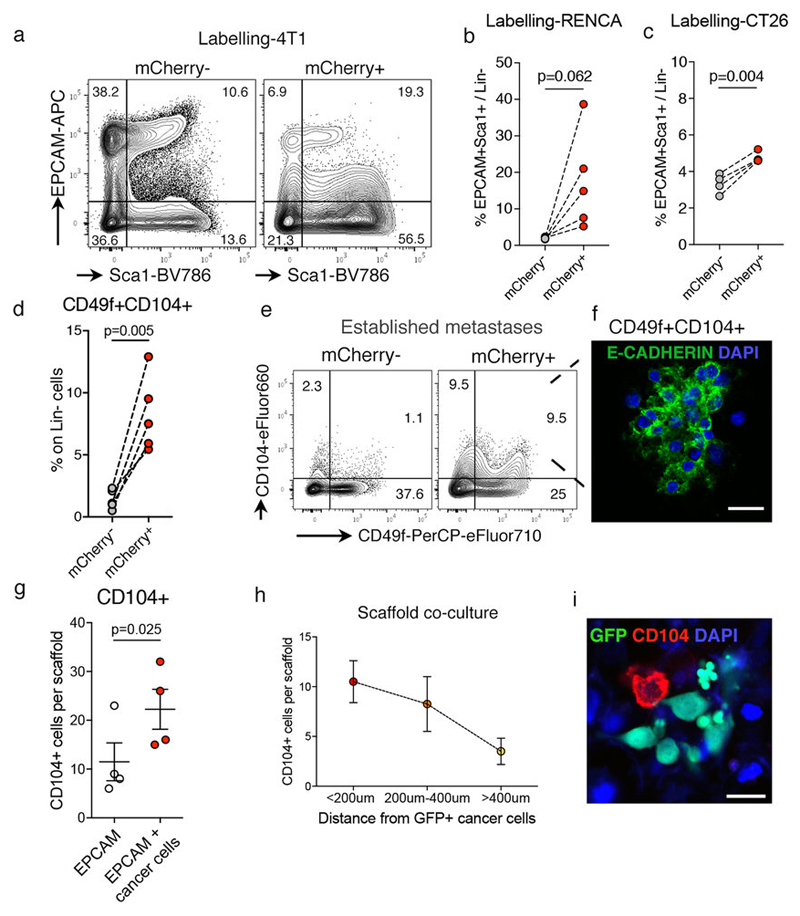
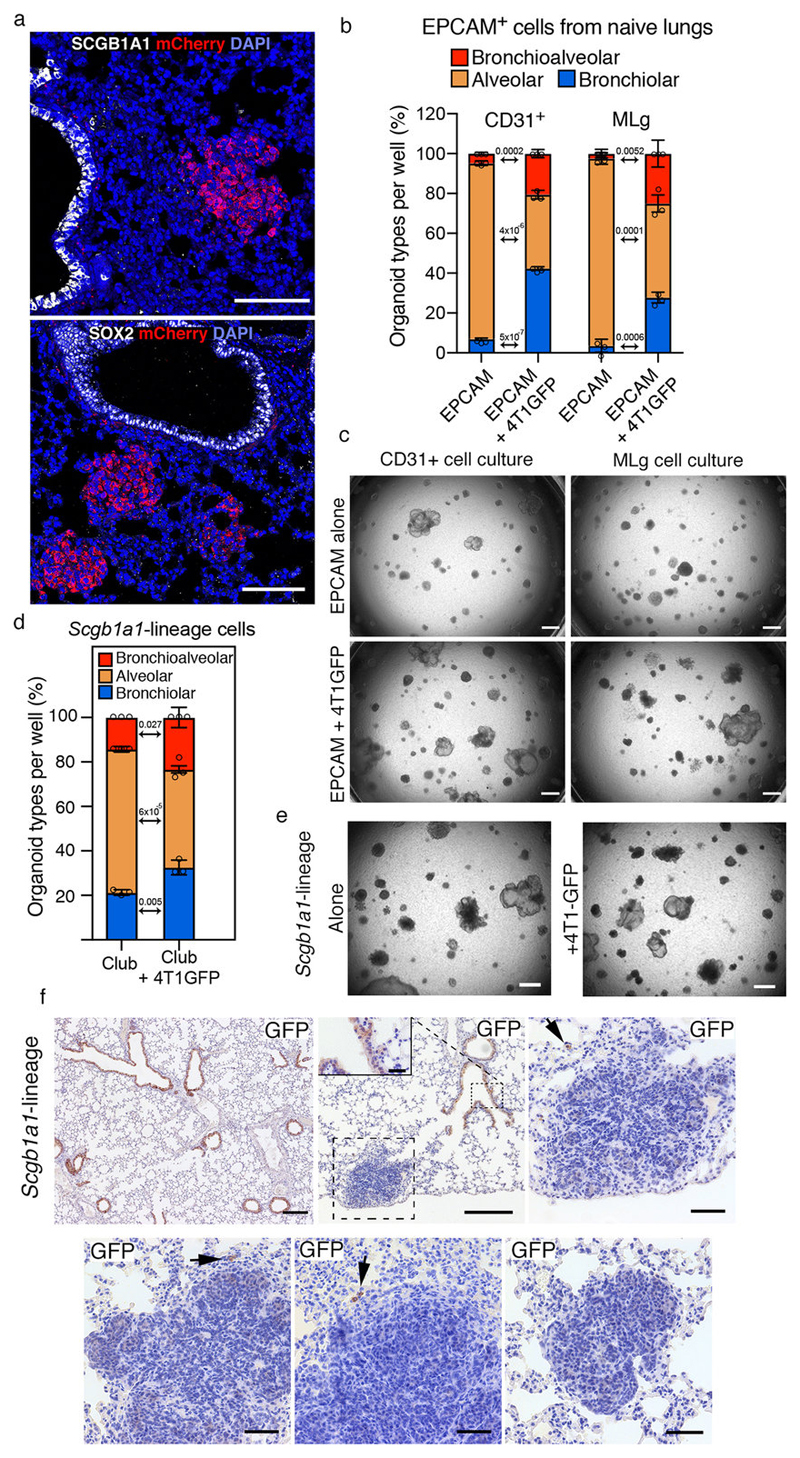
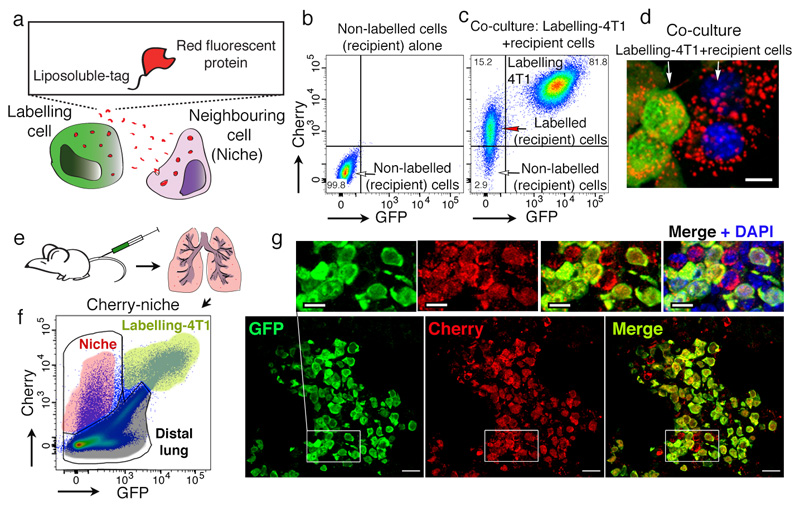
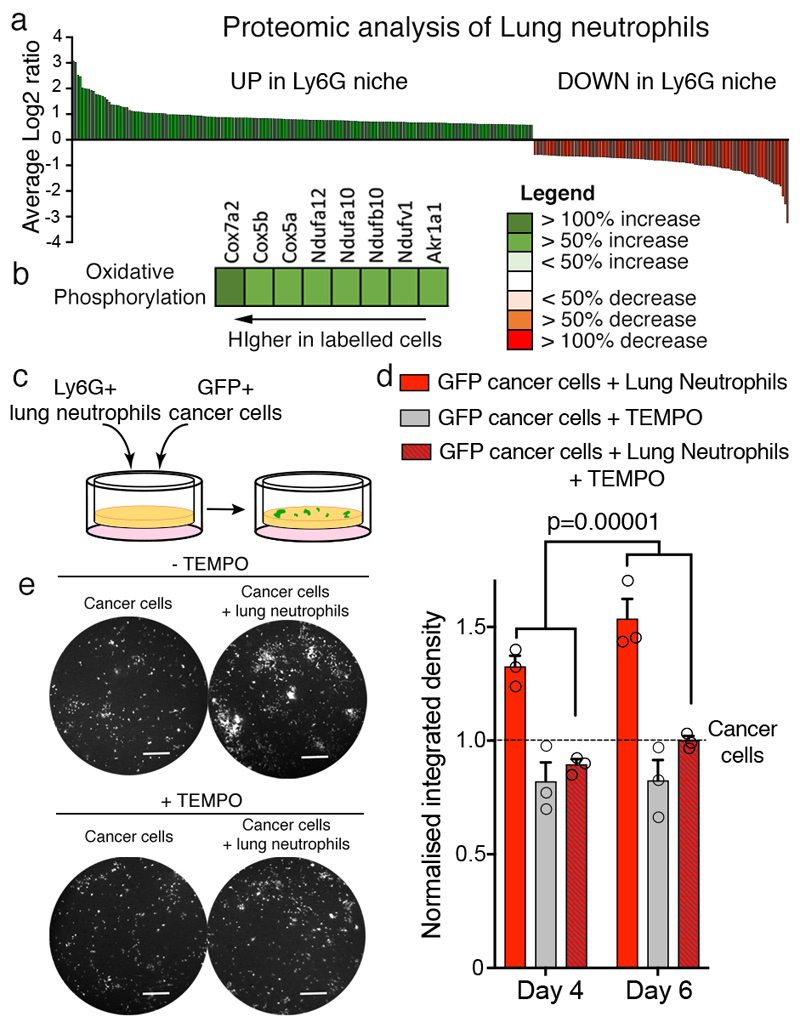
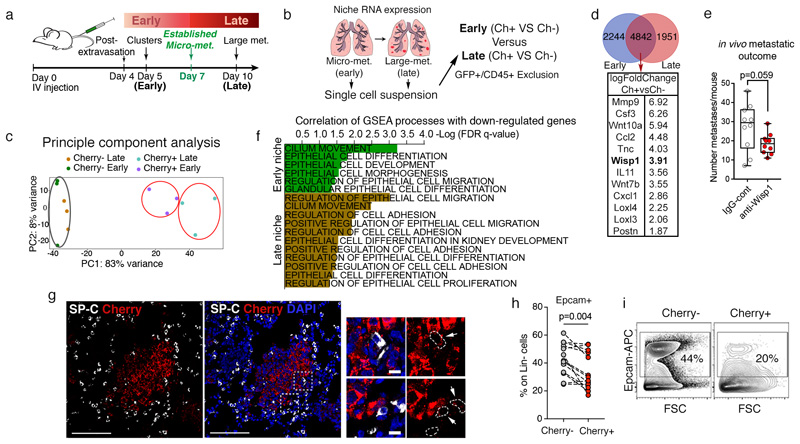
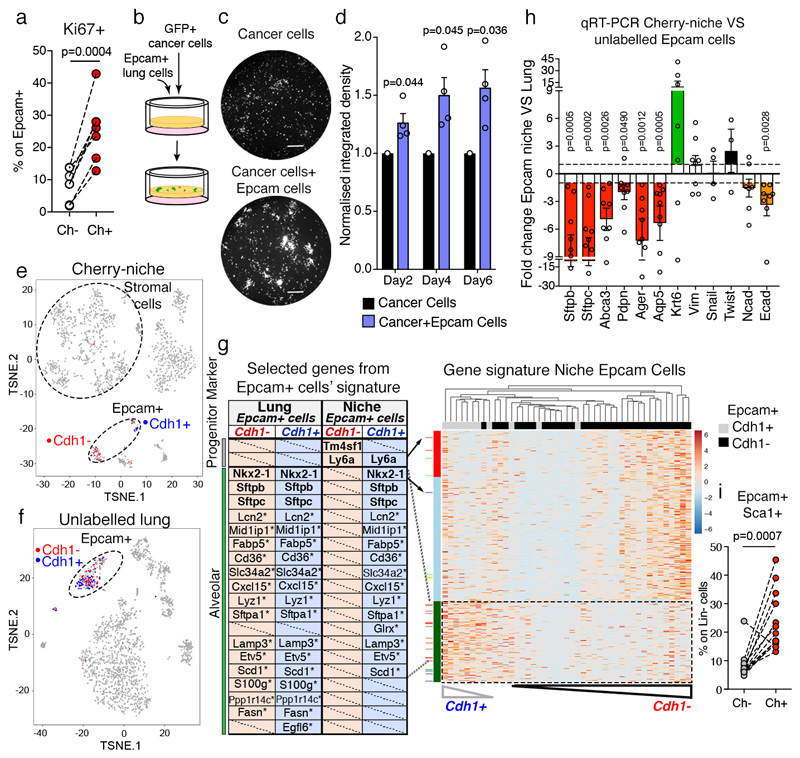
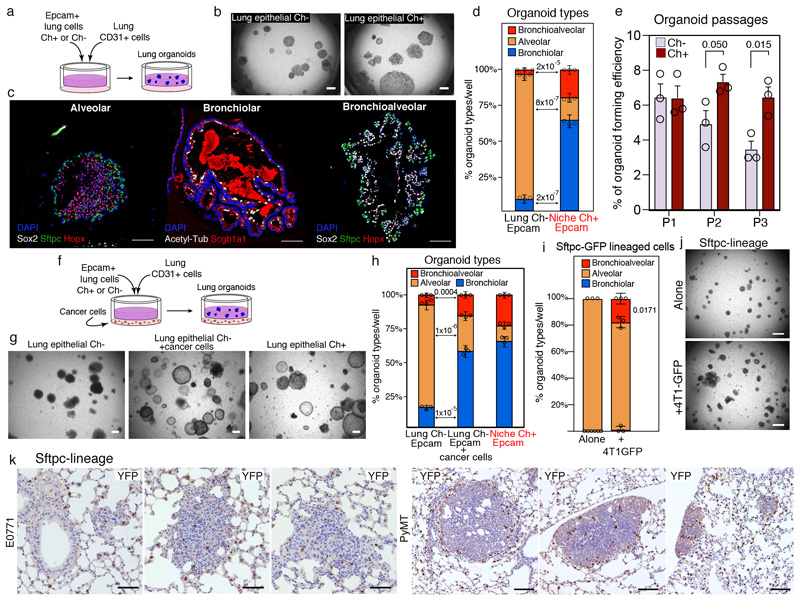
Direct investigation of the early cellular changes induced by metastatic cells within the surrounding tissue remains a challenge. Here we present a system in which metastatic cancer cells release a cell-penetrating fluorescent protein, which is taken up by neighbouring cells and enables spatial identification of the local metastatic cellular environment. Using this system, tissue cells with low representation in the metastatic niche can be identified and characterized within the bulk tissue. To highlight its potential, we applied this strategy to study the cellular environment of metastatic breast cancer cells in the lung. We report the presence of cancer-associated parenchymal cells, which exhibit stem-cell-like features, expression of lung progenitor markers, multi-lineage differentiation potential and self-renewal activity. In ex vivo assays, lung epithelial cells acquire a cancer-associated parenchymal-cell-like phenotype when co-cultured with cancer cells and support their growth. These results highlight the potential of this method as a platform for new discoveries.


Figures

Extended Data Figure 1
Extended Data Figure 1. Cherry-niche in vitro
a, sLP-mCherry design. b, Fluorescence images of Labelling-4T1 cells post-thawing. Scale bar 10μm. c, Representative FACS plot of Labelling-4T1 cells. d, In vitro cultures of the indicated cell types with Labelling-4T1 cell conditioned media (LCM): culture scheme and representative fluorescence images of HC11 (murine mammary epithelial cells) and hNLF (human normal lung fibroblasts) with LCM (scale bar 10μm). e, FACS plots of 4T1, HC11, RAW264.7 (murine macrophages), hNLF, murine breast Carcinoma Associated Fibroblasts (CAF) cultured with LCM. f, FACS analysis of 293T cells cultured with LCM, at different time-points after LCM removal (black dots); white dots show the theoretical decrease considering the cell proliferation rate only (the amount of 293T cells mCherry labelled after 24h incubation with LCM was set to 100%). g, Representative fluorescence image of 4T1-CD63GFP cells cultured with LCM. Scale bars: main 5μm, inset 1μm. h, Representative Correlative Light and Electron Microscopy (CLEM) of Labelling-4T1 cells re-up-taking sLP-mCherry (n=5 different cells analysed): upper-left panel shows bright-field image overlaid mCherry IF (~700nm optical section); lower-left panel shows EM of same cell (~70nm section thickness); large central panel shows best approximation of IF/bright-field/EM overlay (scale bar 5μm); right panels show EM insets from indicated areas in the large central panel (black arrows point at vesicular structures containing the mCherry, scale bar 1μm). i, j, Analysis of in vitro labelling potential of soluble fraction and extracellular vesicles (EVs) isolated from LCM by FACS: (i) schematic representation of LCM fractionation; (j) HC11 cells cultured with either LCM, soluble fraction after EVs depletion (soluble) or purified EVs. k, ImageStream analysis of Cherry+ EVs in LCM (16% of total EVs are Cherry+). Data are representative one of three (b), ten (c), two (d, e-g, j, k) independent experiments. See Source Data.
Extended Data Figure 2
Extended Data Figure 2. Cherry-niche in vivo.
a, b, Distance of labelled cells within metastases: (a) representative fluorescence images (lines measure the maximum distance of labelled cells (mCherry) from Labelling-4T1 cells (mCherry/GFP); scale bar 50μm); (b) quantification of labelling distance in micro-metastases (n=11) and macro-metastases (n=4). c, Correlation between the percentage of mCherry labelled niche cells and the percentage of cancer cells in metastatic lungs analysed by FACS: only low number of cancer cells (left, n=14 mice) and all cancer cell frequencies (right, n=31 mice). Statistical analysis by Pearson correlation. d-f, CD45+ cell frequency on live cells in distal lung, Cherry-niche and naïve lungs (collected from mice which were not injected) by FACS: (d) Balb/c mice injected with Labelling-4T1 cells (n=5 per group); (e) Balb/c mice injected with Labelling-HC11 cells (n=4); (f) Rag1ko mice injected with Labelling-4T1 cells (n=10). Statistical analysis by paired two-tailed t-test. Data are represented as mean ±SEM. See Source Data.
Extended Data Figure 3
Extended Data Figure 3. Cherry-niche neutrophils increase ROS production.
a, b, (a) CD11b+ and (b) Ly6G+cell frequencies on live cells in distal lung and Cherry-niche by FACS (n=9 per group). c, Enriched processes by MetaCore analysis and GSEA on proteomic data (by comparing Cherry-niche (n=3) and distal lung (n=3) neutrophils; Cherry-niche dominant proteins obtained by using WebGestalt (http://www.webgestalt.org/option.php). d, PCA of proteins found in unlabelled or Cherry-niche neutrophils (n=3, each with 10 mice, small circles; large circles represent the average of the triplicates). e, Representative FACS plot and f, scatter plot of intrinsic ROS in Ly6G+ cells (n=6). g, GFP signal quantification of 3D co-culture with MMTV-PyMT-GFP+ cancer cells, Ly6G+ MACS-sorted cells from either naïve or metastatic lungs with or without the ROS inhibitor TEMPO (n=3, each with 3 wells). Data is normalised to cancer cell growth (Statistical analysis on biological replicates). h, Representative cancer cell growth on the scaffold (from 14 independent experiments): integrated density of the GFP signal measured on the scaffold using ImageJ and the corresponding fluorescent image of GFP+ cancer cell growth (scale bar 400μm). Statistical analysis by paired two-tailed t-test (a, b, f), hypergeometric test with Benjamini-Hochberg correction (c, Metacore), weighted Kolmogorov–Smirnov-like statistic with Benjamini-Hochberg correction (c, GSEA) and Two-way ANOVA (g). Data represented as mean ±SD (f) and ±SEM (g). See Source Data.
Extended Data Figure 4
Extended Data Figure 4. RNA sequencing of non-immune Cherry-niche cells.
a, b, GSEA on Cherry-niche upregulated genes: (a) percentage of correlating processes related to the indicated activity and (b) specific signalling pathways (indicated by the * in (a) either at early or late time point). c, MetaCore analysis on genes differentially expressed from RNA-seq data, comparing early (n=3) or late (n=3) Cherry+ samples vs the respective Cherry- (see Fig.3a, b). Statistical analysis by hypergeometric test with Benjamini-Hochberg correction.
Extended Data Figure 5
Extended Data Figure 5. Wisp1 supports metastatic growth.
a, b, Representative IF images of lung metastatic tissues (n=2 mice) stained with GFP (green) to detect Labelling-4T1 cells, WISP1 (red) and DAPI (blue) showing distal lung and metastatic areas, scale bar 50 μm; (b) a representative image showing the enrichment of Wisp1+ cells within lung metastasis including niche cells (white arrows); scale bar 50μm. c-e, Anti-WISP1 blocking antibody treatment in vivo: (c) experimental design (IT, intratracheal injection; IP, intraperitoneal injection); (d) metastatic outcome measured as the percentage of lung area covered by metastases (quantification was performed on two lung levels 100μm apart); (e) representative H&E images (n=5 mice each group; black arrows show metastatic foci); scale bar 500μm. Two experiments with lower overall metastatic frequency are quantified in Figure 3e. Statistical analysis by Two-way Anova (d). Data represented as mean ±SEM. See Source Data.
Extended Data Figure 6
Extended Data Figure 6. Lung pneumocytes react to cancer cells in human breast pulmonary metastases.
a-c, Histology on human breast tumour lung metastases sections: (a) representative image of distal lung (scale bar 100μm) and (b) image from the tumour-lung interface showing the pneumocyte marker Thyroid Transcription Factor 1 (TTF1) expression (scale bar 50μm); (c) representative histology images from metastatic border (scale bar 100μm). d-f, Alveolar cell proliferation in human breast tumour lung metastases analysed by IF: representative images from (d) distal lung and (e) metastatic border showing TTF1 (red), Ki67 (green) and DAPI (blue), scale bars: main 100μm, inset 50μm; (f) quantification shown on a Tukey plot: box from the 25th to 75th percentiles, the bar is the median and the whiskers from smallest to largest value. Statistical analysis by paired two-tailed t-test. Tissue sections from n=4 independent patients were analysed. See Source Data.
Extended Data Figure 7
Extended Data Figure 7. Epithelial cells support cancer cell growth ex vivo.
a, MMTV-PyMT-GFP+ cancer cell proliferation in 2D co-culture with MACS-sorted Epcam+ and Ly6G+ cells stained with EdU and analysed by FACS (n=3 independent experiments). Data normalised to cancer cell proliferation. b-d, 3D co-culture of MMTV-PyMT-GFP+ cancer cell with MACS-sorted Epcam+ and Ly6G+ cells: (b) co-culture scheme; (c) representative images from 4 independent experiments (day 4, scale bar 400μm); (d) GFP signal quantification. Data normalised to cancer cell growth (n=4 independent experiments (dots), each with 3-4 technical replicates). Statistical analysis on biological replicates by one sample two-tailed t-test (a) and Two-way ANOVA (d). Data are represented as mean ±SEM. See Source Data.
Extended Data Figure 8
Extended Data Figure 8. scRNA-seq analysis reveals different sub-pools of stromal cells in the niche.
a, tSNE plots of CD45- cells isolated from distal lung (n=1996) or Cherry-niche (n=1473) after scRNA-seq analysis: the CAFs are coloured based on the expression levels of the indicated genes. b, tSNE niche plots (a), where each plot shows in red the cells expressing the indicated stromal marker. c, MetaCore pathway enrichment analysis using the list of genes detected in at least 50% of the indicated marker defined cells (n=66 Thy1+ cells, n=175 Pdgfrb1+ cells, n=322 Pdgfra+ cells, n=330 Acta2+ cells, n=25 Lgr6+ cells). Statistical analysis by hypergeometric test with Benjamini-Hochberg correction.
Extended Data Figure 9
Extended Data Figure 9. Cherry-niche epithelial cells are enriched for stem cell markers.
a, Representative FACS plots showing Lin- (CD45-CD31-Ter119-) cells in distal lung and Cherry-niche from Labelling-4T1 injected mice (quantification in Fig.4i). b, c, Scatter plots showing FACS quantification of Epcam+Sca1+ cell frequency on Lin- (CD45-CD31-Ter119-) cells in distal lung and Cherry-niche with (b) Labelling-RENCA (n=5) and (c) Labelling-CT26 (n=4). d-f, (d) Scatter plot of CD49f+CD104+ cell frequency on Lin- (CD45-CD31-Ter119-) cells in distal lung and Cherry-niche by FACS (n=5); (e) representative FACS plots; (f) representative IF image of FACS-sorted Cherry-niche CD49f+CD104+ cells using E-cadherin (green) and DAPI (blue); scale bar 20μm. g-i, 3D co-culture of MMTV-PyMT-GFP+ cancer cells with MACS-sorted Epcam+ cells: (g) quantification of integrin β4 (CD104) expression on Epcam+ cells; (h) number of CD104+ cells proximal to cancer cells (n=4 from three independent sorts); (i) representative IF image from the co-culture stained with CD104 (red); GFP+ cancer cells (green) and DAPI (blue); scale bar 20μm. Statistical analysis on biological replicates (g-h) by paired two-tailed t-test (b-d, g). Data represented as mean ±SEM. See Source Data.
Extended Data Figure 10
Extended Data Figure 10. Cancer cells change lung epithelial cell lineage commitment ex-vivo.
a, Representative IF images of lung metastatic sections (n=3 mice) co-stained with airway markers, either (a) Scgb1a1 (white) or (b) Sox2 (white), Cherry (red) and DAPI (blue); scale bar 100μm. b, c, Lung organoids with Epcam+ FACS-sorted cells in co-culture with either lung stromal CD31+ cells or MLg fibroblasts alone or in presence 4T1-GFP cells from metastatic lungs in the lower chamber: (b) quantification and (c) representative bright-field images of organoids, scale bar 150μm. d-e, Lung organoids with Scgb1a1-CreERT2 lineage cells with or without 4T1-GFP: quantification (d) and representative bright-field pictures (e), scale bar 150μm. f, Representative staining of lineage cells in metastatic lungs from Scgb1a1-CreERT2 mice injected with MMTV-PyMT cancer cells. Scale bars: main 50μm, apart from the first 2 panels where it’s 200μm (inset 25μm). Data generated with sorted Epcam (b) or club-lineage cells (d) and represented as cumulative percentage indicating the mean ±SD of three co-cultures per sorting. Statistical analysis by two-tailed t-test (b, d), for original non-cumulative values see accompanying Source Data. Images are representative of three organoid cultures (c, e). See Source Data.
Figure 1
Figure 1. Cherry-niche labelling strategy.
a, Labelling design. b-c, Representative FACS plots of (b) naïve 4T1 cells alone or (c) co-cultured with Labelling-4T1. d, fluorescence image from co-culture (scale bar 10μm). Data representative from 2 independent experiments (b-d). e-g, In vivo labelling: (e) experimental scheme; (f) representative FACS plot of a metastatic lung, n=50 mice. (g) representative images of Labelling-4T1 metastasis immuno-fluorescence staining (IF) (n=8 mice): cancer cells anti-GFP (green) and anti-Cherry (red), niche cells (Cherry only). DAPI (blue). Scale bars: main 20μm, inset 10μm. For gating strategy see Supplementary File 1.
Figure 2
Figure 2. Cherry-niche allows detection of niche neutrophils.
a,b, Proteomic analysis of Ly6G+ FACS-sorted cells: (a) all differentially detected proteins and (b) oxidative phosphorylation associated proteins. c-e, 3D co-culture of MMTV-PyMT-GFP+ cancer cells and Ly6G+ MACS-sorted cells with or without the ROS inhibitor TEMPO: (c) co-culture scheme; (d) GFP signal quantification (n=3 independent experiments, each with 3 to 10 technical replicates). Data normalised to cancer cell growth and represented as mean ±SEM. Statistical analysis on biological replicates by Two-way ANOVA; (e) representative images from 3 independent experiments (day 6, scale bar 400μm). See Source Data.
Figure 3
Figure 3. Cherry-niche identifies epithelial component of metastatic TME.
a, Schematic of metastatic progression using labelling-4T1 cells. b, Experimental design for RNA-seq. c, Principle Component Analysis (PCA) diagram of CD45-Ter119- cell signatures from metastatic lungs at early (n=3, 10 mice each) and late (n=3, 5 mice each) time points. d, Venn diagram of differentially expressed genes in Cherry-niche from RNA-seq and selected factors common at early and late stages. e, Anti-Wisp1 blocking antibody treatment in vivo (n=10, from two independent experiments; data shown on a Tukey plot: box from the 25th to 75th percentiles, the bar is the median and the whiskers from smallest to largest value). f, GSEA correlation from RNA-seq data comparing early (n=3) or late (n=3) Cherry+ samples vs their respective Cherry-controls. g, Representative IF image of lung tissue (n=3 mice): mCherry-labelled micro-metastasis (red), Surfactant protein C (SP-C) (white) and DAPI (blue). Scale bars: main 100μm, inset 10μm (white arrows: mCherry labelled SP-C+ cells). h, Epcam+ cell frequency on Lin-(CD45-CD31-Ter119-) cells in distal lung (Ch-) and Cherry-niche (Ch+) estimated by FACS (n=13). i, Representative FACS plots from (h). Statistical analysis by unpaired two-tailed t-test with Welch’s correction (e), weighted Kolmogorov–Smirnov-like statistic with Benjamini-Hochberg correction (f) and paired two-tailed t-test (h). See Source Data.
Figure 4
Figure 4. Metastatic niche lung epithelial cells display progenitor phenotype.
a, Scatter plot of Epcam+ cell proliferation by Ki67 staining on FACS-sorted cells (n=7 from independent sorts). b-d, MMTV-PyMT-GFP+ cancer cell growth in 3D co-culture with MACS-sorted Epcam+ cells: (b) co-culture scheme, (c) representative images from 4 independent experiments (day 6, scale bar 400μm), (d) GFP signal quantification (n=4, each with 3 technical replicates, statistical analysis on biological replicates). Data normalised to cancer cell growth. e-g, scRNA-seq analysis: tSNE plots of CD45- cells from (e) Cherry-niche (n=1473) or (f) distal lung (n=1996); (g) (right) heatmap of niche Epcam+ cells; ordered genes in rows and hierarchically clustered cells in columns; (left) table shows established lineage markers (bold) and putative alveolar markers (*). h qRT-PCR analysis of Epcam+ FACS-sorted cells (n=9 Sftpc, Aqp5; n=8 Sftpb, Abca3, Pdpn, Ager, Vim, Ecad; n=7 Krt6, Ncad; n=4 Snail, n=3 Twist). Data represented as fold change to Cherry- Lung Epcam cells (Statistical analysis on the DCt values). i, Epcam+Sca1+ cell frequency on Lin-(CD45-CD31-Ter119-) cells by FACS (n=13). Statistical analysis by paired two-tailed t-test (a, h, i), one sample two-tailed t-test (d). Data represented as mean ±SEM. See Source Data.
Figure 5
Figure 5. CAPs show multi-lineage differentiation potential.
a-e, Lung organoids: (a) co-culture scheme; (b) representative bright-field images (scale bar 100μm); (c) representative IF of organoid sections stained with the indicated markers (scale bar 50μm); (d) quantification; (e) organoid formation efficiency over passages. f-h, Lung organoids with or without Labelling-4T1: (f) co-culture scheme, (g) representative bright-field images (scale bar 100μm) and (h) quantification. i, j, Lung organoids with Sftpc-CreERT2 lineage cells with or without 4T1-GFP: (i) quantification and (j) representative bright-field images, scale bar 150μm. Images are representative of six (b, c, g) and three (j) organoid cultures. Data generated from independent sorts (d, h, i) and represented as cumulative percentage using the mean ±SD of three co-cultures per sorting. k, Representative staining of lineage cells in metastatic lungs from Sftpc-CreERT2 mice injected with cancer cells, either E0771 (n=3; scale bar 50μm) or MMTV-PyMT (n=3; scale bar 100μm). Statistical analysis by unpaired two-tailed t-test (d, e, h) and one sample two-tailed t-test (i), on original non-cumulative values (see Source Data).

Comment in

References

    1. Hanahan D, Coussens LM. Accessories to the Crime: Functions of Cells Recruited to the Tumor Microenvironment. CCELL. 2012;21:309–322. - PubMed
    1. Quail DF, Joyce JA. Microenvironmental regulation of tumor progression and metastasis. Nature Medicine. 2013;19:1423–1437. - PMC - PubMed
    1. Barash S, Wang W, Shi Y. Human secretory signal peptide description by hidden Markov model and generation of a strong artificial signal peptide for secreted protein expression. Biochemical and Biophysical Research Communications. 2002;294:835–842. - PubMed
    1. Flinterman M, et al. Delivery of Therapeutic Proteins as Secretable TAT Fusion Products. Mol Ther. 2009;17:334–342. - PMC - PubMed
    1. Shaner NC, Steinbach PA, Tsien RY. A guide to choosing fluorescent proteins. Nat Meth. 2005;2:905–909. - PubMed

Publication types

MeSH terms

Substances