Review
. 2019 Jul;11(7):3122-3135.
doi: 10.21037/jtd.2019.06.27.

Lung monitoring with electrical impedance tomography: technical considerations and clinical applications

Affiliations
Review

Lung monitoring with electrical impedance tomography: technical considerations and clinical applications

Vinko Tomicic et al. J Thorac Dis. 2019 Jul.

Abstract

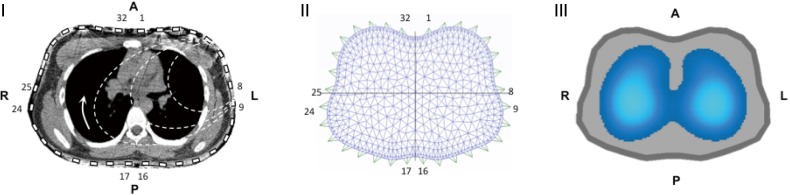
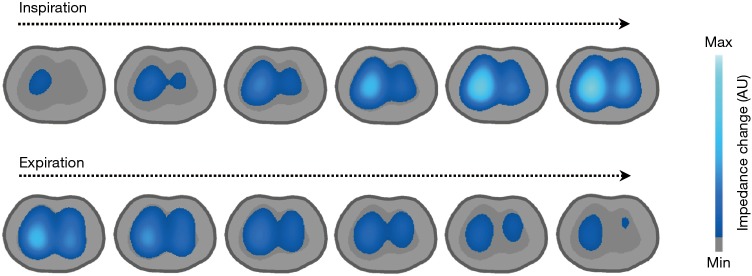
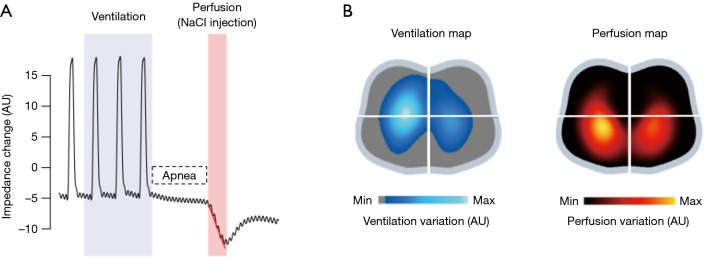
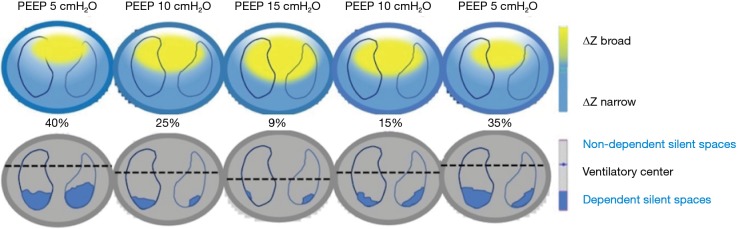
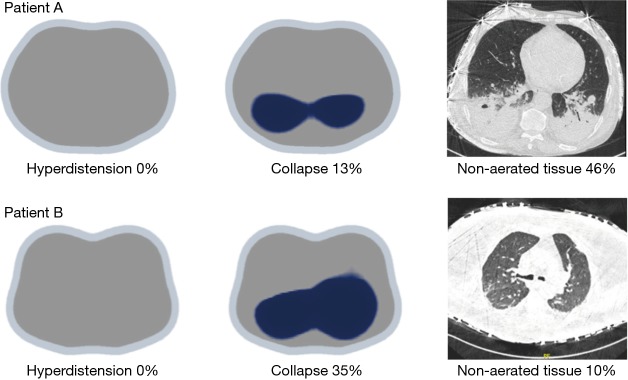
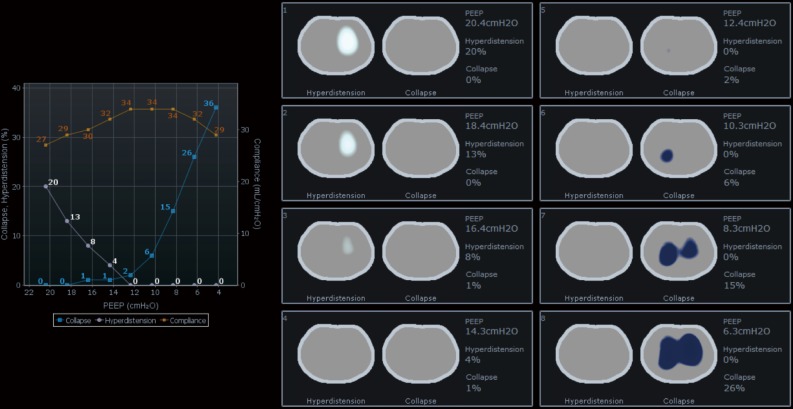
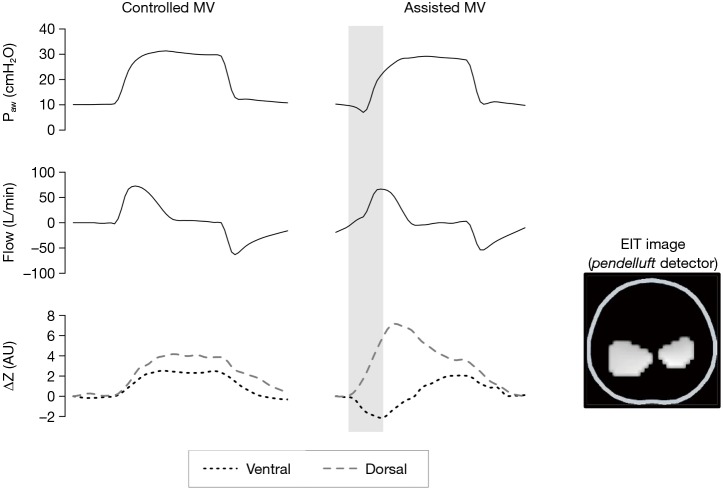
In recent years there has been substantial progress in the imaging evaluation of patients with lung disease requiring mechanical ventilatory assistance. This has been demonstrated by the inclusion of pulmonary ultrasound, positron emission tomography, electrical impedance tomography (EIT), and magnetic resonance imaging (MRI). The EIT uses electric current to evaluate the distribution of alternating current conductivity within the thoracic cavity. The advantage of the latter is that it is non-invasive, bedside radiation-free functional imaging modality for continuous monitoring of lung ventilation and perfusion. EIT can detect recruitment or derecruitment, overdistension, variation of poorly ventilated lung units (silent spaces), and pendelluft phenomenon in spontaneously breathing patients. In addition, the regional expiratory time constants have been recently explored.

Keywords: Electrical impedance tomography (EIT); acute respiratory distress syndrome (ARDS); critical care; physiologic monitoring.


Conflict of interest statement

Conflicts of Interest: The authors have no conflicts of interest to declare.

Figures

Figure 1
Figure 1
On the left (I), distribution of the electrical signal based on the opposition exerted by each chest structure to the passage of current. On the middle (II), symmetrical distribution of the electrical signal observed in a mesh. The excitatory current is applied consecutively between pairs of adjacent electrodes. After each injection of current, the resulting voltages (U) are measured between the remaining pairs of electrodes. On the right (III), it is shown the image obtained during ventilation trough electrical impedance tomography Enlight 1800 with 32 electrodes (Timpel, Sao Paulo, Brazil). Project FONDECYT 1161510. Cornejo et al.
Figure 2
Figure 2
Dynamic images during one respiratory cycle, where inspiration and expiration images were acquired with Electrical Impedance Tomography Enlight 1800 (Timpel, Sao Paulo, Brazil). Right lung is inflated before left lung and left lung become deflated before right lung
Figure 3
Figure 3
Shows in (A) the maximum slope of impedance reduction upon injecting of 10 mL 7.5% NaCl (the period that indicates the passage of the indicator through the lung territory), and in (B) the map of ventilation and perfusion obtained with Electrical Impedance Tomography Enlight 1800 (Timpel, Sao Paulo, Brazil). Using saline injection in a patient with pneumonia in the left lower lobe. In this case, the limited perfusion and ventilation of the left lung can be observed. Combined with other patient exams, this bedside information may facilitate the understanding of the clinical scenario and guide the medical intervention.
Figure 4
Figure 4
Curve demonstrating quasi-static inflation with a flow of 1 L/min in a focal ARDS model. Each window corresponds to the respective region of interest (ROI) or layer of each analyzed image. On the left graph, a Pressure-Volume curve obtained with 15 cmH2O positive end-expiratory pressure (PEEP) without recruitment is observed. In the first window there is a lower concavity showing the upper inflection point (UIP) (white arrow) and in the 4th window there is an upper concavity representing lower inflection point (LIP) (yellow arrow). On the right, you can see a Pressure-Volume curve from post-recruitment 15 cmH2O PEEP (40 cmH2O for 40 seconds) where alignment of the curve can be seen in the four windows (suppression of UIP and LIP). The lower graphs in both images—right and left—demonstrate slow flow inflation. Swine model presenting focal ARDS from serial single-lung bronchoalveolar lavage with warm saline. Dr. Vinko Tomicic Medical Research Laboratory (LIM 09). University of Sao Paulo, Brazil, 2006. ARDS, acute respiratory distress syndrome.
Figure 5
Figure 5
Modified from Spadaro et al. (23): top in blue: regional impedance maps (ΔZ) with different levels of positive end-expiratory pressure (PEEP) (ascending 5, 10 and 15 cmH2O and descending 10 and 5 cmH2O). In the lower figures, the black dotted line shows the centralization of the ventilation by increasing the PEEP (recruitment); along with that, there is a reduction in the dependent silent spaces (blue), which reappear with PEEP decrease. In the same color one can observe the percentages of the dependent silent zones located above the sequencing of figures. Although marginal, there are silent spaces in the non-dependent region.
Figure 6
Figure 6
Computed tomography (CT) and electrical impedance tomography (EIT) assessments in an ARDS patient in prone positioning. On the top, there is a positive end-expiratory pressure (PEEP) titration according EIT. On the bottom, there are CT slices taken at end-expiratory and end-inspiratory with PEEP 5 and PEEP 15 cmH2O. In this patient with highly recruitable lung, the use of PEEP 15 was associated to better respiratory mechanics (higher compliance and lower driving pressure), and higher recruitment and lower tidal recruitment/derecruitment in comparison with PEEP 5. ARDS, acute respiratory distress syndrome.
Figure 7
Figure 7
Simultaneous acquisitions of computed tomography (CT) and electrical impedance tomography (EIT) images (Enlight, Timpel, Sao Paulo, Brazil) at positive end-expiratory pressure (PEEP) 5 cmH2O, after performing a recruitment maneuver and PEEP decremental trial. Patient A has 13% of collapse, but 46% of non-aerated region, while Patient B (morbidly obese) has 35% of collapse, but only 10% of non-aerated region. In both cases, overdistension was 0% at PEEP 5 cmH2O. Effectively, in the Patient A when comparing the CT at PEEP 5 cmH2O with CT images taken at 45 cmH2O (not shown), we observed a percentage of potentially recruitable lung of 12%. In the other hand, Patient B could be related to “silent spaces”, which is only found using EIT monitoring or transpulmonary pressure at end expiration. Project FONDECYT 1161510. Cornejo et al.
Figure 8
Figure 8
Decremental PEEP titration trial after performing a maximum recruitment maneuver, employing electrical impedance tomography monitoring. The pixels in white describes the overdistension, which dissipates as positive end-expiratory pressure (PEEP) decreases, until disappearing with a PEEP of 12 cmH2O. In blue, the beginning of the collapse can be observed (from PEEP 16). With a PEEP of 12 the overdistension (light blue) has disappeared and there are low levels of collapse [blue]. At PEEP 13, there would be a balance between the two conditions; this is considered the best imaging step to titrate PEEP, which coincides with best compliance. This image is provided by Enlight 1800, Timpel, Sao Paulo, Brazil. Project FONDECYT 1161510. Cornejo et al.
Figure 9
Figure 9
Pendelluft phenomenon detected by electrical impedance tomography Enlight 1800. In Controlled mechanical ventilation, the magnitude of relative impedance changes at ventral and dorsal regions are similar during a respiratory cycle. However, in Assisted mechanical ventilation, some patients may experience pendelluft, that is, displacement of gas from ventral (more recruited regions) to dorsal lung (less recruited regions) during early inspiration. This as a consequence of strong contractions of the diaphragm, generating high distending forces, which are concentrated in dorsal lung regions (12).
Figure 10
Figure 10
There are two graphs from an ARDS patient under spontaneous breathing in pressure support ventilation and “best” positive end-expiratory pressure (PEEP) set according electrical impedance tomography (EIT), with two levels of pressure support (PS). In (A) the level of PS is 5 cmH2O, and in (B), PS is 15 cmH2O. Time is on the x-axis and different parameters [airway pressure: Paw, respiratory flow: Flow, and tidal impedance, global and by region of interest (ROI) are on the y-axis. In this particular case, EIT monitoring shows that pendelluft phenomenon (differences between ROI 1 “ventral region” and ROI 4 “dorsal region”), evident with PS 5, practically disappeared with PS 15 (Project FONDECYT 1161510. Cornejo et al.]. ARDS, acute respiratory distress syndrome.

References

    1. Chiumello D, Froio S, Bouhemad B, et al. Clinical review: Lung imaging in acute respiratory distress syndrome patients - an update. Critical Care 2013;17:243. 10.1186/cc13114 - DOI - PMC - PubMed
    1. Frerichs I, Amato M, van Kaam A, et al. Chest electrical impedance tomography examination, data analysis, terminology, clinical use and recommendations: consensus statement of the TRanslational EIT developmeNt stuDy group. Thorax 2017;72:83-93. 10.1136/thoraxjnl-2016-208357 - DOI - PMC - PubMed
    1. Costa EL, Gonzalez R, Amato MB. Electrical impedance tomography. Curr Opin Crit Care 2009;15:18-24. 10.1097/MCC.0b013e3283220e8c - DOI - PubMed
    1. Victorino JA, Borges JB, Okamoto VN, et al. Imbalances in regional lung ventilation: a validation study on electrical impedance tomography. Am J Respir Crit Care Med 2004;169:791-800. 10.1164/rccm.200301-133OC - DOI - PubMed
    1. Riera J, Riu PJ, Casan P, et al. Tomografía de impedancia eléctrica en la lesión pulmonar aguda. Medicina Intensiva 2011;35:509-17. 10.1016/j.medin.2011.05.005 - DOI - PubMed