

Systematic mapping of protein-metabolite interactions in central metabolism of Escherichia coli
- PMID: 31464375
- PMCID: PMC6706640
- DOI: 10.15252/msb.20199008
Systematic mapping of protein-metabolite interactions in central metabolism of Escherichia coli
Abstract
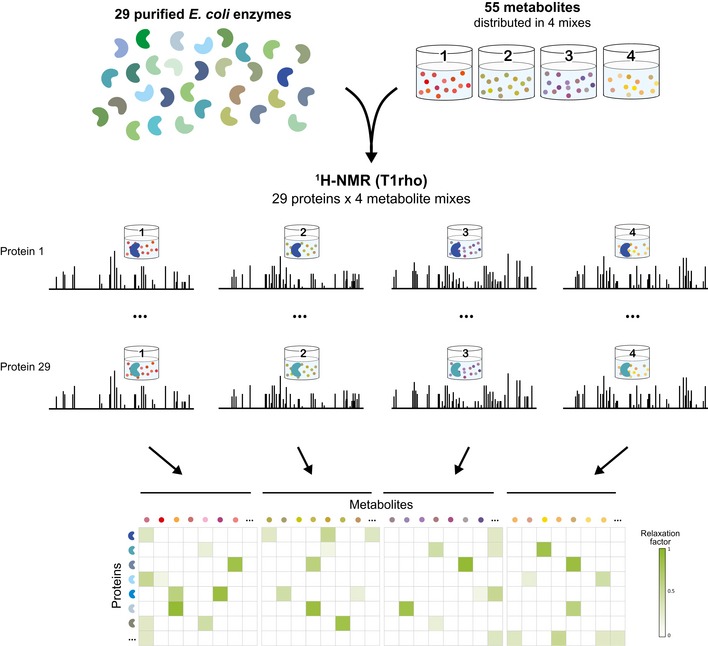
Metabolite binding to proteins regulates nearly all cellular processes, but our knowledge of these interactions originates primarily from empirical in vitro studies. Here, we report the first systematic study of interactions between water-soluble proteins and polar metabolites in an entire biological subnetwork. To test the depth of our current knowledge, we chose to investigate the well-characterized Escherichia coli central metabolism. Using ligand-detected NMR, we assayed 29 enzymes towards binding events with 55 intracellular metabolites. Focusing on high-confidence interactions at a false-positive rate of 5%, we detected 98 interactions, among which purine nucleotides accounted for one-third, while 50% of all metabolites did not interact with any enzyme. In contrast, only five enzymes did not exhibit any metabolite binding and some interacted with up to 11 metabolites. About 40% of the interacting metabolites were predicted to be allosteric effectors based on low chemical similarity to their target's reactants. For five of the eight tested interactions, in vitro assays confirmed novel regulatory functions, including ATP and GTP inhibition of the first pentose phosphate pathway enzyme. With 76 new candidate regulatory interactions that have not been reported previously, we essentially doubled the number of known interactions, indicating that the presently available information about protein-metabolite interactions may only be the tip of the iceberg.
Keywords: allostery; central metabolism; nuclear magnetic resonance; protein-metabolite interactions; regulation.
© 2019 The Authors. Published under the terms of the CC BY 4.0 license.
Conflict of interest statement
The authors declare that they have no conflict of interest.
Figures
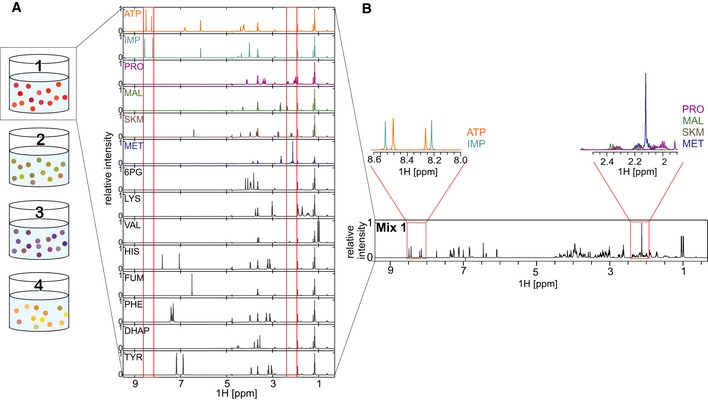
1D 1H‐NMR spectra of a metabolite mix and the individual metabolites contained therein.
Identification of single compound peaks from 1D 1H‐NMR spectra of a metabolite mix. Compound detection is exemplified by showing sections of the 1D 1H‐NMR spectra of ATP, IMP, proline (PRO), malate (MAL), shikimate (SKM), and methionine (MET).
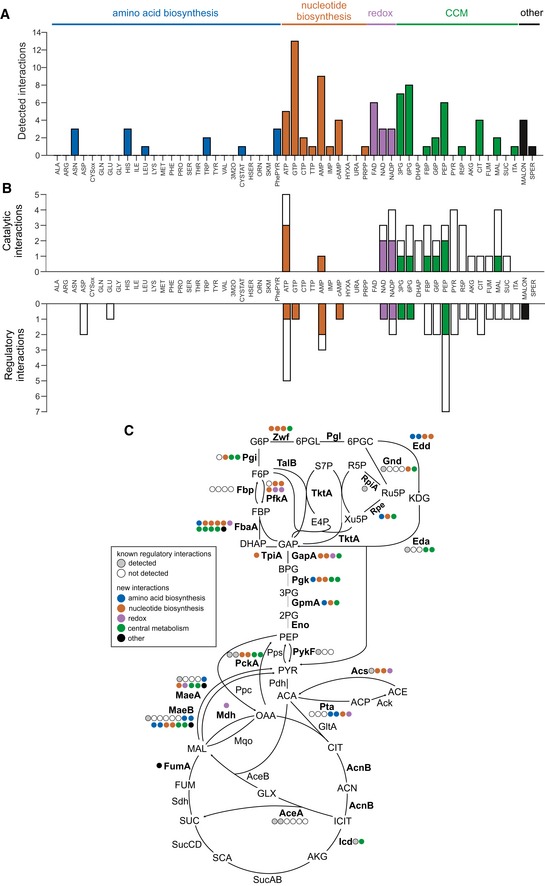
Number of interactions detected per metabolite. Metabolites are grouped according to biological pathways; the height of the bar indicates the total number of interactions.
Recovery of interactions reported in EcoCyc database. Metabolites are grouped according to biological pathways, the total height of the bar indicates the number of known interactions that could have been detected, and the height of the colored bar indicates the number of actually recovered interactions. Recovery of catalytic (metabolite is substrate or product of the enzyme) and regulatory interactions is shown.
Distribution of known regulatory and newly predicted interactions in Escherichia coli central metabolism. Enzymes included in this study are depicted in bold. Gray and white circles indicate how many known interactions were recovered or not recovered, respectively. Newly detected interactions are depicted using circles that are color‐coded according to the origin of the respective metabolite.
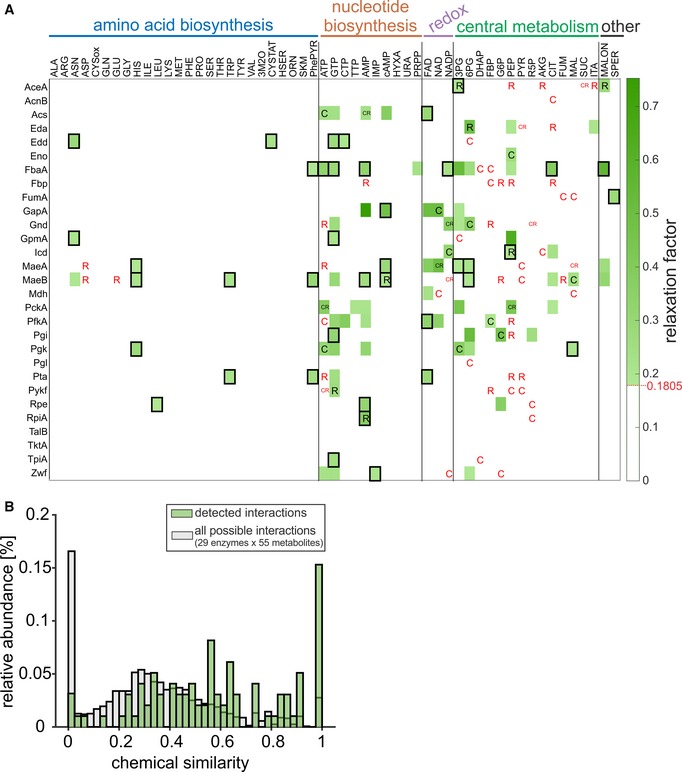
Interactions between 29 central enzymes (in rows) and 55 metabolites (in columns), grouped according to metabolic pathways (n = 2, measurement replicates from the same sample). The relaxation factor of every interaction is indicated in green. Previously reported catalytic and regulatory interactions are denoted with “C” and “R”, respectively; black and red letters indicate interactions that were detected and not detected, respectively. Black rectangles indicate potential allosteric interactions (maximum chemical similarity between the interactor and substrates/products of the target is lower than 0.5).
Histogram showing the relative occurrences of maximum chemical similarity scores in the protein–metabolite interaction map. Gray bars indicate the distribution of scores considering all possible enzyme–metabolite pairs, and green bars indicate the distribution scores for interactions with ΔRF > 0.1805 (false‐positive rate < 5%).
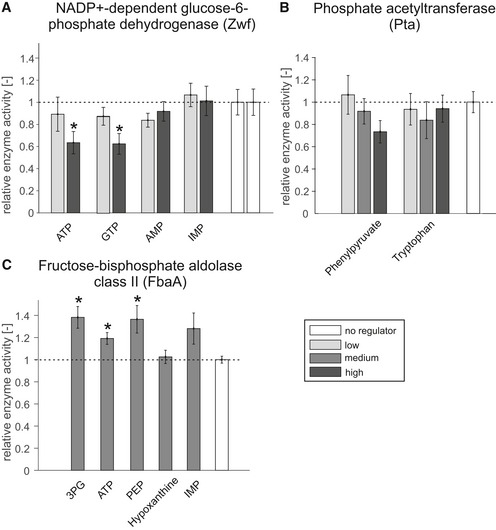
Relative activity of NADP+‐dependent glucose‐6‐phosphate dehydrogenase in the presence of potential regulators; error bars represent the s.e.m. All regulators were tested at two concentrations in four distinct replicates (n = 4, ATP: 5 mM, 18 mM; GTP: 2 mM, 10 mM; IMP and AMP: 1 mM, 5 mM), and the asterisk denotes significant inhibition (18 mM ATP: P‐value = 0.029; 10 mM GTP: P‐value = 0.025, one‐tailed t‐test).
Relative activity of phosphate acetyltransferase in the presence of phenylpyruvate and tryptophan; error bars represent the s.e.m. All regulators were tested at three concentrations in three distinct replicates (n = 3, phenylpyruvate: 0.1, 1, 5 mM;
l ‐tryptophan: 0.1, 1, 4.4 mM).Relative activity of fructose‐bisphosphate aldolase class II in the presence of 5 mM of potential regulators, except hypoxanthine, which was tested at 3.22 mM. All regulators were tested in three distinct replicates (n = 3), and error bars represent the s.e.m. The asterisk denotes significant activation (5 mM 3PG: P‐value = 0.025; 5 mM ATP: P‐value = 0.024; 5 mM PEP: P‐value = 0.046, one‐tailed t‐test).
References
Publication types
MeSH terms
Substances
LinkOut - more resources
Full Text Sources
Molecular Biology Databases
