

Fatty liver index is a strong predictor of changes in glycemic status in people with prediabetes: The IT-DIAB study
- PMID: 31465427
- PMCID: PMC6715190
- DOI: 10.1371/journal.pone.0221524
Fatty liver index is a strong predictor of changes in glycemic status in people with prediabetes: The IT-DIAB study
Abstract
Background & aims: In patients at metabolic risk, nonalcoholic fatty liver disease is a strong and highly prevalent predictor for type 2 diabetes. Its assessment in clinical practice is not easy but the fatty liver index (FLI) could be used as a surrogate. Here, we studied the association between the FLI and the conversion to new-onset diabetes (NOD) or prediabetes reversion in patients with prediabetes.
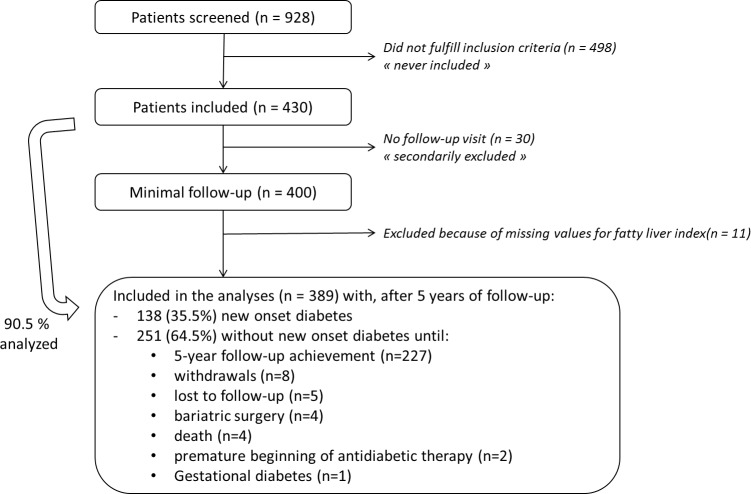
Methods: The IT-DIAB observational study included 389 individuals with prediabetes, defined as fasting plasma glucose (FPG) between 110 and 125 mg/dL. NOD conversion was defined as a first FPG value ≥ 126 mg/dL and prediabetes reversion as a first FPG value < 110 mg/dL. The associations of both events with baseline FLI were studied separately using multivariate Cox models.
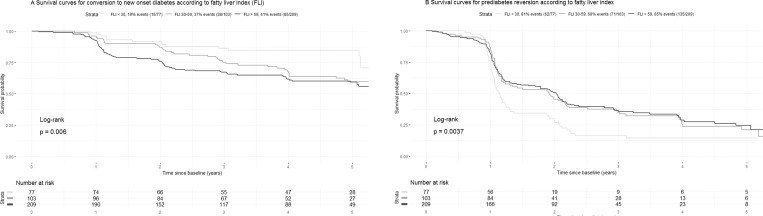
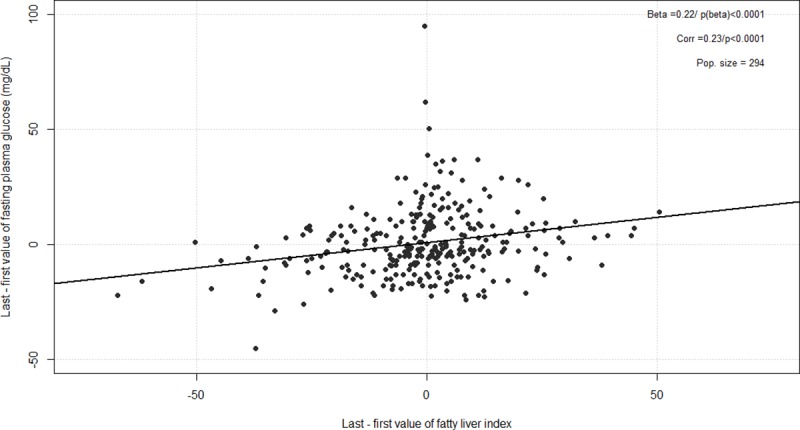
Results: After a median follow-up of 3.9 years (range 0.1-6.1), 138 individuals (35.5%) converted to NOD. FLI was associated with a higher risk of NOD conversion (unadjusted HR per SD = 1.54, 95%CI 1.27-1.86, p<0.0001), even after multiple adjustment on FPG, HbA1c and diabetes risk score (adjusted HR per SD 1.31, 95%CI 1.07-1.61, p = 0.008). FLI was also associated with prediabetes reversion: adjusted HR per SD = 0.85, 95%CI 0.75-0.96, p = 0.0077. Changes in FLI were significantly associated with changes in FPG during follow-up (p<0.0001). When compared to a full model including the diabetes risk score, FPG, HbA1C and FLI, only HbA1C added a significant prediction information (AUROC: 72.8% for full model vs 69.4% for the model without HbA1C; p = 0.028), while the removal of FLI to the full model did not alter its predictive value (AUROC 72.2%). The predictive value for NOD conversion was not significantly better for HOMA-IR compared to FLI (AUROC: 69.3 vs 63.7%, p = 0.067).
Conclusions: FLI is a simple, practical score to further stratify the risk of conversion to NOD or the possibility of prediabetes reversion in clinical practice, independently of classical glucose parameters.
Trial registration: ClincialTrials.gov number NCT01218061 and NCT01432509.
Conflict of interest statement
BC has received research funding from Amgen, Pfizer and Sanofi and Regeneron Pharmaceuticals Inc. and has served on scientific advisory boards and received honoraria or consulting fees from Abbott, Akcea, Amgen, AstraZeneca, Genfit, Pierre Fabre, Eli Lilly and Company, MSD Merck & Co., Novo Nordisk, Regeneron, Sanofi and Servier. JB personnally or collectively received research grants, honoraria and fees from the following companies in the last 3 years: Abbvie, Allergan, Bio-Rad, Diafir, Echosens, Gilead, Intercept, Novo Nordisk, Pfizer, Siemens. SH personnally or collectively received research grants, honoraria and fees from the following companies in the last 3 years: Astra Zeneca, Bayer, Boehringer Ingelheim, Dinno Santé, Eli Lilly, LVL, Johnson & Johnson, Medtronic, MSD, Novo Nordisk, Novartis, Pierre Fabre Santé, Sanofi, Servier, Valbiotis. MW, SS, MP, EBC, CA, VD, YZ and VJ had nothing to disclose. We confirm that the elements in the Disclosure section do not alter our adherence to all PLoS One policies on sharing data and materials.
Figures
References
Publication types
MeSH terms
Substances
Associated data
LinkOut - more resources
Full Text Sources
Medical
