. 2019 Aug 29;15(8):e1007267.
doi: 10.1371/journal.pcbi.1007267. eCollection 2019 Aug.

Anatomically accurate model of EMG during index finger flexion and abduction derived from diffusion tensor imaging

Affiliations

Anatomically accurate model of EMG during index finger flexion and abduction derived from diffusion tensor imaging

Diego Pereira Botelho et al. PLoS Comput Biol. .

Abstract

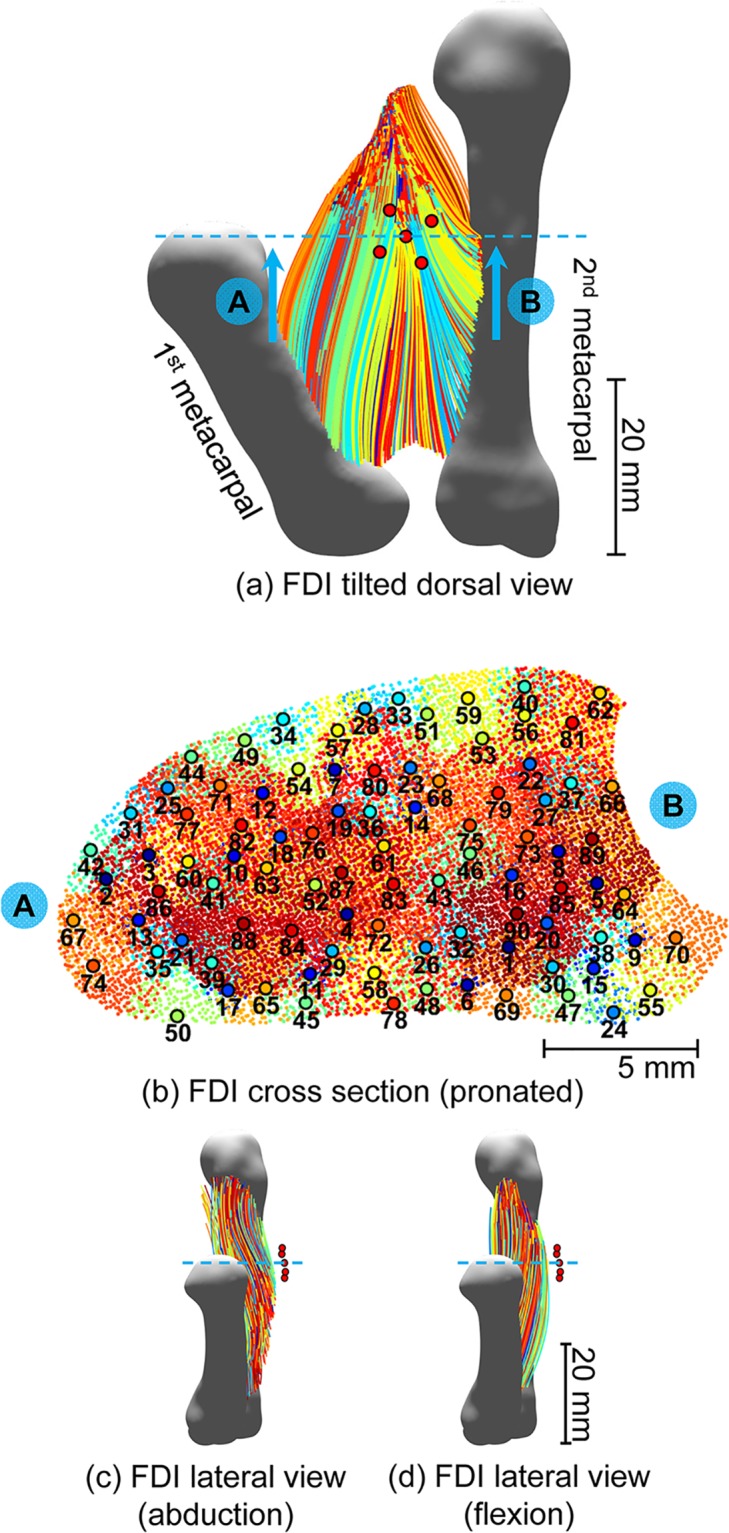
This study presents a modelling framework in which information on muscle fiber direction and orientation during contraction is derived from diffusion tensor imaging (DTI) and incorporated in a computational model of the surface electromyographic (EMG) signal. The proposed model makes use of the principle of reciprocity to simultaneously calculate the electric potentials produced at the recording electrode by charges distributed along an arbitrary number of muscle fibers within the muscle, allowing for a computationally efficient evaluation of extracellular motor unit action potentials. The approach is applied to the complex architecture of the first dorsal interosseous (FDI) muscle of the hand to simulate EMG during index finger flexion and abduction. Using diffusion tensor imaging methods, the results show how muscle fiber orientation and curvature in this intrinsic hand muscle change during flexion and abduction. Incorporation of anatomically accurate muscle architecture and other hand tissue morphologies enables the model to capture variations in extracellular action potential waveform shape across the motor unit population and to predict experimentally observed differences in EMG signal features when switching from index finger abduction to flexion. The simulation results illustrate how structural and electrical properties of the tissues comprising the volume conductor, in combination with fiber direction and curvature, shape the detected action potentials. Using the model, the relative contribution of motor units of different sizes located throughout the muscle under both conditions is examined, yielding a prediction of the detection profile of the surface EMG electrode array over the muscle cross-section.


Conflict of interest statement

The authors have declared that no competing interests exist.

Figures

Fig 1
Fig 1. 3D models derived from MRI/DWI data with reference cadaveric specimen.
(a) Isosurface rendering of the MRI data with fiber tracks of the superficial (red) and deep (pink) heads of the FDI muscle at rest (the positions of the first and second metacarpals are highlighted). Elliptical objects around the subject’s hand are oil capsules utilized as geometrical reference. (b) Closer view of muscle fiber tracks of both heads of the FDI. (c) Superficial and deep heads of the FDI muscle in a cadaveric specimen. Note consistency in fiber direction, origin, and insertion in both superficial and deep heads of the muscle in the DTI derived image and the cadaveric specimen. (d) Segmented hand model derived from MRI data. (e) Finite element discretization of the hand model (tetrahedral mesh). EMG electrodes used in simulations and experimental recordings are indicated by the red discs. (f) The FDI muscle (beige) is presented with the muscle fiber tracks derived from the DTI analysis (red and pink) and the vector field (blue) generated from the interpolation/extrapolation of these tracks directions over the entire FDI volume. This vector field determines the direction of highest electrical conductivity and the trajectories of virtual muscle fibers within the FDI.
Fig 2
Fig 2. Model of the FDI muscle fibers.
(a) Dorsal view of the simulated fibers (3D model tilted 35 degrees right). Blue dashed line indicates the position of the cross-section shown in (b) and the red discs illustrate position of the EMG electrodes. (b) FDI cross-section directly under the EMG array: individual fibers crossing the transverse plane are indicated by the colored dots. The centers of motor unit territories (colored discs with black edges) are numbered in order of motor unit recruitment. (c) Lateral view of the FDI muscle fibers model during abduction (radial side). (d) Lateral view of the FDI muscle fibers model during flexion (radial side). FDI muscle fibers shown in (c) and (d) were plotted with a down-sampling rate of 50 for clarity. Fibers belonging to the same motor unit are shown in the same color.
Fig 3
Fig 3. Simulated signals obtained from five distinct EMG models of varying geometrical and electrical characteristics.
(a) Electric potential produced by the activation of a representative motor unit (MU 52) at a single monopolar electrode. Features of the electromyograms (monopolar channels) generated using the five models: RMS voltage (b) and median frequency (c). Model I—Analytical infinite volume conductor model (isotropic); Model II—Homogeneous FE model; Model III—Inhomogeneous FE model; Model IV—Inhomogeneous FE model with anisotropic FDI (anisotropy ratio 4.4); Model V—Inhomogeneous FE model with high FDI anisotropy (anisotropy ratio 10).
Fig 4
Fig 4. FDI muscle fiber tracks derived from the DWI data in three states: At rest, index finger abduction and index flexion and influence on simulated signals.
DTI derived fiber tracks in the superficial head of the FDI are shown in red and in the deep head in pink: (a) palmar view (3D model tilted 35 degrees right) and (b) dorsal view. (c) Dorsal view (3D model tilted 10° left) of the FDI region displaying virtual muscle fibers corresponding to a representative motor unit (MU 52) under three conditions: rest (red), index finger abduction (green) and index flexion (blue). (d) Corresponding simulated motor unit action potentials (bipolar channels).
Fig 5
Fig 5. Experimentally recorded and simulated electrophysiological signals for the same subject.
(a) Representative spike-triggered averaged motor unit action potentials for two bipolar channels decomposed by the EMG system. (b) Representative simulated motor unit action potentials from two bipolar channels. (c) Sample experimentally recorded electromyogram. (d) Sample simulated electromyogram. Experimental (blue) and simulated (red) EMG RMS voltages (e) and median frequencies (f). The dotted red box in (e) corresponds to the amplitudes of the simulated EMG signals when the population of recruited motor units was reduced to 50% (i.e., 45 motor units) of that considered in the other simulations (solid red boxes– 90 motor units).
Fig 6
Fig 6. Influence of physiological and anatomical factors on the EMG amplitude.
(a) MUAP peak-to-peak amplitude (maximum across four bipolar channels) as a function of distance from the electrode. The number of fibers in each motor unit is indicated by the diameter of the discs and the muscle state is indicated by their color: green for index finger abduction and blue for flexion. The electrical profile of the muscle over the cross-section directly under the electrode array is shown in (b) and (c) for abduction and flexion, respectively. This profile illustrates the normalized electric potential detected at the EMG array (averaged over the five electrodes) by virtual point current sources distributed over the muscle cross-section. The reference voltage Vmax corresponds to the maximum voltage produced by these point sources across the two muscle states. Dashed lines mark levels of 5% decay in the voltage produced at the array. Center points and territories of simulated motor units are also shown. MUs for which the amplitude of their surface action potentials lay below the noise level are indicated by dotted black lines. Amplitudes of the surface action potentials for the remaining motor units are indicated by the color of the center point and the territory line, according to the color scale on the left side of the figure—same scale used in (a).
Fig 7
Fig 7. Influence of physiological and anatomical factors on EMG amplitude when muscle anisotropy is neglected.
Data are as presented in Fig 6. (a) MUAP peak-to-peak amplitude as a function of distance from the electrode. The number of fibers in each motor unit is indicated by the diameter of the discs and the muscle state is indicated by color. The electrical profile of the muscle over the cross-section directly under the electrode array is shown in (b) and (c) for abduction and flexion, respectively. The reference voltage Vmax corresponds to the maximum voltage produced by these point sources across the two muscle states. Dashed lines mark levels of 5% decay in the voltage produced at the array. MUs for which the amplitude of their surface action potentials lay below the noise level have their territories indicated by dotted black lines. The remaining MUs have their surface AP levels indicated by the color of the center point and the territory line, according to the color scale given at the left side of the figure.

References

    1. Boyd DC, Lawrence PD, Bratty PJA. On Modeling the Single Motor Unit Action Potential. IEEE Transactions on Biomedical Engineering. 1978;BME-25: 236–243. 10.1109/TBME.1978.326327 - DOI - PubMed
    1. Griep PA, Gielen FL, Boom HB, Boon KL, Hoogstraten LL, Pool CW, et al. Calculation and registration of the same motor unit action potential. Electroencephalogr Clin Neurophysiol. 1982;53: 388–404. 10.1016/0013-4694(82)90004-9 - DOI - PubMed
    1. Nandedkar SD, Stalberg E. Simulation of single muscle fibre action potentials. Med Biol Eng Comput. 1983;21: 158–165. 10.1007/BF02441531 - DOI - PubMed
    1. Gootzen THJM, Stegeman DF, Van Oosterom A. Finite limb dimensions and finite muscle length in a model for the generation of electromyographic signals. Electroencephalography and Clinical Neurophysiology/Evoked Potentials Section. 1991;81: 152–162. 10.1016/0168-5597(91)90008-L - DOI - PubMed
    1. Roeleveld K, Blok JH, Stegeman DF, van Oosterom A. Volume conduction models for surface EMG; confrontation with measurements. Journal of Electromyography and Kinesiology. 1997;7: 221–232. 10.1016/S1050-6411(97)00009-6 - DOI - PubMed

Publication types

MeSH terms