. 2020 Apr;71(4):1350-1363.
doi: 10.1002/hep.30918. Epub 2019 Oct 28.

A Bile Duct-on-a-Chip With Organ-Level Functions

Affiliations

A Bile Duct-on-a-Chip With Organ-Level Functions

Yu Du et al. Hepatology. 2020 Apr.

Abstract

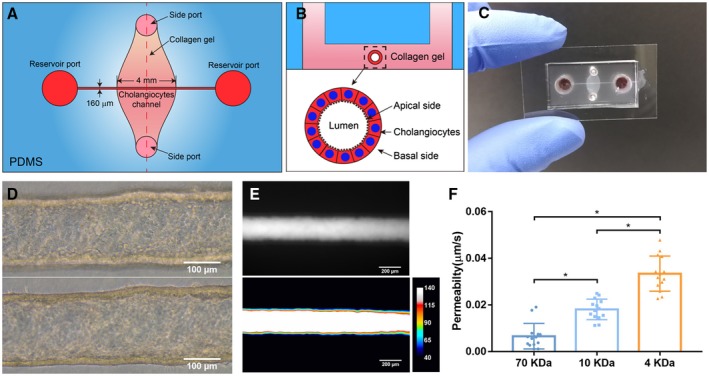
Background and aims: Chronic cholestatic liver diseases, such as primary biliary cholangitis (PBC) and primary sclerosing cholangitis (PSC), are frequently associated with damage to the barrier function of the biliary epithelium. Here, we report on a bile duct-on-a-chip that phenocopies not only the tubular architecture of the bile duct in three dimensions, but also its barrier functions.

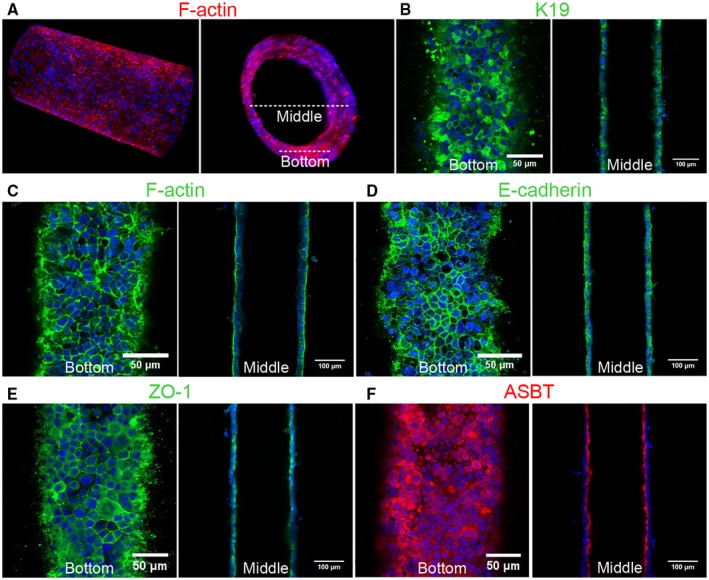
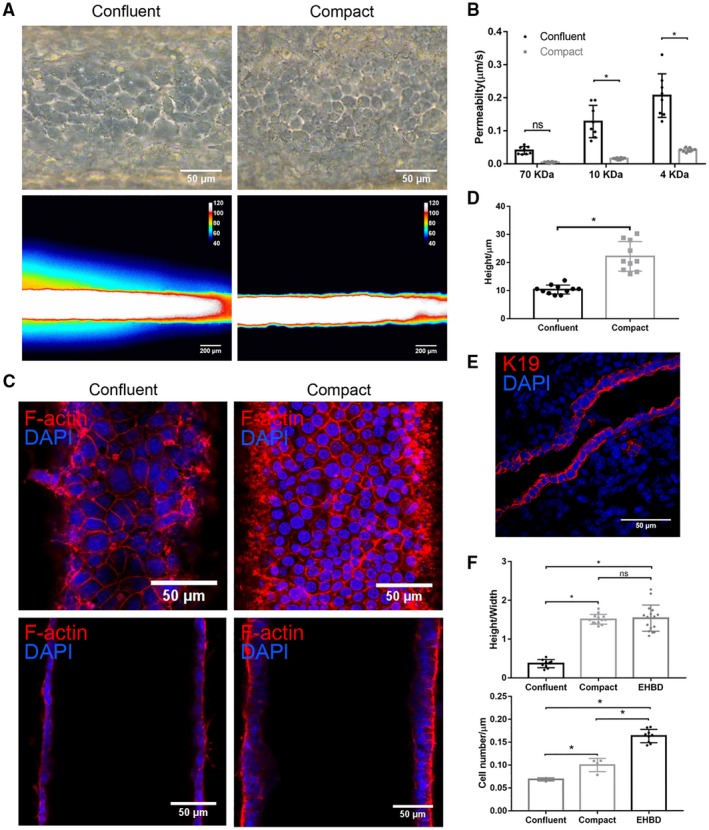
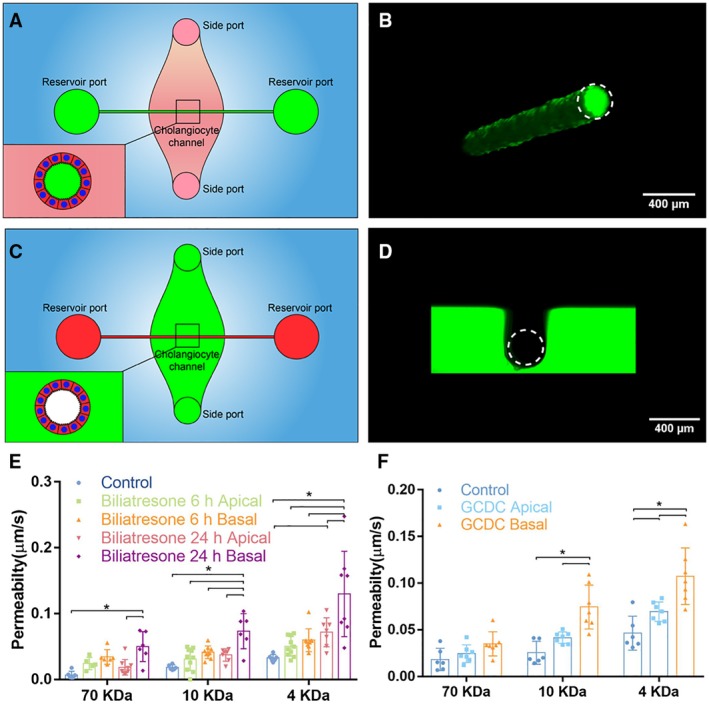
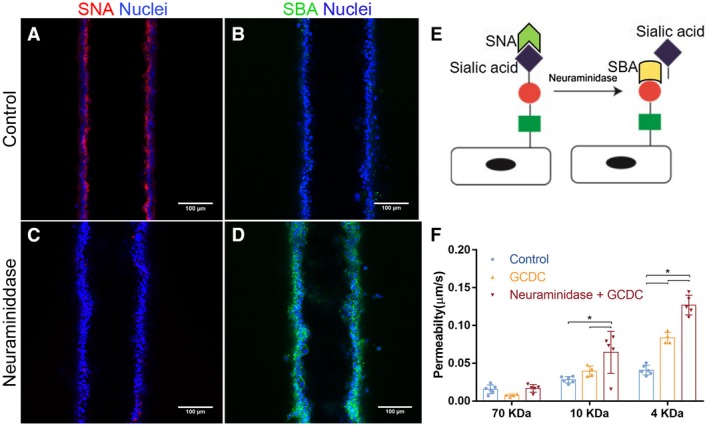
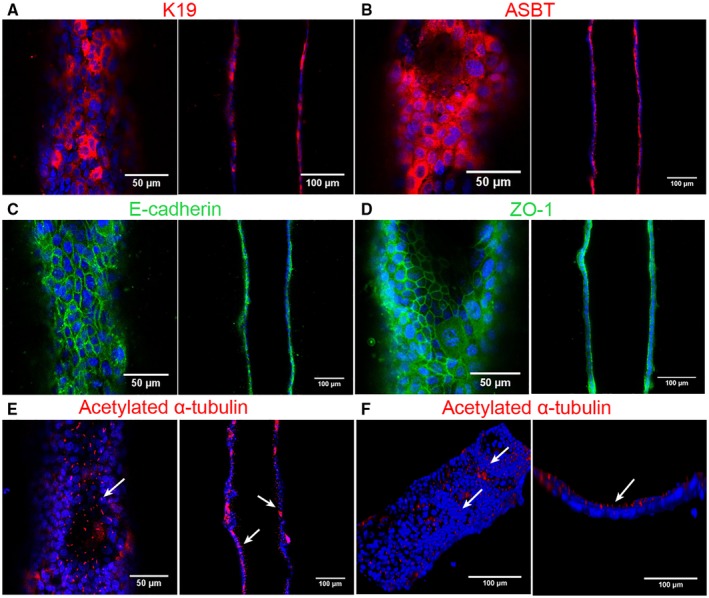
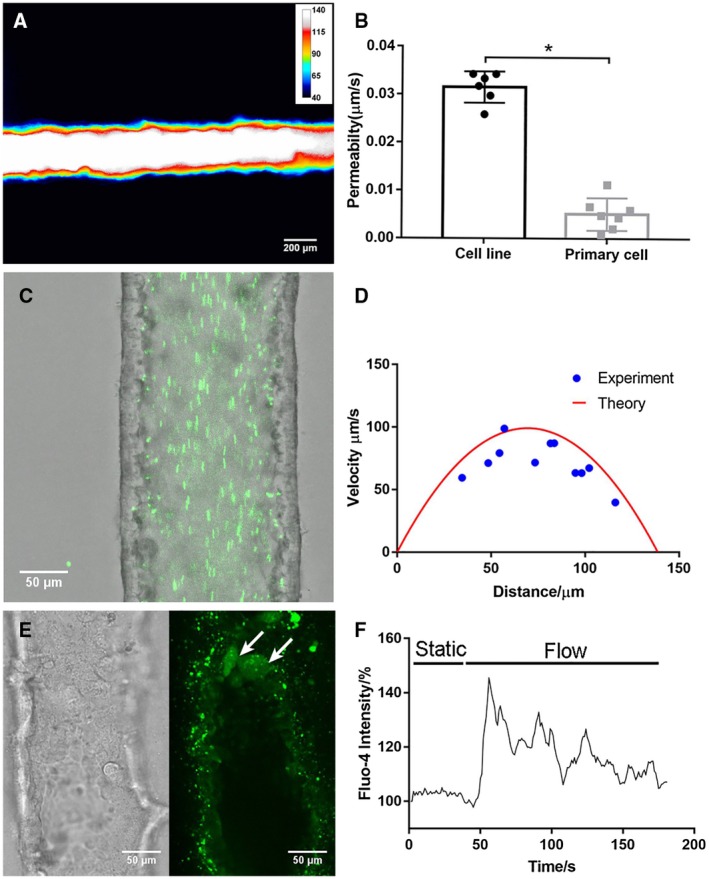
Approach and results: We showed that mouse cholangiocytes in the channel of the device became polarized and formed mature tight junctions, that the permeability of the cholangiocyte monolayer was comparable to ex vivo measurements, and that cholangiocytes in the device were mechanosensitive (as demonstrated by changes in calcium flux under applied luminal flow). Permeability decreased significantly when cells formed a compact monolayer with cell densities comparable to those observed in vivo. This device enabled independent access to the apical and basolateral surfaces of the cholangiocyte channel, allowing proof-of-concept toxicity studies with the biliary toxin, biliatresone, and the bile acid, glycochenodeoxycholic acid. The cholangiocyte basolateral side was more vulnerable than the apical side to treatment with either agent, suggesting a protective adaptation of the apical surface that is normally exposed to bile. Further studies revealed a protective role of the cholangiocyte apical glycocalyx, wherein disruption of the glycocalyx with neuraminidase increased the permeability of the cholangiocyte monolayer after treatment with glycochenodeoxycholic acid.

Conclusions: This bile duct-on-a-chip captured essential features of a simplified bile duct in structure and organ-level functions and represents an in vitro platform to study the pathophysiology of the bile duct using cholangiocytes from a variety of sources.


Figures

Figure 1
Figure 1
Fabrication and characterization of a 3D biomimetic bile duct‐on‐a‐chip. (A) Schematic of top view of the bile duct‐on‐a‐chip. (B) Schematic of the device in cross‐section. (C) Image of an actual bile duct‐on‐a‐chip, top view. (D) Representative bright‐field image of the channel (bottom [upper panel] and middle [lower panel]) lined by a layer of mouse cholangiocytes (cell line). Scale bar, 100 μm. (E) Representative image of FITC‐dextran (70 kDa) in the channel, imaged after 10 minutes (upper panel), with pseudo color shown in lower panel. Scale bar, 200 μm. (F) Permeability of the cholangiocyte (cell line)‐lined channel to FITC‐dextran (70, 10, and 4 kDa), n = 14 devices, each device tested sequentially with FITC‐dextran from 70 to 4 kDa. All data are presented as mean ± SD; *P < 0.05.
Figure 2
Figure 2
Characterization of a channel lined with mouse cholangiocytes (cell line). (A) Representative confocal images of cholangiocytes in the bile duct‐on‐a‐chip forming a monolayer within the cylindrical channel, stained for F‐actin (red) and nuclei (DAPI; blue). Longitudinal (left panel) and cross‐sectional (right panel) views. White dashed lines indicate the bottom surface and cross‐section through the center shown in the remaining panels. (B‐F) Immunofluorescent images across the bottom (left panels in B‐F) and middle (right panels in B‐F) of the channel stained with antibodies against (B) K19, (C) F‐actin, (D) E‐cadherin, (E) ZO‐1, and (F) the ASBT. Nuclei shown by DAPI staining (blue). Images are representative of at least three independently constructed devices for each condition. Scale bars: 50 μm, left panels; 100 μm, right panels.
Figure 3
Figure 3
Cholangiocyte monolayers require high confluency for mature barrier function. (A) Representative bright‐field images (upper panels) and pseudo color images after FITC‐dextran (4 kDa) perfusion for 2 minutes (lower panels) of confluent and compact cholangiocyte channels. Scale bar: 100 μm (upper panels), 200 μm (lower panels). (B) Permeability of confluent and compact cholangiocyte channel to FITC‐dextran (70, 10, and 4 kDa), n = 8 devices. (C) Bottom (upper panels) and middle (lower panels) views of confluent and compact cholangiocyte monolayers in the devices, stained for F‐actin (red) and nuclei (DAPI; blue). Scale bars, 50 μm. (D) Cell height of confluent and compact cholangiocyte monolayers in the devices, n ≥ 10. (E) Adult mouse extrahepatic bile duct, stained for K19 (red) and nuclei (DAPI; blue), representative images from n = 9. Scale bar, 50 μm. (F) Cell height/width ratio (upper panel) and cell density (lower panel) in confluent and compact cholangiocyte channels and mice EHBD, n = 4‐9. Images are representative of at least three independent experiments. All data are presented as mean ± SD; *P < 0.05.
Figure 4
Figure 4
The apical and basal surfaces of cholangiocytes can be treated independently. (A) Schematic showing access to the apical side of cholangiocytes through the reservoir ports. (B) Confocal image of FITC‐dextran solution (green) in the lumen after administration through the reservoir ports. Scale bar, 400 μm. (C) Schematic showing access to the basal side of cholangiocytes through the side ports. (D) Confocal image of FITC‐dextran solution (green) in the collagen bulk and surrounding, but not within, the lumen after administration through the side ports. Scale bar, 400 μm. (E) Diffusive permeability across monolayers treated with biliatresone by apical or basal surfaces for 6 or 24 hours, as measured using FITC‐dextran (70, 10, and 4 kDa) in the lumen, n ≥ 6 devices for each condition. (F) Diffusive permeability across monolayers treated with 1 mM of GCDC by apical or basal surfaces for 1 hour, as measured using FITC‐dextran (70, 10, and 4 kDa) in the lumen, n ≥ 6 devices for each condition. All data are presented as a mean ± SD; *P < 0.05.
Figure 5
Figure 5
An intact glycocalyx protects cholangiocytes from bile acids. (A‐D) Staining using the lectins, SNA and SBA, in the bile duct‐on‐a‐chip (A,B) before and (C,D) after neuraminidase treatment. Scale bars, 100 μm. (E) Schematic showing that SNA recognizes sialyated carbohydrates, and that removal of sialic acid is required for recognition by SBA. (F) Diffusive permeability of devices treated with the bile acid, GCDC, with or without previous desialyation with neuraminidase, n = 4‐6 devices for each condition. All data are presented as mean ± SD; *P < 0.05.
Figure 6
Figure 6
Bile duct‐on‐a‐chip with primary murine extrahepatic cholangiocytes. Immunofluorescence images across the bottom (left panels) and middle (right panels) of channels stained with antibodies (shown in red or green) against (A) K19, (B) ASBT, (C) E‐cadherin, (D) ZO‐1, and (E,F) acetylated α‐tubulin, with DAPI nuclear staining (blue). Top (left panel, F) and cross‐sectional (right panel, F) views of cilia (white arrow) in the cholangiocyte channel. Scale bars, 50 μm (left panels, except F); 100 μm (right panels and F, left panel). Images are representative of three independent experiments.
Figure 7
Figure 7
A bile duct‐on‐a‐chip constructed with primary extrahepatic cholangiocytes demonstrated better barrier function than the cell line. (A) Representative pseudo color image of FITC‐dextran (4 kDa) in a channel, imaged after 10 minutes (n = 7). Scale bars, 200 μm. (B) Permeability of the cholangiocyte cell line and primary extrahepatic cholangiocyte‐lined channel to 4‐kDa FITC‐dextran, n ≥ 6 devices. (C) Fluorescent microbeads (green, 0.2 μm) flowing through the cholangiocyte channel (cell line) at 0.02 dyne/cm2. Scale bar, 50 μm. (D) Theoretical and experimental velocity profile of luminal fluid flow in the cholangiocyte channel at 0.02 dyne/cm2. (E) Bright‐field image and fluorescent image of activated primary cholangiocytes (white arrow) visualized with Fluo‐4 fluorescence in the channel under shear flow. (F) Representative tracing of intracellular Fluo‐4 fluorescence in response to luminal flow at 3.9 dyne/cm2. All data are presented as mean ± SD; *P < 0.05.

Comment in

References

    1. Matsumoto K, Imasato M, Yamazaki Y, Tanaka H, Watanabe M, Eguchi H, Nagano H, et al. Claudin 2 deficiency reduces bile flow and increases susceptibility to cholesterol gallstone disease in mice. Gastroenterology 2014;147:1134‐1145.e10. - PubMed
    1. Herr KJ, Tsang YH, Ong JW, Li Q, Yap LL, Yu W, et al. Loss of alpha‐catenin elicits a cholestatic response and impairs liver regeneration. Sci Rep 2014;4:6835. - PMC - PubMed
    1. Nakagawa H, Hikiba Y, Hirata Y, Font‐Burgada J, Sakamoto K, Hayakawa Y, et al. Loss of liver E‐cadherin induces sclerosing cholangitis and promotes carcinogenesis. Proc Natl Acad Sci U S A 2014;111:1090‐1095. - PMC - PubMed
    1. Sakisaka S, Kawaguchi T, Taniguchi E, Hanada S, Sasatomi K, Koga H, et al. Alterations in tight junctions differ between primary biliary cirrhosis and primary sclerosing cholangitis. Hepatology 2001;33:1460‐1468. - PubMed
    1. Nakanuma Y, Tsuneyama K, Gershwin ME, Yasoshima M. Pathology and immunopathology of primary biliary cirrhosis with emphasis on bile duct lesions: recent progress. Semin Liver Dis 1995;15:313‐328. - PubMed

Publication types