Comparative Study
. 2019 Aug 29;62(8S):2986-2998.
doi: 10.1044/2019_JSLHR-S-CSMC7-18-0356. Epub 2019 Aug 29.

Neuroanatomical Correlates of Childhood Stuttering: MRI Indices of White and Gray Matter Development That Differentiate Persistence Versus Recovery

Affiliations
Comparative Study

Neuroanatomical Correlates of Childhood Stuttering: MRI Indices of White and Gray Matter Development That Differentiate Persistence Versus Recovery

Emily O Garnett et al. J Speech Lang Hear Res. .

Abstract

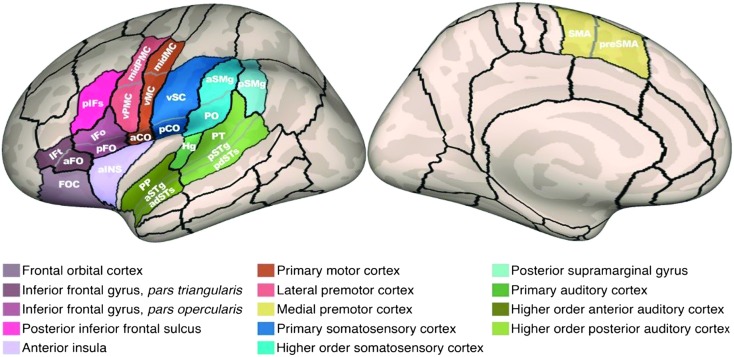
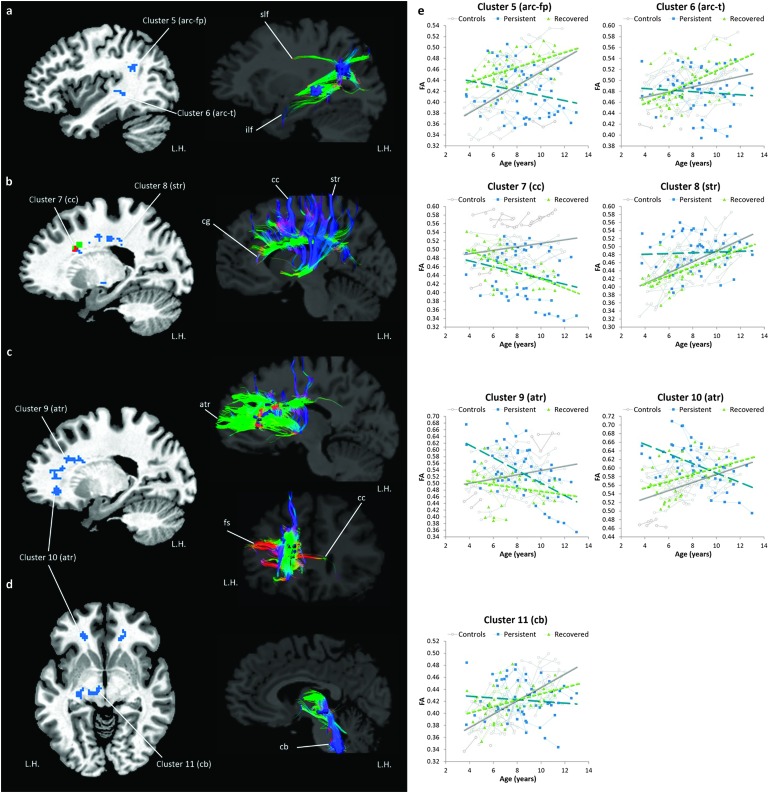
Purpose We review two recent neuroanatomical studies of children who stutter (CWS), one that examines white matter integrity and the other that focuses on cortical gray matter morphology. In both studies, we sought to examine differences between children whose stuttering persists ("persistent"), children who recovered from stuttering ("recovered"), and their nonstuttering peers ("controls"). Method Both of the reviewed studies use data from a large pediatric sample spanning preschool- to school-age children (3-10 years old at initial testing). Study 1 focused on surface-based measures of cortical size (thickness) and shape (gyrification) using structural magnetic resonance imaging, whereas Study 2 utilized diffusion tensor imaging to examine white matter integrity. Results In both studies, the main difference that emerged between CWS and fluent peers encompassed left hemisphere speech motor areas that are interconnected via the arcuate fasciculus. In the case of white matter integrity, the temporoparietal junction and posterior superior temporal gyrus, both connected via the left arcuate fasciculus, and regions along the corpus callosum that contain fibers connecting bilateral motor regions were significantly decreased in white matter integrity in CWS compared to controls. In the morphometric study, children who would go on to have persistent stuttering specifically had lower cortical thickness in ventral motor and premotor areas of the left hemisphere. Conclusion These results point to aberrant development of cortical areas involved in integrating sensory feedback with speech movements in CWS and differences in interhemispheric connectivity between the two motor cortices. Furthermore, developmental trajectories in these areas seem to diverge between persistent and recovered cases.


Figures

Figure 1.
Figure 1.
Functional regions of interest (fROIs; color-coded shading). The fROIs and associated anatomical parcels are shown on an inflated reconstruction of a representative left hemisphere cortical surface. aCO = anterior central operculum; adSTs = anterior dorsal superior temporal sulcus; aINS = anterior insula; aFO = anterior frontal operculum; aSMg = anterior supramarginal gyrus; aSTg = anterior superior temporal gyrus convexity; FOC = frontal orbital cortex; Hg = Heschl's gyrus; IFo = inferior frontal gyrus pars opercularis convexity; IFt = inferior frontal gyrus pars triangularis convexity; midMC = middle motor cortex; midPMC = middle premotor cortex; pCO = posterior central operculum; pdSTs = posterior dorsal superior temporal sulcus; pFO = posterior frontal operculum; pIFs = posterior inferior frontal sulcus; PO = parietal operculum; PP = planum polare; preSMA = pre–supplementary motor area; pSMg = posterior supramarginal gyrus; pSTg = posterior superior temporal gyrus convexity; PT = planum temporale; SMA = supplementary motor area; vMC = ventral motor cortex; vPMC = ventral premotor cortex; vSC = ventral somatosensory cortex. Reprinted from Garnett et al., “Anomalous Morphology in Left Hemisphere Motor and Premotor Cortex of Children Who Stutter,” Brain, Vol. 141, pp. 2670–2684, by permission of Oxford University Press. Copyright © 2018 Oxford University Press.
Figure 2.
Figure 2.
Summary of significant group differences in the left hemisphere cortical morphology. Areas showing significant group differences are plotted on an inflated cortical surface template. See caption of Figure 1 for anatomical parcel abbreviations. aCO = anterior central operculum; midPMC = middle premotor cortex temporale; SMA = supplementary motor area; vMC = ventral motor cortex; vPMC = ventral premotor cortex. Reprinted from Garnett et al., ‘Anomalous Morphology in Left Hemisphere Motor and Premotor Cortex of Children Who Stutter,’ Brain, Vol. 141, pp. 2670–2684, by permission of Oxford University Press. Copyright © 2018 Oxford University Press.
Figure 3.
Figure 3.
Premotor, motor, and medial motor cortical areas showing significant group differences in morphometry. Significant morphometric group differences (P-FDR < .05) were identified in analyses of covariance of group differences in the left hemisphere speech network morphology, plotted as a function of age. See caption of Figure 1 for anatomical parcel abbreviations. aCO = anterior central operculum; midPMC = middle premotor cortex temporale; SMA = supplementary motor area; vMC = ventral motor cortex; vPMC = ventral premotor cortex. Reprinted Garnett et al., “Anomalous Morphology in Left Hemisphere Motor and Premotor Cortex of Children Who Stutter,” Brain, Vol. 141, pp. 2670–2684, by permission of Oxford University Press. Copyright © 2018 Oxford University Press.
Figure 4.
Figure 4.
Overall fractional anisotropy (FA) reductions in children with persistent stuttering and children who recovered from stuttering relative to controls (group effect). (a, b) The left column shows the white matter areas where significant FA reductions were found in the persistent group (blue), the recovered group (green), and both groups (red). The right column illustrates the white matter fibers passing through the areas showing FA reductions based on DTI tractography of a 9-year-old female control participant. (c) Individual FA values in the clusters of FA reductions located in the left arcuate fasciculus and the mid body of the corpus callosum were plotted against age. White circles, blue squares, and green triangles indicate individual FA values in the control, persistent, and recovered groups, respectively. Data points of the same participant are connected by thin solid gray lines. Linear trend lines were added to illustrate the developmental trajectories of FA in each group (controls: gray line, persistent: blue dashed line, and recovered: green dotted line). arc-fp = arcuate fasciculus in the frontoparietal areas; arc-t = arcuate fasciculus in the temporal lobe; cc = corpus callosum; cg = cingulum; ilf = inferior longitudinal fasciculus; L.H. = left hemisphere. Reprinted from Chow and Chang (2017), “White Matter Developmental Trajectories Associated With Persistence and Recovery of Childhood Stuttering,” Human Brain Mapping, by permission of John Wiley and Sons. Copyright © 2017 Wiley Periodicals, Inc.
Figure 5.
Figure 5.
Fractional anisotropy (FA) growth rate reduction in children with persistent stuttering and children who recovered from stuttering relative to controls (Group × Age interactions). (a–d) The left column shows the white matter areas where significant lower FA growth rates were found in the persistent group (blue), the recovered group (green), and both groups (red). The right column illustrates the white matter fibers passing through the areas showing reductions of FA growth rate based on diffusion tensor imaging tractography of a 9-year-old female control participant. (e) Individual FA values in the speech motor regions showing reductions of FA growth rate were plotted against age. White circles, blue squares, and green triangles indicate individual FA values in the control, persistent, and recovered groups, respectively. Data points of the same participant are connected by thin solid lines. Linear trend lines were added to illustrate the developmental trajectories of FA in each group (controls: gray line, persistent: blue dashed line, and recovered: green dotted line). arc-fp = arcuate fasciculus in the frontoparietal areas; arc-t = arcuate fasciculus in the temporal lobe; atr = anterior thalamic radiation; cb = cerebral peduncle; cc = corpus callosum; cg = cingulum; fs = frontal lobe short fibers; ilf = inferior longitudinal fasciculus; L.H. = left hemisphere; str = superior thalamic radiation. Reprinted from Chow and Chang (2017), “White Matter Developmental Trajectories Associated With Persistence and Recovery of Childhood Stuttering,” Human Brain Mapping, by permission of John Wiley and Sons. Copyright © 2017 Wiley Periodicals, Inc.

Similar articles

Cited by

References

    1. Barnea-Goraly N., Menon V., Eckert M., Tamm L., Bammer R., Karchemskiy A., … Reiss A. L. (2005). White matter development during childhood and adolescence: A cross-sectional diffusion tensor imaging study. Cerebral Cortex, 15, 1848–1854. - PubMed
    1. Beal D. S., Gracco V. L., Brettschneider J., Kroll R. M., & De Nil L. F. (2013). A voxel-based morphometry (VBM) analysis of regional grey and white matter volume abnormalities within the speech production network of children who stutter. Cortex, 49(8), 2151–2161. - PMC - PubMed
    1. Bernal-Rusiel J. L., Greve D. N., Reuter M., Fischl B., Sabuncu M. R., & Alzheimer's Disease Neuroimaging Initiative. (2013). Statistical analysis of longitudinal neuroimage data with linear mixed effects models. NeuroImage, 66, 249–260. - PMC - PubMed
    1. Bohland J. W., Bullock D., & Guenther F. H. (2010). Neural representations and mechanisms for the performance of simple speech sequences. Journal of Cognitive Neuroscience, 22(7), 1504–1529. - PMC - PubMed
    1. Brody B. A., Kinney H. C., Kloman A. S., & Gilles F. H. (1987). Sequence of central nervous system myelination in human infancy. I. An autopsy study of myelination. Journal of Neuropathology and Experimental Neurology, 46, 283–301. - PubMed

Publication types