

Limited Pre-Speech Auditory Modulation in Individuals Who Stutter: Data and Hypotheses
- PMID: 31465711
- PMCID: PMC6813031
- DOI: 10.1044/2019_JSLHR-S-CSMC7-18-0358
Limited Pre-Speech Auditory Modulation in Individuals Who Stutter: Data and Hypotheses
Abstract
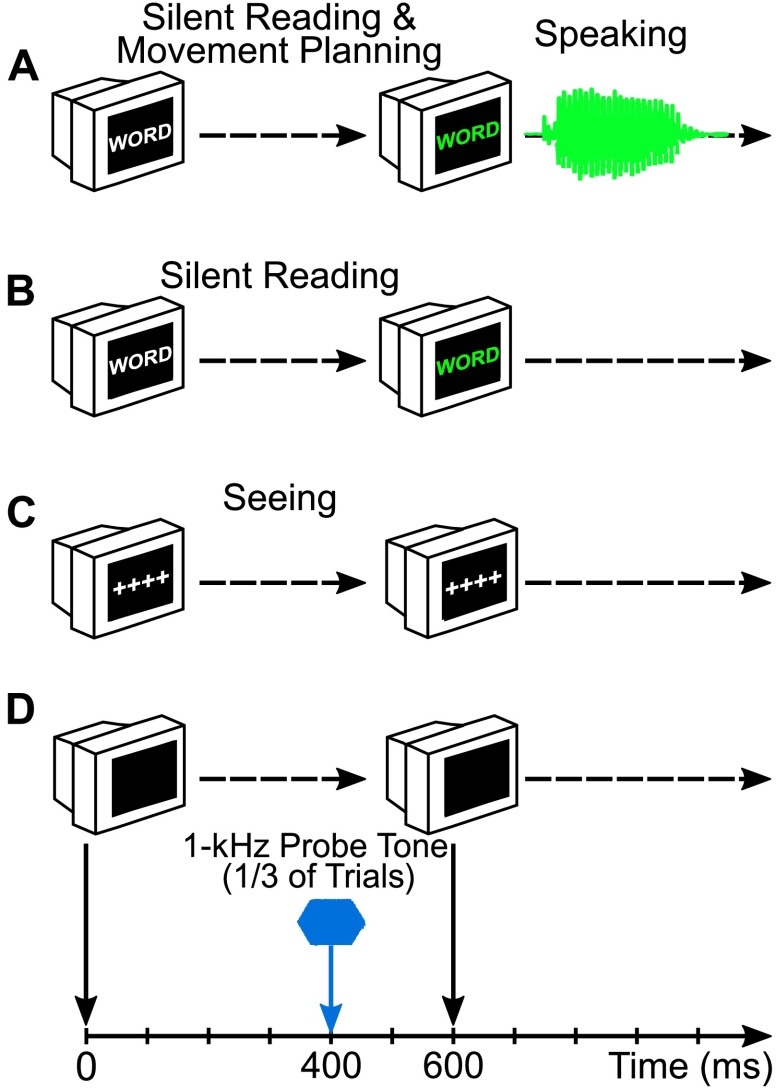
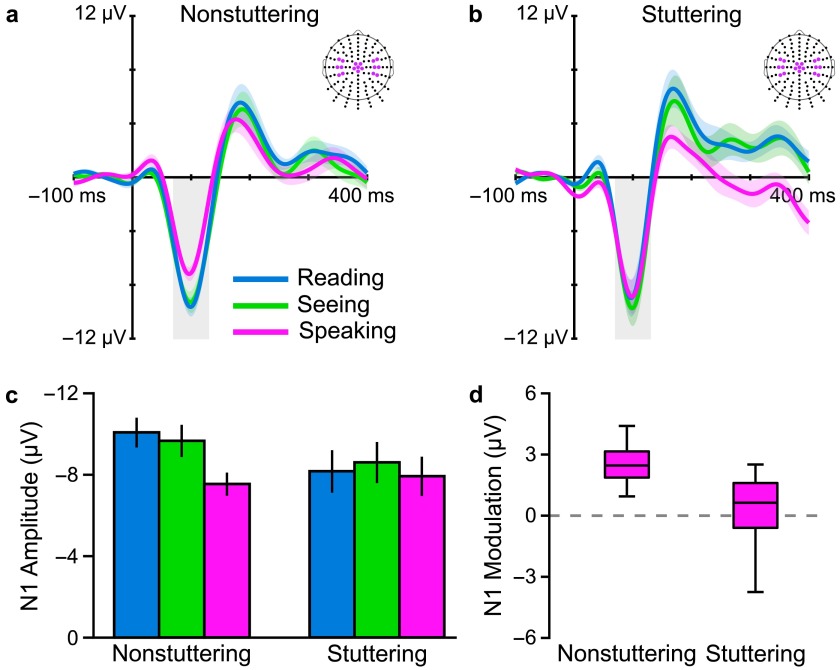
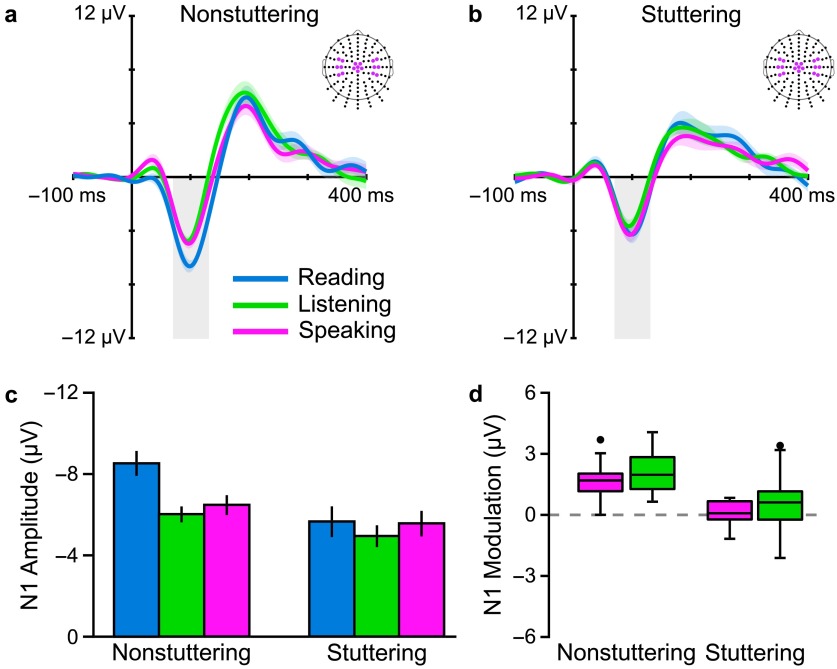
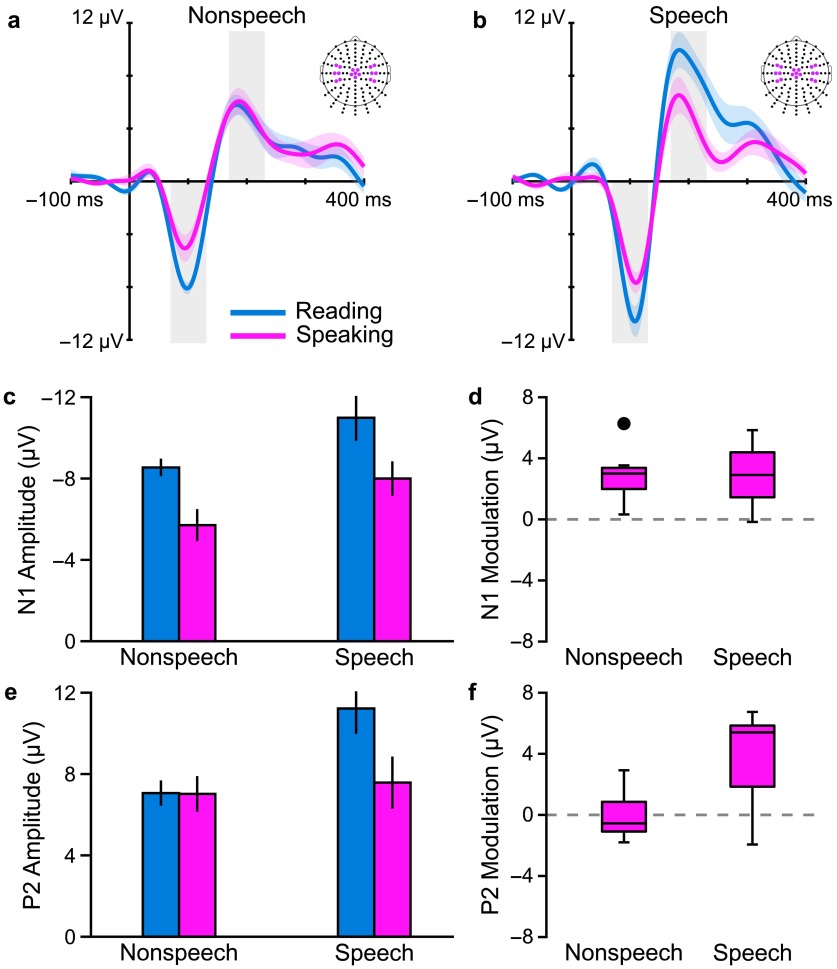
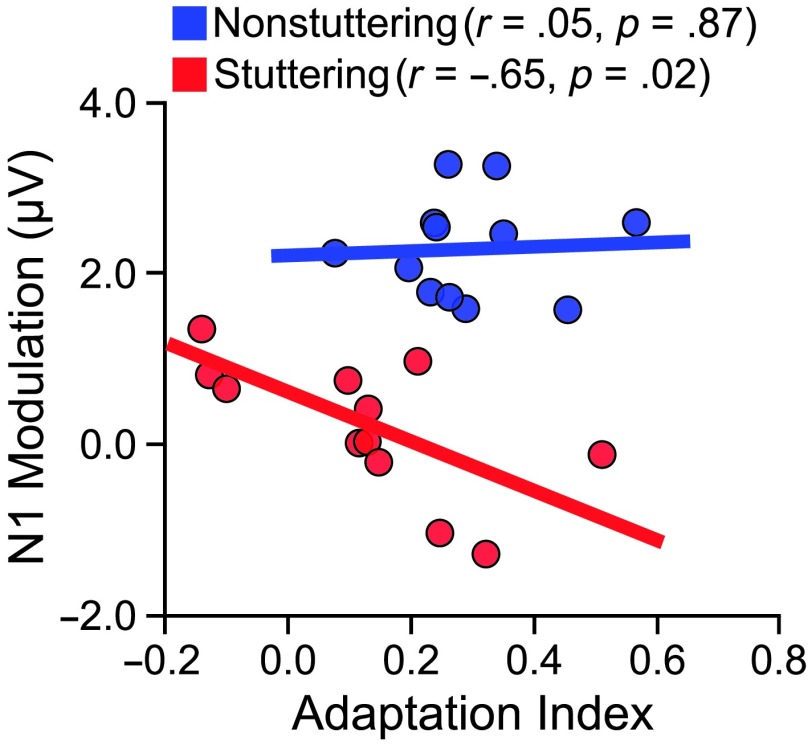
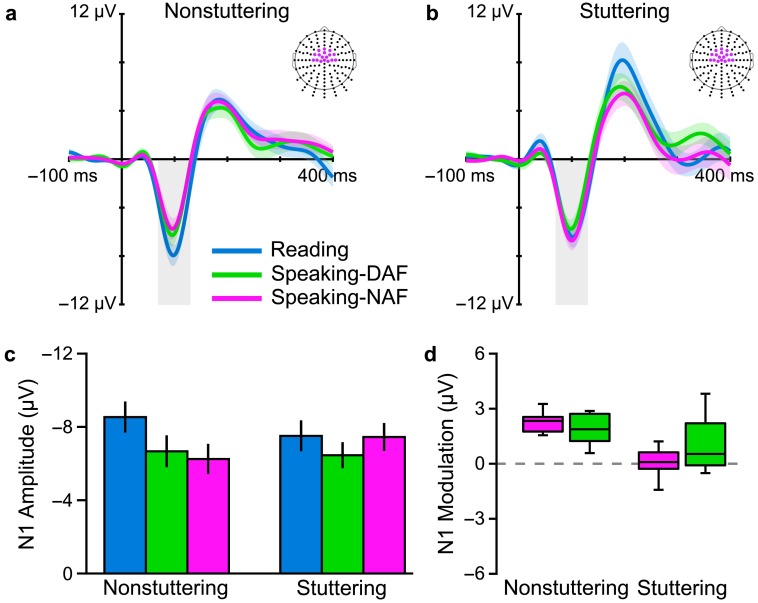
Purpose We review and interpret our recent series of studies investigating motor-to-auditory influences during speech movement planning in fluent speakers and speakers who stutter. In those studies, we recorded auditory evoked potentials in response to probe tones presented immediately prior to speaking or at the equivalent time in no-speaking control conditions. As a measure of pre-speech auditory modulation (PSAM), we calculated changes in auditory evoked potential amplitude in the speaking conditions relative to the no-speaking conditions. Whereas adults who do not stutter consistently showed PSAM, this phenomenon was greatly reduced or absent in adults who stutter. The same between-group difference was observed in conditions where participants expected to hear their prerecorded speech played back without actively producing it, suggesting that the speakers who stutter use inefficient forward modeling processes rather than inefficient motor command generation processes. Compared with fluent participants, adults who stutter showed both less PSAM and less auditory-motor adaptation when producing speech while exposed to formant-shifted auditory feedback. Across individual participants, however, PSAM and auditory-motor adaptation did not correlate in the typically fluent group, and they were negatively correlated in the stuttering group. Interestingly, speaking with a consistent 100-ms delay added to the auditory feedback signal-normalized PSAM in speakers who stutter, and there no longer was a between-group difference in this condition. Conclusions Combining our own data with human and animal neurophysiological evidence from other laboratories, we interpret the overall findings as suggesting that (a) speech movement planning modulates auditory processing in a manner that may optimize its tuning characteristics for monitoring feedback during speech production and, (b) in conditions with typical auditory feedback, adults who stutter do not appropriately modulate the auditory system prior to speech onset. Lack of modulation of speakers who stutter may lead to maladaptive feedback-driven movement corrections that manifest themselves as repetitive movements or postural fixations.
Figures
Similar articles
-
The Role of Sensory Feedback in Developmental Stuttering: A Review.Neurobiol Lang (Camb). 2021 Jun 9;2(2):308-334. doi: 10.1162/nol_a_00036. eCollection 2021. Neurobiol Lang (Camb). 2021. PMID: 37216145 Free PMC article. Review.
-
Stuttering adults' lack of pre-speech auditory modulation normalizes when speaking with delayed auditory feedback.Cortex. 2018 Feb;99:55-68. doi: 10.1016/j.cortex.2017.10.019. Epub 2017 Nov 13. Cortex. 2018. PMID: 29169049 Free PMC article.
-
Speech-Induced Suppression for Delayed Auditory Feedback in Adults Who Do and Do Not Stutter.Front Hum Neurosci. 2020 Apr 24;14:150. doi: 10.3389/fnhum.2020.00150. eCollection 2020. Front Hum Neurosci. 2020. PMID: 32390816 Free PMC article.
-
Modulation of auditory processing during speech movement planning is limited in adults who stutter.Brain Lang. 2015 Apr;143:59-68. doi: 10.1016/j.bandl.2015.03.002. Epub 2015 Mar 18. Brain Lang. 2015. PMID: 25796060 Free PMC article.
-
Pediatric Responses to Fundamental and Formant Frequency Altered Auditory Feedback: A Scoping Review.Front Hum Neurosci. 2022 May 17;16:858863. doi: 10.3389/fnhum.2022.858863. eCollection 2022. Front Hum Neurosci. 2022. PMID: 35664350 Free PMC article.
Cited by
-
Dissociated Development of Speech and Limb Sensorimotor Learning in Stuttering: Speech Auditory-motor Learning is Impaired in Both Children and Adults Who Stutter.Neuroscience. 2020 Dec 15;451:1-21. doi: 10.1016/j.neuroscience.2020.10.014. Epub 2020 Oct 20. Neuroscience. 2020. PMID: 33091464 Free PMC article.
-
The Role of Sensory Feedback in Developmental Stuttering: A Review.Neurobiol Lang (Camb). 2021 Jun 9;2(2):308-334. doi: 10.1162/nol_a_00036. eCollection 2021. Neurobiol Lang (Camb). 2021. PMID: 37216145 Free PMC article. Review.
-
Reactive Inhibitory Control Precedes Overt Stuttering Events.Neurobiol Lang (Camb). 2024 Jun 3;5(2):432-453. doi: 10.1162/nol_a_00138. eCollection 2024. Neurobiol Lang (Camb). 2024. PMID: 38911458 Free PMC article.
-
Auditory feedback control in adults who stutter during metronome-paced speech II. Formant Perturbation.J Fluency Disord. 2022 Dec;74:105928. doi: 10.1016/j.jfludis.2022.105928. Epub 2022 Aug 27. J Fluency Disord. 2022. PMID: 36063640 Free PMC article.
-
Perceptual formant discrimination during speech movement planning.PLoS One. 2024 Apr 2;19(4):e0301514. doi: 10.1371/journal.pone.0301514. eCollection 2024. PLoS One. 2024. PMID: 38564597 Free PMC article.
References
-
- Altenmüller E., Berger W., Prokop T., Trippel M., & Dietz V. (1995). Modulation of sural nerve somatosensory evoked potentials during stance and different phases of the step-cycle. Electroencephalography and Clinical Neurophysiology/Evoked Potentials, 96(6), 516–525. https://doi.org/10.1016/0013-4694(95)00093-E - PubMed
-
- Bays P. M., Wolpert D. M., & Flanagan J. R. (2005). Perception of the consequences of self-action is temporally tuned and event driven. Current Biology, 15(12), 1125–1128. https://doi.org/10.1016/j.cub.2005.05.023 - PubMed
-
- Blakemore S.-J., Wolpert D. M., & Frith C. D. (1998). Central cancellation of self-produced tickle sensation. Nature Neuroscience, 1(7), 635–640. https://doi.org/10.1038/2870 - PubMed
-
- Blakemore S.-J., Wolpert D. M., & Frith C. D. (1999). The cerebellum contributes to somatosensory cortical activity during self-produced tactile stimulation. NeuroImage, 10(4), 448–459. https://doi.org/10.1006/nimg.1999.0478 - PubMed
-
- Blakemore S.-J., Wolpert D. M., & Frith C. D. (2000). Why can't you tickle yourself? NeuroReport, 11(11), R11–R16. https://doi.org/10.1097/00001756-200008030-00002 - PubMed
Publication types
MeSH terms
Grants and funding
LinkOut - more resources
Full Text Sources
Medical
Research Materials
