. 2019 Aug 29;62(8S):3055-3070.
doi: 10.1044/2019_JSLHR-S-CSMC7-18-0442. Epub 2019 Aug 29.

Functional Parcellation of the Speech Production Cortex

Affiliations

Functional Parcellation of the Speech Production Cortex

Jason A Tourville et al. J Speech Lang Hear Res. .

Abstract

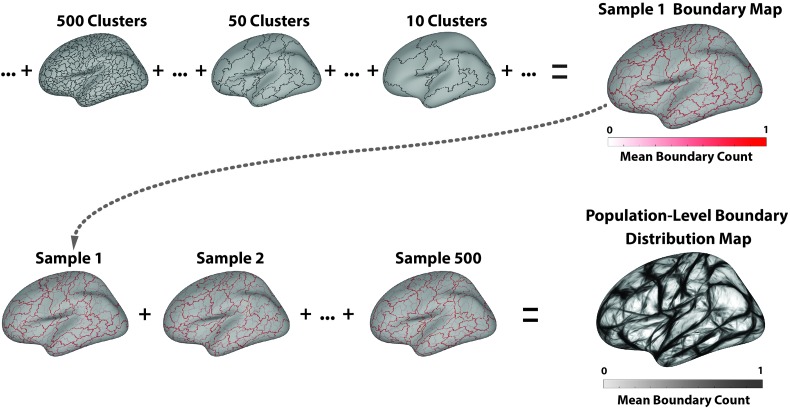
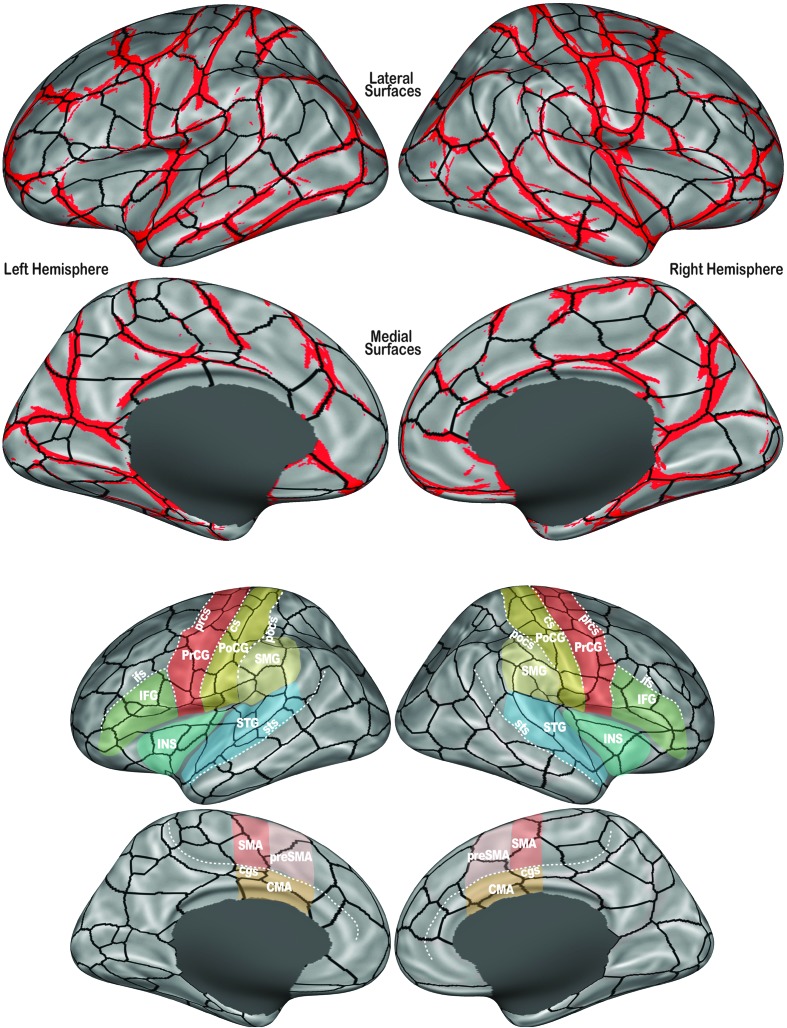
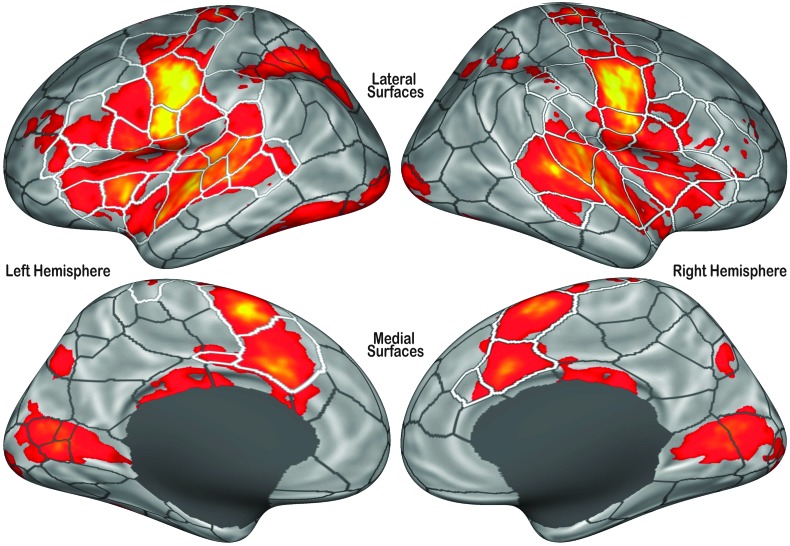
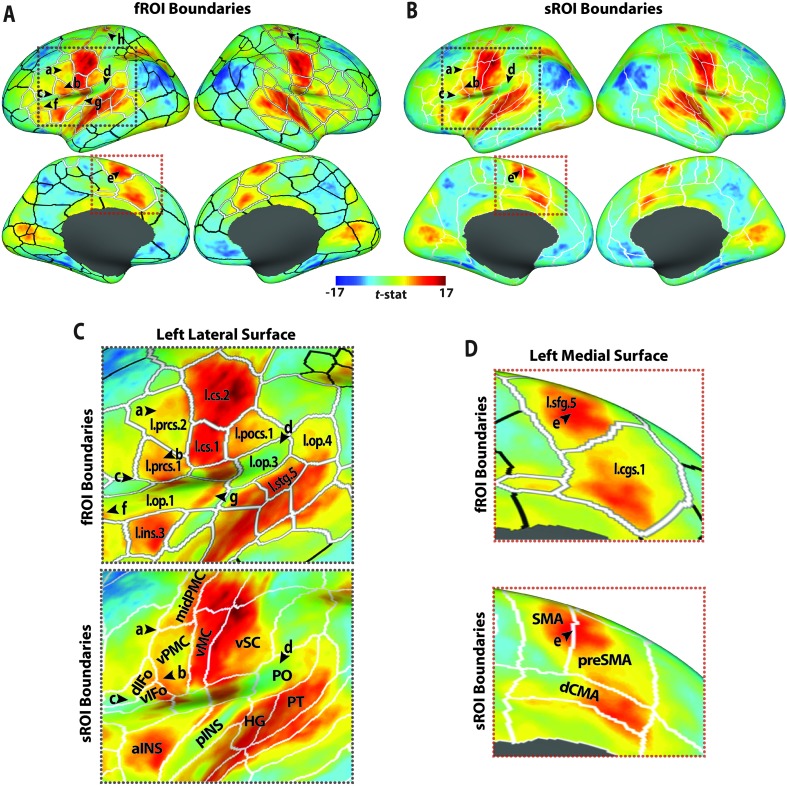
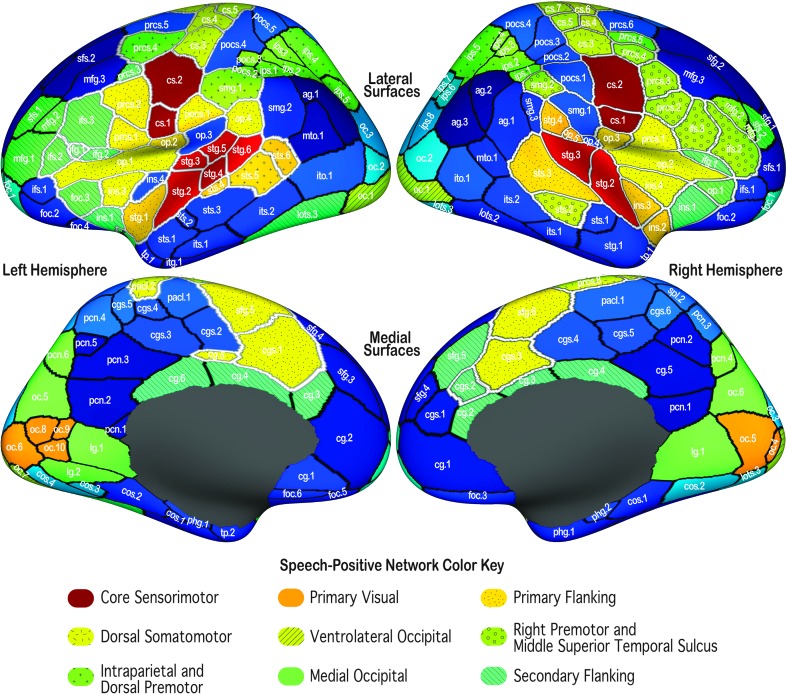
Neuroimaging has revealed a core network of cortical regions that contribute to speech production, but the functional organization of this network remains poorly understood. Purpose We describe efforts to identify reliable boundaries around functionally homogenous regions within the cortical speech motor control network in order to improve the sensitivity of functional magnetic resonance imaging (fMRI) analyses of speech production and thus improve our understanding of the functional organization of speech production in the brain. Method We used a bottom-up, data-driven approach by pooling data from 12 previously conducted fMRI studies of speech production involving the production of monosyllabic and bisyllabic words and pseudowords that ranged from single vowels and consonant-vowel pairs to short sentences (163 scanning sessions, 136 unique participants, 39 different speech conditions). After preprocessing all data through the same pipeline and registering individual contrast maps to a common surface space, hierarchical clustering was applied to contrast maps randomly sampled from the pooled data set in order to identify consistent functional boundaries across subjects and tasks. Boundary completion was achieved by applying adaptive smoothing and watershed segmentation to the thresholded population-level boundary map. Hierarchical clustering was applied to the mean within-functional region of interest (fROI) response to identify networks of fROIs that respond similarly during speech. Results We identified highly reliable functional boundaries across the cortical areas involved in speech production. Boundary completion resulted in 117 fROIs in the left hemisphere and 109 in the right hemisphere. Clustering of the mean within-fROI response revealed a core sensorimotor network flanked by a speech motor planning network. The majority of the left inferior frontal gyrus clustered with the visual word form area and brain regions (e.g., anterior insula, dorsal anterior cingulate) associated with detecting salient sensory inputs and choosing the appropriate action. Conclusion The fROIs provide insight into the organization of the speech production network and a valuable tool for studying speech production in the brain by improving within-group and between-groups comparisons of speech-related brain activity. Supplemental Material https://doi.org/10.23641/asha.9402674.


Figures

Figure 1.
Figure 1.
(Top) Illustration of the process for deriving a sample boundary distribution map. Only the left hemisphere is shown for simplicity. The boundary map from each step of the hierarchical clustering process is summed and divided by the total number of clustering steps (the number of initial vertices), resulting in a mean sample-level boundary map (upper right plot). Higher values in this map (darker lines) denote vertices that were marked as boundaries earlier in the clustering process; that is, they divide more functionally distinct regions than lighter lines. (Bottom) Illustration of the process for building the population-level distribution. The sample boundary maps are summed and divided by the total number of samples (500), resulting in the population-level boundary distribution map (lower right plot). Higher values in this map (darker lines) denote vertices that more reliably divide functionally distinct regions across the samples.
Figure 2.
Figure 2.
(Top) The location of significantly likely functional boundaries is shown in red (population-level boundary map thresholded at p FDR < .001) and completed functional region of interest (fROI) boundaries following watershed segmentation are shown in black on the inflated FreeSurfer fsaverage cortical surface template. The lateral (top) and medial (bottom) surfaces of the left (left) and right (right) hemispheres are visible. The grayscale surface shading indicates cortical topography: Bright shading indicates the convex curvature of gyral crowns; darker shading indicates the concave curvature of sulcal depths. The dark-filled gray area on each medial surface masks the noncortical region of the cerebral medial wall. (Bottom) The completed fROI boundaries are shown again with prominent sulci (dotted lines) and cortical regions (color-filled regions) involved in speech production labeled. Sulcus abbreviations: cgs = cingulate sulcus; cs = central sulcus; ifs = inferior frontal sulcus; pocs = postcentral sulcus; prcs = precentral sulcus; sts = superior temporal sulcus. Cortical region abbreviations: CMA = cingulate motor area; IFG = inferior frontal gyrus; INS = insula; PoCG = postcentral gyrus; PrCG = precentral gyrus; preSMA = presupplementary motor area; SMA = supplementary motor area; SMG = supramarginal gyrus; STG = superior temporal gyrus.
Figure 3.
Figure 3.
Completed functional region of interest (fROI) boundaries overlaid upon a t map of cortical vertices that were significantly more active during speech production compared to baseline (vertex-level threshold: p < .001; cluster-level correction: p FDR < .05). The boundaries of fROIs in cortical areas that are reliably active during speech production are highlighted in white.
Figure 4.
Figure 4.
Functional (A) and structural (B) region of interest (ROI) boundaries are shown overlaying the unthresholded pooled speech–baseline BOLD contrast t map on the inflated cortical surface. Black arrowheads labeled ae highlight examples of key speech-positive areas where the pooled speech–baseline response is better parceled by the functional boundaries than the structural boundaries. Arrowheads fi highlight examples of areas where the speech response is not well parceled by the functional ROIs (fROIs). (C) Enlarged illustrations of the portion of left lateral surface indicated by the gray dotted boxes in A (top) and B (bottom). (D) Enlarged illustrations of the portion of the left medial prefrontal cortex indicated by the orange dotted boxes in A (top) and B (bottom). Labels are provided for select functional (top) and structural (bottom) ROIs. fROI abbreviations (all left hemisphere): cgs = cingulate sulcus; cs = central sulcus; ins = insula; op = operculum; pocs = postcentral sulcus; prcs = precentral sulcus; sfg = superior frontal gyrus; stg = superior temporal gyrus. sROI abbreviations: aINS = anterior insula; dCMA = dorsal cingulate motor area; dIFo = dorsal inferior frontal gyrus, pars opercularis; HG = Heschl's gyrus; midPMC = middle premotor cortex; pINS = posterior insula; PO = parietal operculum; preSMA = presupplementary motor area; PT = planum temporale; SMA = supplementary motor area; vIFo = ventral inferior frontal gyrus, pars opercularis; vMC = ventral motor cortex; vPMC = ventral premotor cortex; vSC = ventral somatosensory cortex. fROIs that are consistently active during speech production are highlighted in thick white outlines (cf. Figure 3).
Figure 5.
Figure 5.
Functional networks of speech functional regions of interest (fROIs). fROIs were grouped using hierarchical clustering of the average within-ROI response for all speech–baseline contrasts. To illustrate fROIs with similar response patterns, colors were assigned to each fROI according to its position in the clustering dendrogram (see Supplemental Material S2). fROIs filled with similar/dissimilar colors exhibit similar/dissimilar speech response patterns. Patterned stippling was overlaid on some networks to improve differentiation. fROIs that are consistently active during speech production are highlighted in white outlines (cf. Figure 3).

References

    1. Basilakos A., Smith K. G., Fillmore P., Fridriksson J., & Fedorenko E. (2017). Functional characterization of the human speech articulation network. Cerebral Cortex, 28, 1816–1830. - PMC - PubMed
    1. Beal D. S., Segawa J. A., Tourville J. A., Cai S., & Guenther F. H. (2012). Speech motor sequence learning difficulties in persistent developmental stuttering: An fMRI study (Program No. 681.0). Meeting Planner, 42nd Annual Meeting of the Society for Neuroscience, New Orleans, LA.
    1. Benjamini Y., & Hochberg Y. (1995). Controlling the false discovery rate: A practical and powerful approach to multiple testing. Journal of the Royal Statistical Society. Series B (Methodological), 57, 289–300.
    1. Bohland J. W., Bullock D., & Guenther F. H. (2010). Neural representations and mechanisms for the performance of simple speech sequences. Journal of Cognitive Neuroscience, 22(7), 1504–1529. - PMC - PubMed
    1. Bohland J. W., & Guenther F. H. (2006). An fMRI investigation of syllable sequence production. NeuroImage, 32(2), 821–841. - PubMed

Publication types

LinkOut - more resources