Observational Study
. 2020 Mar;140(3):556-567.e9.
doi: 10.1016/j.jid.2019.08.433. Epub 2019 Aug 26.

The Role of Desmoglein 1 in Gap Junction Turnover Revealed through the Study of SAM Syndrome

Affiliations
Observational Study

The Role of Desmoglein 1 in Gap Junction Turnover Revealed through the Study of SAM Syndrome

Eran Cohen-Barak et al. J Invest Dermatol. 2020 Mar.

Abstract

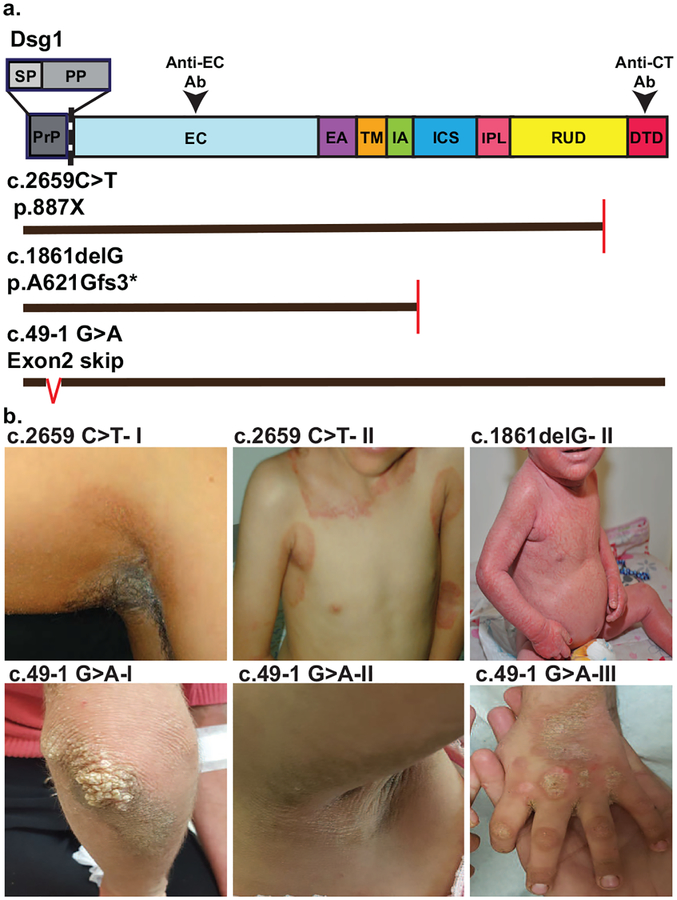
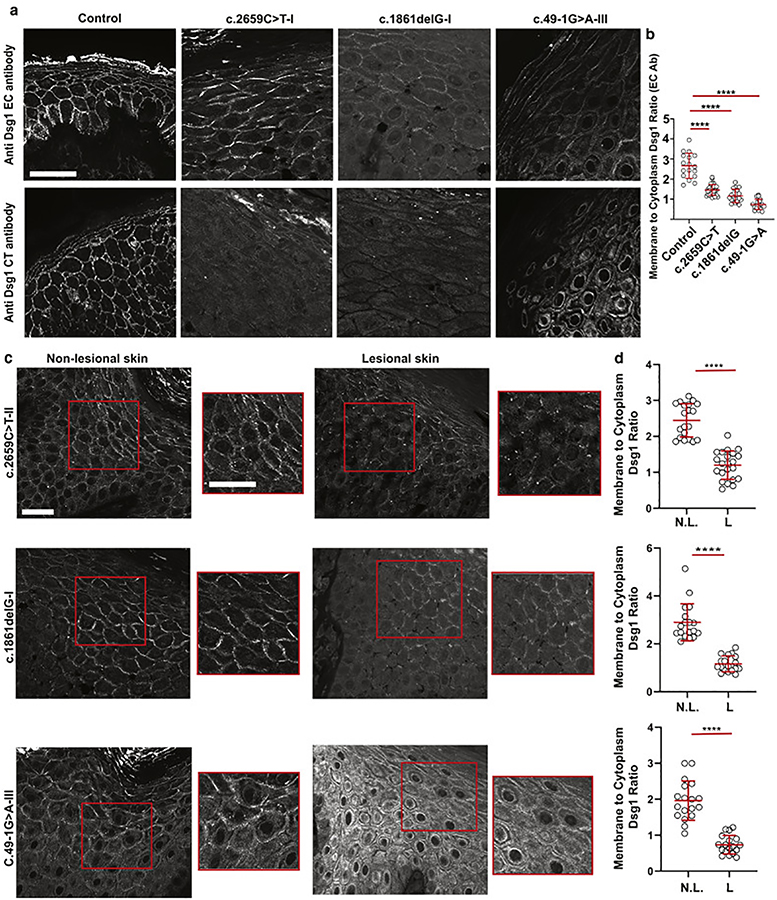
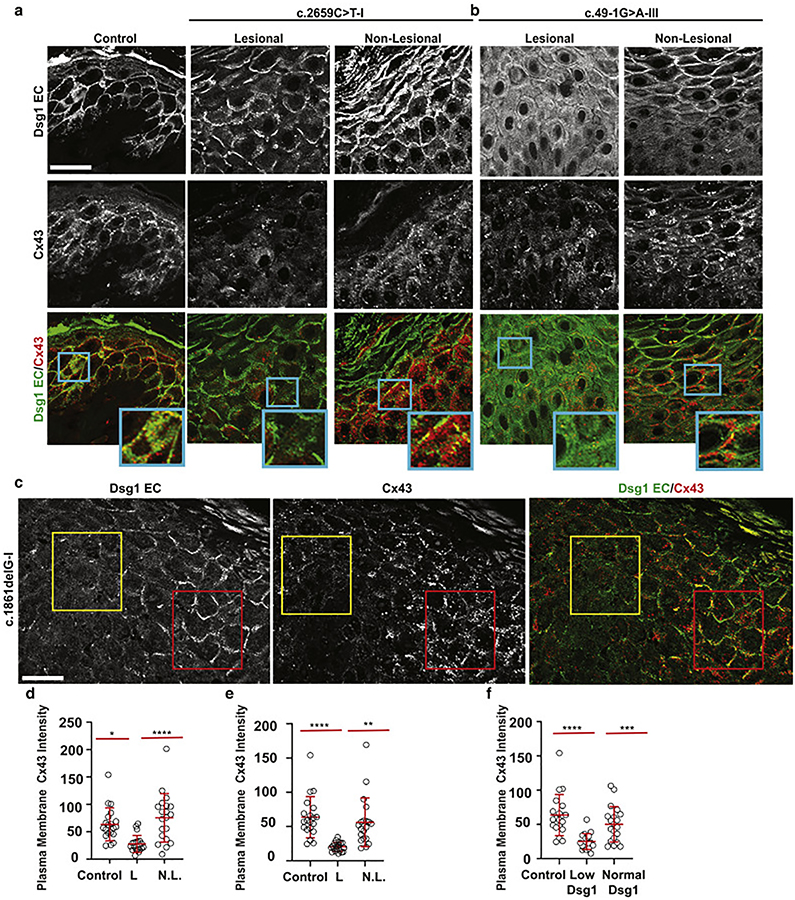
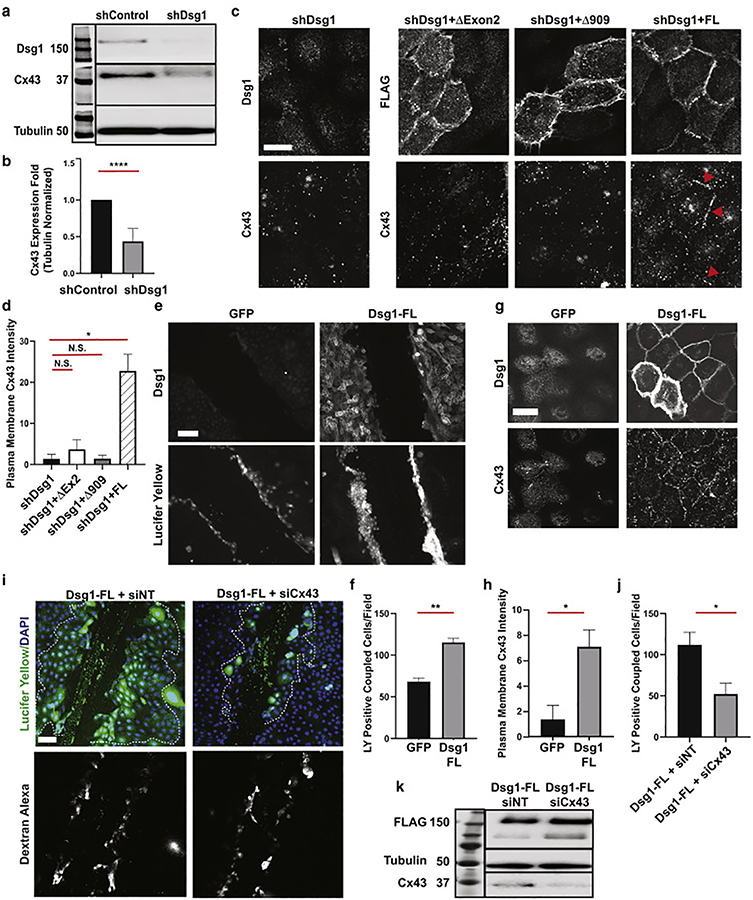
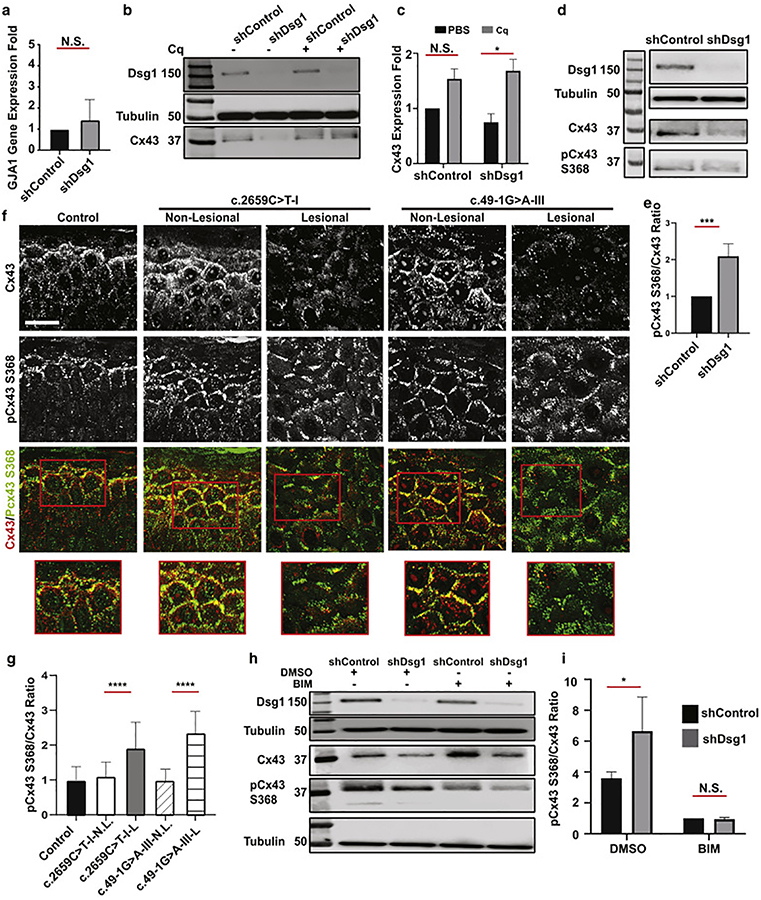
An effective epidermal barrier requires structural and functional integration of adherens junctions, tight junctions, gap junctions (GJ), and desmosomes. Desmosomes govern epidermal integrity while GJs facilitate small molecule transfer across cell membranes. Some patients with severe dermatitis, multiple allergies, and metabolic wasting (SAM) syndrome, caused by biallelic desmoglein 1 (DSG1) mutations, exhibit skin lesions reminiscent of erythrokeratodermia variabilis, caused by mutations in connexin (Cx) genes. We, therefore, examined whether SAM syndrome-causing DSG1 mutations interfere with Cx expression and GJ function. Lesional skin biopsies from SAM syndrome patients (n = 7) revealed decreased Dsg1 and Cx43 plasma membrane localization compared with control and nonlesional skin. Cultured keratinocytes and organotypic skin equivalents depleted of Dsg1 exhibited reduced Cx43 expression, rescued upon re-introduction of wild-type Dsg1, but not Dsg1 constructs modeling SAM syndrome-causing mutations. Ectopic Dsg1 expression increased cell-cell dye transfer, which Cx43 silencing inhibited, suggesting that Dsg1 promotes GJ function through Cx43. As GJA1 gene expression was not decreased upon Dsg1 loss, we hypothesized that Cx43 reduction was due to enhanced protein degradation. Supporting this, PKC-dependent Cx43 S368 phosphorylation, which signals Cx43 turnover, increased after Dsg1 depletion, while lysosomal inhibition restored Cx43 levels. These data reveal a role for Dsg1 in regulating epidermal Cx43 turnover.


Conflict of interest statement

CONFLICT OF INTEREST: The authors state no conflict of interest.

Figures

Figure 1.
Figure 1.. Some patients with SAM syndrome manifest clinical features of EKV.
a. Schematic of Dsg1 protein domains, mutation positions, predicted impact of mutations on protein structure, and regions of Dsg1 protein recognized by antibodies used in this study for immunofluorescence detection (Anti-EC Ab, Anti-CT Ab). Vertical red lines in mutants denote premature termination, red carrot in C.49–1 G>A denotes skipping. Domains: SP: signal peptide, PP: pro-protein, PrP: SP+ Pro protein, EC: extracellular, EA: EC anchor, TM: transmembrane, IA: intracellular anchor, ICS: intracellular cadherin-like sequence, IPL: intracellular proline-rich linker, RUD: repeat unit domain, DTD: Desmoglein specific terminal domain. b. Seven patients from three families were investigated and family members are denoted with roman numerals (I-III). Patients c.2659 C>T-I, II present with well demarcated brown/erythematous plaques with involvement in skin folds, reminiscent of EKV. Patient c.1861delG-II shows erythroderma with fine scales. Patients c.49–1 G>A I-III present with areas of well-defined hyperkeratotic brown plaques, reminiscent of EKV.
Figure 2.
Figure 2.. Dsg1 expression varies within the same individual between lesional and nonlesional skin.
a. Immunofluorescence staining of biopsies from lesional skin obtained from a patient from each family in the study compared to control skin, using an anti-Dsg1 ectodomain (EC) antibody and an anti-Dsg1 C-terminal (CT) antibody (scale bar = 20 μm). b. Ratio of plasma membrane to cytoplasmic Dsg1staining using the EC antibody (E-cadherin was used as a membrane marker. n = 20 borders per sample. Error bars represent mean difference ± SD. ****p<0.0001 by one-way ANOVA with Dunnet’s post hoc test). c. Immunofluorescence staining of lesional and non-lesional skin sections with the EC Dsg1 antibody (scale bar = 20 μm). Red boxed regions of the suprabasal layers of the patient epidermis are shown magnified to the right of the lower magnification images (scale bar = 20 μm). d. Plasma membrane to cytoplasmic Dsg1 ratio (E-cadherin was used as a membrane marker. n = 20 borders per sample. Error bars represent mean difference ± SD. ****p<0.0001 by two-tailed Student’s t test. L = lesional, N.L. = non-lesional).
Figure 3.
Figure 3.. Plasma membrane-localized Cx43 intensity is reduced in patients with SAM syndrome, correlating with Dsg1 expression.
a, b. Immunofluorescence staining of Dsg1 (ectodomain [EC] antibody) and Cx43 in lesional and non-lesional skin sections from patients with c.2659C>T and c.49–1G>A Dsg1 mutations (scale bar = 20 μm). Insets are magnified regions of plasma membranes demonstrating the level of Dsg1 and Cx43 localization in lesional and non-lesional areas of the biopsies. c. Immunofluorescence staining at the edge of lesional skin (c.1861delG-I) showing areas of low and normal Dsg1 expression and corresponding Cx43 levels (scale bar = 20 μm). d, e, f. Quantification of plasma membrane-associated Cx43 staining intensity from panels a, b, c. (n = 30 borders per sample. Error bars represent mean difference ± SD. *p=0.023; **p=0.0045; ***p=0.0003; ****p<0.0001 by one-way ANOVA followed by Bonferroni’s post hoc test. L = lesional, N.L. = non-lesional).
Figure 4.
Figure 4.. Dsg1 loss reduces Cx43 expression while Dsg1 expression promotes GJ function through Cx43.
a. Immunoblot of Dsg1 and Cx43 in NHEKs infected with shControl or shDsg1 72h after calcium switch (Tubulin = loading control, n = 6). b. Quantification of fold changes in Cx43 protein expression presented in a. Error bars = mean ± SD. ****p<0.0001, two-tailed Student’s t test. c. Immunofluorescence of Dsg1, FLAG, and Cx43 in NHEKs infected with shDsg1, or shDsg1 in combination with Dsg1-ΔExon2-FLAG, Dsg1-Δ909-FLAG, or Dsg1-FL-FLAG 72 h after switching cells to high calcium containing medium. Red arrowheads highlight examples of Cx43 localization at cell borders, coincident with Dsg1-FL construct expression (scale bar = 10 μm). Refer to Supplemental Figure 5d for Dsg1 and Cx43 staining of shControl infected suprabasal cells. d. Quantification of plasma membrane localized Cx43 from c (PG intensities were comparable among samples and was used as a membrane marker. Average of 3 independent experiments with at least 20 borders/condition/experiment; Error bars = mean ± SD. *p=0.012, by one-way ANOVA with Dunnet’s post hoc test, N.S. = not significant). e. Representative images of Dsg1 immunofluorescence and Lucifer yellow (LY) dye in GJIC transfer assays from GFP or Dsg1-FL retrovirally-infected NHEKs 16h after switching cells to high calcium containing medium. (Scale bar = 100 μm). f. Quantification of LY dye transfer (Average of 3 independent experiments with at least 15 fields/condition/experiment; Error bars = mean ± SD. Error bars represent mean ± SD. **p=0.009 by two-tailed Student’s t test). g. Immunofluorescence of Dsg1 and Cx43 in GFP and Dsg1-FL-FLAG infected NHEKs (scale bar = 20 μm). h. Quantification of plasma membrane localized Cx43 from g (PG intensities were comparable among samples and was used as a membrane marker. Average of 3 independent experiments with at least 15 fields/condition/experiment; Error bars = mean ± SD. Error bars represent mean ± SD. *p=0.038 by two-tailed Student’s t test). i. Representative images of GJIC dye transfer assays from Dsg1-FL-FLAG-infected NHEKs, transfected with siCx43 vs siNT, 16h after switch to high calcium-containing medium. Dextran-Alexa-Fluor 647 was used to identify cells at the edge of the wound that are loaded due to membrane damage and not indicative of GJ function. Dashed white lines indicate regions included in the quantification in j (scale bar = 100μm). j. Quantification of LY dye transfer from i (Average of 3 independent experiments with at least 15 fields/condition/experiment; Error bars = mean ± SD. Error bars represent mean ± SD. *p=0.019 by two-tailed Student’s t test). k. Immunoblot of Dsg1, Tubulin and Cx43 from i demonstrating Cx43 knockdown and Dsg1-FL expression.
Figure 5.
Figure 5.. Dsg1 loss associates with enhanced Cx43 degradation involving PKC-mediated phosphorylation of Cx43 Serine 368.
a. GJA1 gene expression in shControl or shDsg1infected NHEKs (n = 3. Error bars = mean ± SD, by two-tailed Student’s t test, N.S. = not significant). b. Immunoblot of Dsg1, Cx43 in shControl or shDsg1 infected NHEKs treated with PBS or100 μM chloroquine (Cq) for 16h (Tubulin used as a loading control. Representative of n = 3). c. Fold changes of total Cx43 from b. (Error bars = mean ± SD. *p = 0.03 by 2-way ANOVA with Sidak’s post hoc test, N.S. = not significant). d. Immunoblot of Cx43, pCx43 S368 in NHEKs infected with shControl or shDsg1 harvested 72h after switch to high calcium medium (representative of n = 5). e. Fold changes in the ratio of pCx43 S368 to total Cx43 from d. (Error bars = mean ± SD. ***p = 0.0005 by two-tailed Student’s t test). f. Lesional and non-lesional skin from two patients with different Dsg1 mutations stained for total Cx43 and pCx43 S368 (scale bar = 30 mm). g. Quantification of plasma membrane pCx43 S368/Cx43 ratios from f. (n = 30 borders from each sample, Error bars = mean ± SD. ****p<0.0001 by one-way ANOVA with Dunnet’s post hoc test). h. Immunoblot of total Cx43 and pCx43 S368 in NHEKs infected with shControl or shDsg1 retrovirus, harvested 72h after a switch to high calcium medium and following 1h treatment with DMSO, or the PKC inhibitor BIM (n = 3). i. Ratio of pCx43 S368 to total Cx43 from h. (* p=0.02 by 2-way ANOVA with Sidak’s post hoc test, N.S. = not significant).

References

    1. Alstrom JS, Hansen DB, Nielsen MS, MacAulay N. Isoform-specific phosphorylation-dependent regulation of connexin hemichannels. J Neurophysiol 2015;114(5):3014–22. - PMC - PubMed
    1. Amagai M. Autoimmune and infectious skin diseases that target desmogleins. Proc Jpn Acad Ser B Phys Biol Sci 2010;86(5):524–37. - PMC - PubMed
    1. Asimaki A, Tandri H, Huang H, Halushka MK, Gautam S, Basso C et al. A new diagnostic test for arrhythmogenic right ventricular cardiomyopathy. N Engl J Med 2009;360(11):1075–84. - PubMed
    1. Arnette C, Koetsier JL, Hoover P, Getsios S, Green KJ. In Vitro Model of the Epidermis: Connecting Protein Function to 3D Structure. Methods Enzymol 2016;569:287–308. - PMC - PubMed
    1. Asimaki A, Kapoor S, Plovie E, Karin Arndt A, Adams E, Liu Z, et al. Identification of a new modulator of the intercalated disc in a zebrafish model of arrhythmogenic cardiomyopathy. Sci Transl Med 2014;6(240):240ra74. - PMC - PubMed

Publication types

MeSH terms