. 2019 Aug 28;8(9):998.
doi: 10.3390/cells8090998.

Capture and Detection of Circulating Glioma Cells Using the Recombinant VAR2CSA Malaria Protein

Affiliations

Capture and Detection of Circulating Glioma Cells Using the Recombinant VAR2CSA Malaria Protein

Sara R Bang-Christensen et al. Cells. .

Abstract

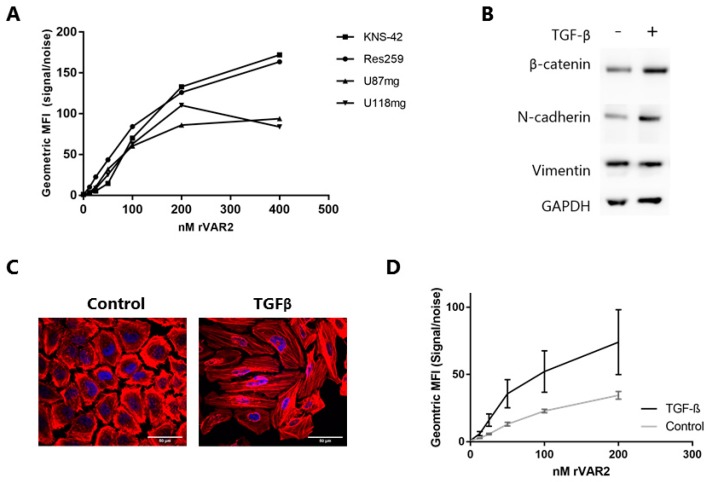
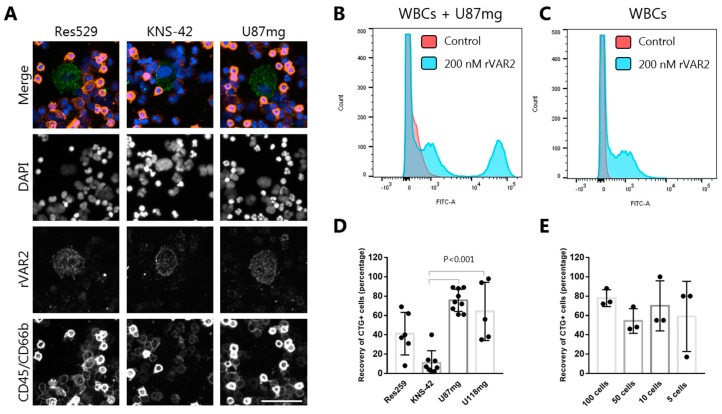
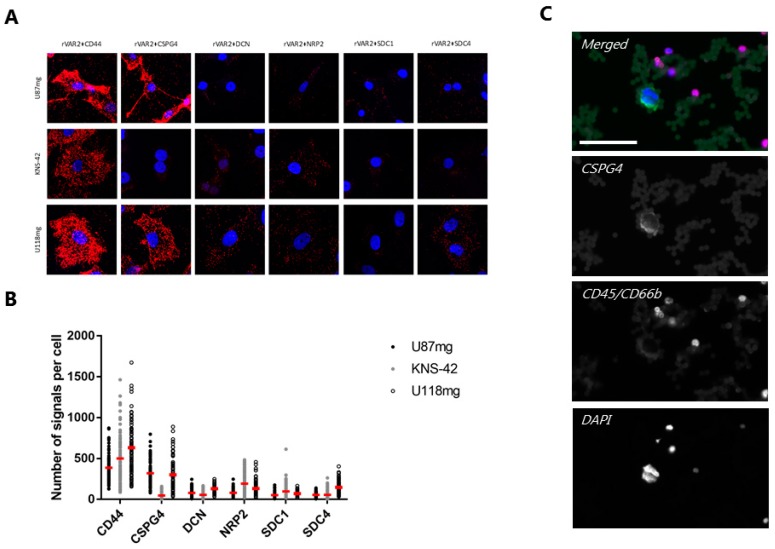
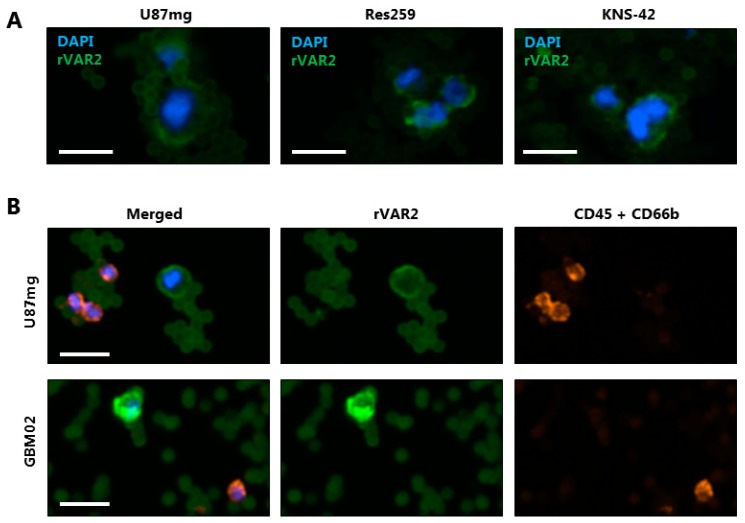
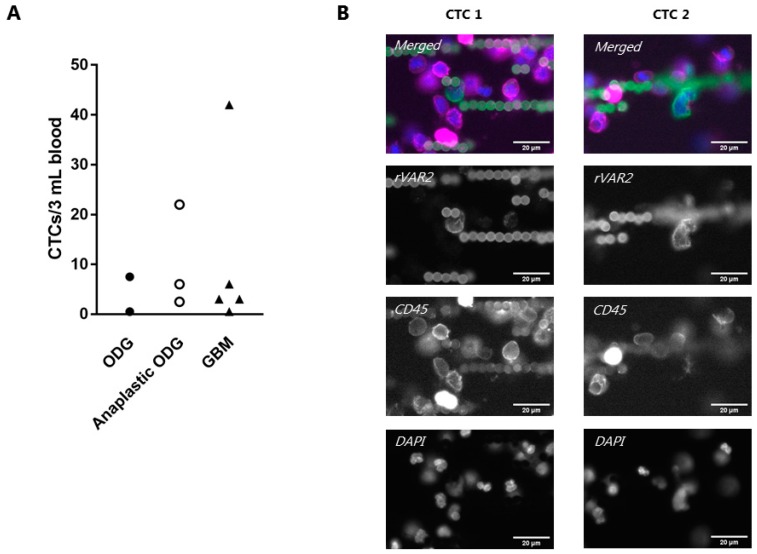
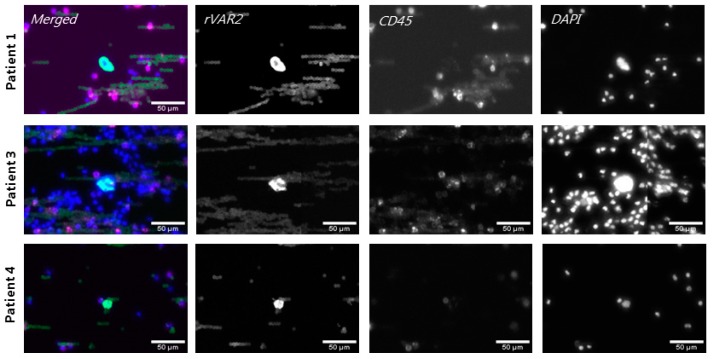
Diffuse gliomas are the most common primary malignant brain tumor. Although extracranial metastases are rarely observed, recent studies have shown the presence of circulating tumor cells (CTCs) in the blood of glioma patients, confirming that a subset of tumor cells are capable of entering the circulation. The isolation and characterization of CTCs could provide a non-invasive method for repeated analysis of the mutational and phenotypic state of the tumor during the course of disease. However, the efficient detection of glioma CTCs has proven to be challenging due to the lack of consistently expressed tumor markers and high inter- and intra-tumor heterogeneity. Thus, for this field to progress, an omnipresent but specific marker of glioma CTCs is required. In this article, we demonstrate how the recombinant malaria VAR2CSA protein (rVAR2) can be used for the capture and detection of glioma cell lines that are spiked into blood through binding to a cancer-specific oncofetal chondroitin sulfate (ofCS). When using rVAR2 pull-down from glioma cells, we identified a panel of proteoglycans, known to be essential for glioma progression. Finally, the clinical feasibility of this work is supported by the rVAR2-based isolation and detection of CTCs from glioma patient blood samples, which highlights ofCS as a potential clinical target for CTC isolation.

Keywords: biomarker; circulating tumor cells (CTCs); enrichment and detection technologies; glioma; malaria; rVAR2.


Conflict of interest statement

The technology to diagnose cancer through rVAR2 is owned by VarCT Diagnostics through a license from VAR2Pharmaceuticals. AS, MØA, TGT, MD and TMC are cofounders of VAR2Pharmaceuticals.

Figures

Figure 1
Figure 1
Recombinant malaria VAR2CSA protein (rVAR2) binds to glioma cells and the binding is unaffected by phenotypic changes. (A) rVAR2 binding to the glioma cell lines KNS-42, Res259, U87mg and U118mg was measured by flow cytometry using a FITC-conjugated anti-V5 antibody. Geometric Mean Fluorescence Intensity (MFI) was measured after incubation of cells with various rVAR2 concentrations. Results are displayed as signal/noise ratio. Figure represents data from one experiment, replicates are found in Figure S2. (B) Western blot of Res259 cell lysates after 72 h incubation with Transforming Growth Factor-beta (TGF-β) or buffer control. Membranes were incubated with anti-β-catenin, anti-N-cadherin, anti-Vimentin or anti-GAPDH antibodies and detected by anti-rabbit HRP antibody. (C) Representative images of fixed Res259 cells after 72 h incubation with TGF-β or buffer control. Cells were stained with phalloidin to stain F-actin (red) and DAPI to stain nuclei (blue). Scale bars, 50 µm. (D) rVAR2 binding to Res259 incubated with TGF-β or buffer control for 72 h measured by flow cytometry (p < 0.001, generalized least squares regression model). Geometric MFI was measured after incubation of cells with various rVAR2 concentrations and a FITC-conjugated anti-V5 antibody. Results are displayed as signal/noise ratio. Bars show standard deviation (n = 3).
Figure 2
Figure 2
rVAR2 specifically binds to glioma cells and enables their retrieval from blood. (A) rVAR2 stains glioma cell lines in a background of white blood cells (WBCs). Res529 (left), KNS-42 (middle) and U87mg (right) cells were mixed with WBCs and stained with V5-tagged rVAR2 in combination with a CF488-conjugated anti-V5 antibody (green), PE-conjugated anti-CD45 and anti-CD66b antibodies (red), and DAPI (blue). Scale bar, 50 µm. (B) Flow cytometry analysis showing WBCs (100 µL RBC lysed blood) mixed with U87mg (50,000) cells and detected with either 200 nM rVAR2 and a FITC-conjugated anti-V5 antibody or with a FITC-conjugated anti-V5 antibody alone (control). (C) Same as in (B) but with no U87mg cells added. (D) Recovery of CellTracker Green-stained glioma cells from blood. 100 cells were spiked into 3 mL blood and recovered using rVAR2-coupled beads. Cells were stained with DAPI and scanned on the Cytation 3 Imager. Each dot represents the percentage of recovered cells from one sample. Bars represent mean recoveries and error bars show +/− standard deviation (n ≥ 2) (one-way ANOVA with Bonferroni correction). (E) Recovery of CellTracker Green-stained U87mg cells from blood. The indicated number of U87mg cells was spiked into 3 mL blood and captured using rVAR2-coupled beads. Enumeration of cells and data presentation were done as in (D).
Figure 3
Figure 3
Evaluation of protein pull-down hits from mass spectrometry by proximity ligation assay (PLA). (A) Representative images of PLA assays on U87mg, KNS-42, and U118mg cells showing co-localization between rVAR2 and a panel of CSPGs as red dots. Cells were counterstained with DAPI (blue) and analyzed by confocal microscopy. All of the images are shown in same magnification using a 60× objective. (B) Quantification of the PLA co-localization signals between rVAR2 and each of the CSPGs analyzed. Data is shown as the number of signals per cell. Red bars represent the mean number of signals per cell. (C) Representative image showing specific CSPG4 staining (green) of an rVAR2-captured U87mg cell in a background of WBCs stained for CD45 and CD66b (both red). Cells were stained with DAPI (blue) and visualized on the Cytation 3 Imager with a 20× objective. Scale bar, 50 µm.
Figure 4
Figure 4
Using rVAR2 to stain glioma cells after capture with rVAR2-coupled beads. (A) Glioma cell lines (U87mg, Res259, and KNS-42) were incubated with rVAR2-coupled beads and stained with a fluorophore-conjugated rVAR2 (green) and DAPI (blue). Representative images were obtained using the Cytation 3 Imager with a 10× objective. Scale bars, 20 µm. (B) U87mg cells and GBM02 cells were spiked into 3 mL blood, retrieved using rVAR2-coupled beads, and stained using fluorescent rVAR2 (green), anti-CD45/CD66b antibodies (red) and DAPI (blue). Scale bars, 20 µm.
Figure 5
Figure 5
rVAR2 enables capture and detection of glioma circulating tumor cells (CTCs) from patient blood samples. (A) Average CTC count in blood samples from ten glioma patients. 3 mL blood samples were processed by using rVAR2-coupled beads followed by staining using a mixture of fluorophore-conjugated rVAR2 (green), anti-CD45/CD66b antibodies (red) and DAPI (blue). CTCs were defined as rVAR2+, CD45/CD66b−, DAPI+ cells. Each dot represents the average number of detected CTCs per 3 mL patient blood sample. The x-axis shows whether the patient was diagnosed with GBM, Anaplastic Oligodendroglioma (ODG), or Oligodendroglioma (ODG). (B) Representative images of identified CTCs from a patient diagnosed with GBM. The sample was stained with flurophore-conjugated rVAR2 (green), anti-CD45 antibody (magenta), and DAPI (blue). Images were obtained using the CellCelector™ (ALS) with a 40× objective. Scale bars, 20 µm.
Figure 6
Figure 6
Identification of CTCs for whole exome sequencing (WES). Representative images of identified CTCs from three patients. Cells were stained with fluorophore-conjugated rVAR2 (green), anti-CD45 antibody (magenta) and DAPI (blue) and classified as CTCs if rVAR2+, CD45−, and DAPI+. Images were obtained using the CellCelector™ (ALS) with a 10× objective. Scale bars, 50 µm.

References

    1. Wesseling P., Kros J.M., Jeuken J.W.J.D.H. The pathological diagnosis of diffuse gliomas: Towards a smart synthesis of microscopic and molecular information in a multidisciplinary context. Diagn. Histopathol. 2011;17:486–494. doi: 10.1016/j.mpdhp.2011.08.005. - DOI
    1. Claes A., Idema A.J., Wesseling P. Diffuse glioma growth: A guerilla war. Acta Neuropathol. 2007;114:443–458. doi: 10.1007/s00401-007-0293-7. - DOI - PMC - PubMed
    1. Olar A., Aldape K.D. Using the molecular classification of glioblastoma to inform personalized treatment. J. Pathol. 2014;232:165–177. doi: 10.1002/path.4282. - DOI - PMC - PubMed
    1. Tabatabai G., Stupp R., van den Bent M.J., Hegi M.E., Tonn J.C., Wick W., Weller M. Molecular diagnostics of gliomas: The clinical perspective. Acta Neuropathol. 2010;120:585–592. doi: 10.1007/s00401-010-0750-6. - DOI - PubMed
    1. Louis D.N., Perry A., Reifenberger G., von Deimling A., Figarella-Branger D., Cavenee W.K., Ohgaki H., Wiestler O.D., Kleihues P., Ellison D.W. The 2016 World Health Organization Classification of Tumors of the Central Nervous System: A summary. Acta Neuropathol. 2016;131:803–820. doi: 10.1007/s00401-016-1545-1. - DOI - PubMed

Publication types

MeSH terms

Substances