. 2019 Oct 23;104(2):412-427.e4.
doi: 10.1016/j.neuron.2019.07.027. Epub 2019 Aug 26.

Recruitment of GABAergic Interneurons in the Barrel Cortex during Active Tactile Behavior

Affiliations

Recruitment of GABAergic Interneurons in the Barrel Cortex during Active Tactile Behavior

Jianing Yu et al. Neuron. .

Abstract

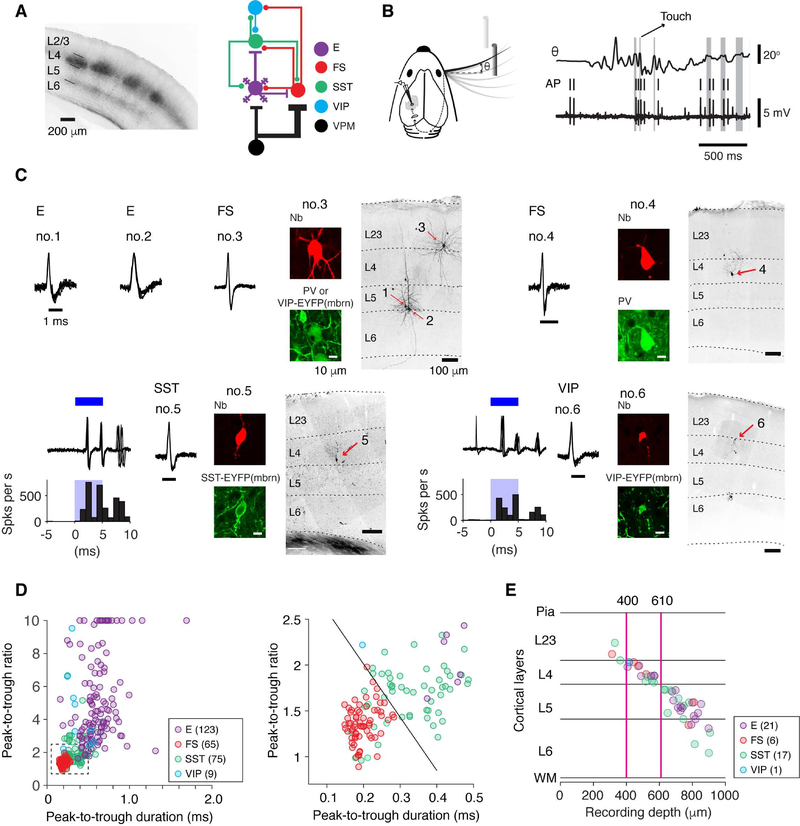
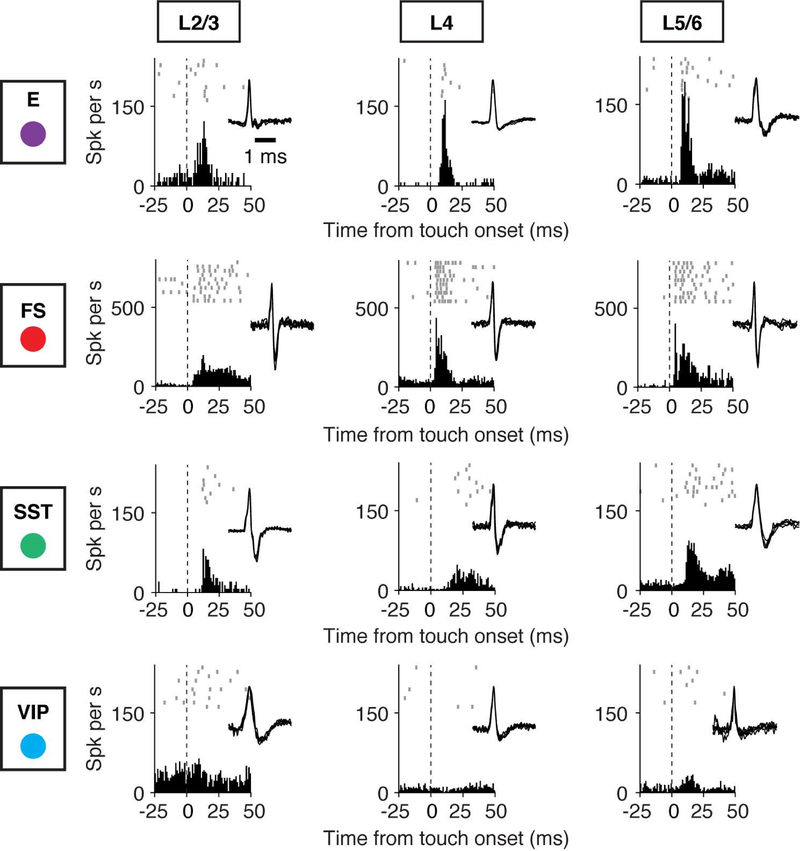
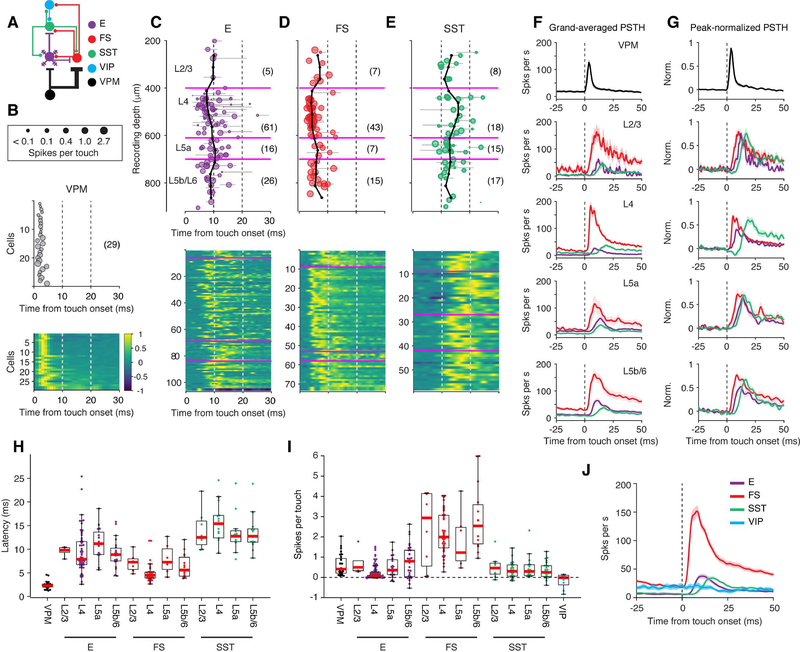
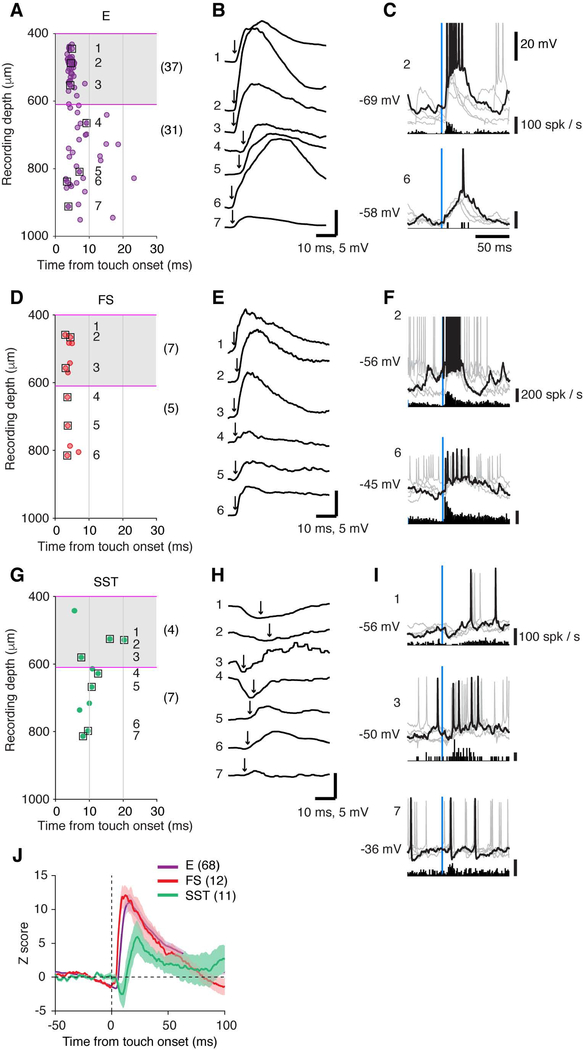
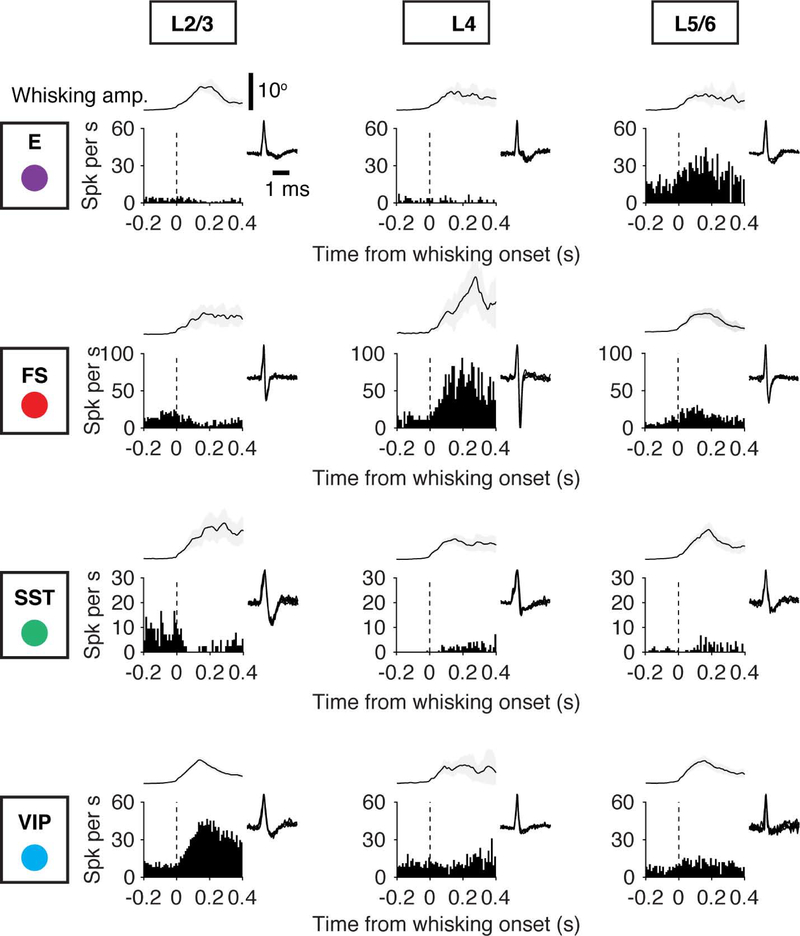
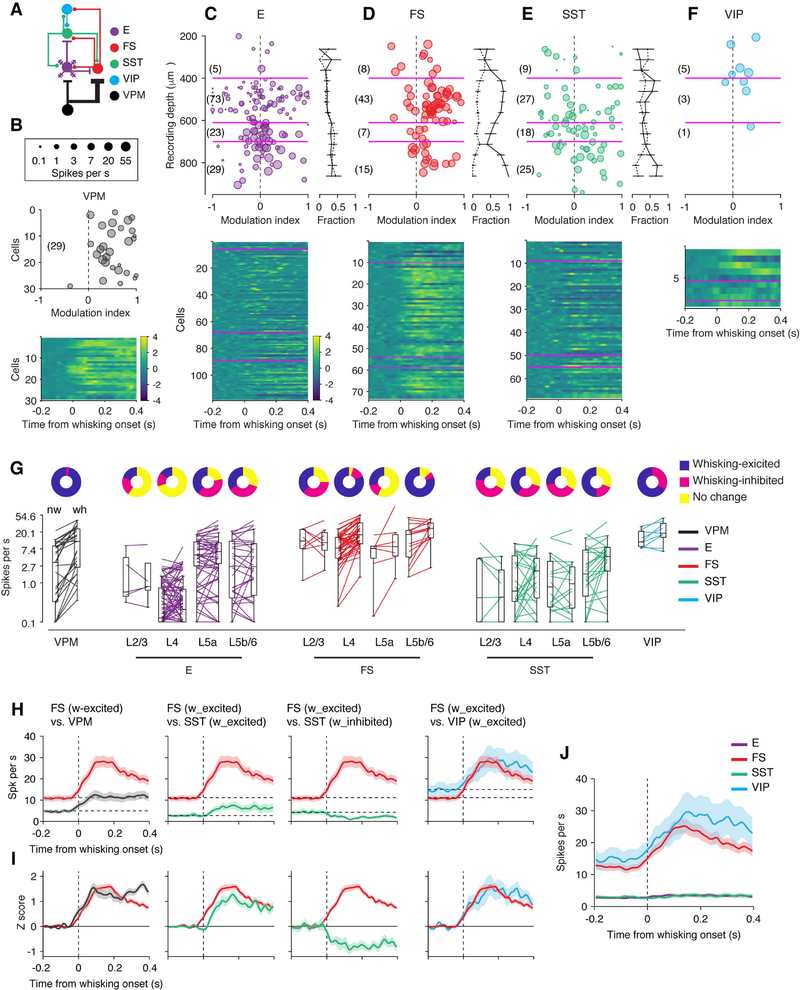
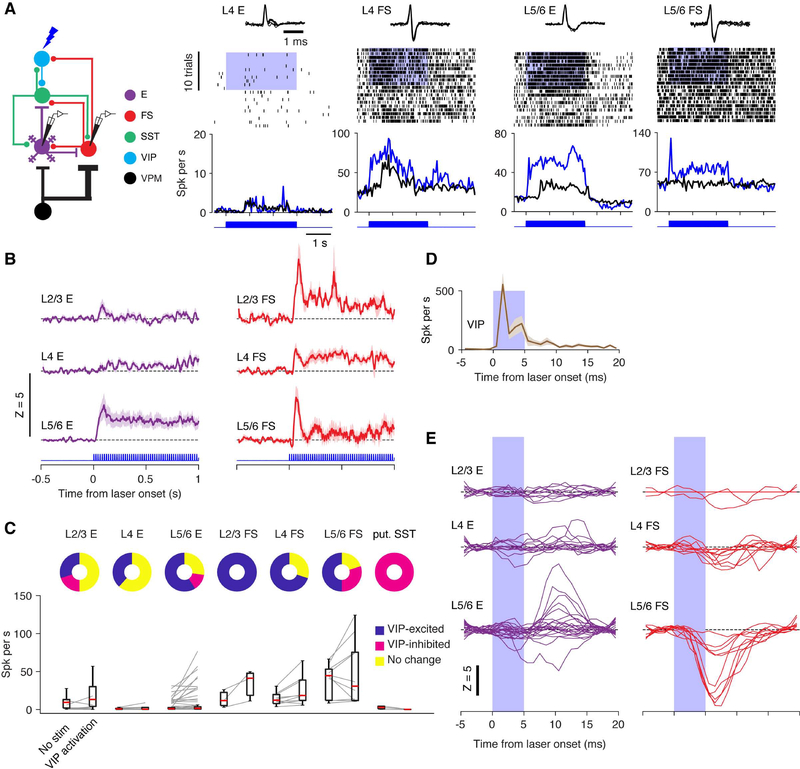
Neural computation involves diverse types of GABAergic inhibitory interneurons that are integrated with excitatory (E) neurons into precisely structured circuits. To understand how each neuron type shapes sensory representations, we measured firing patterns of defined types of neurons in the barrel cortex while mice performed an active, whisker-dependent object localization task. Touch excited fast-spiking (FS) interneurons at short latency, followed by activation of E neurons and somatostatin-expressing (SST) interneurons. Touch only weakly modulated vasoactive intestinal polypeptide-expressing (VIP) interneurons. Voluntary whisker movement activated FS neurons in the ventral posteromedial nucleus (VPM) target layers, a subset of SST neurons and a majority of VIP neurons. Together, FS neurons track thalamic input, mediating feedforward inhibition. SST neurons monitor local excitation, providing feedback inhibition. VIP neurons are activated by non-sensory inputs, disinhibiting E and FS neurons. Our data reveal rules of recruitment for interneuron types during behavior, providing foundations for understanding computation in cortical microcircuits.

Keywords: FS; GABAergic interneurons; SST; VIP; active touch; barrel cortex; in vivo whole-cell; juxtacellular; movement; opto-tagging.


Conflict of interest statement

DECLARATION OF INTERESTS

The authors declare no competing interests.

Figures

Figure 1.
Figure 1.. Cell Type-Specific Recordings during Active Tactile Behavior
(A) Left, coronal section through the barrel cortex with labeled VPM afferents (mCherry) in L4 and the border of L5 and L6. Right, connectivity of major interneuron classes with VPM inputs and local E neurons. (B) Left, object localization task. Mice move their whiskers to palpate a pole which is presented in one of two locations. Right, whisker position (θ) and action potentials (AP) recorded during the object localization task. Gray bars, periods of touch between the whisker and the pole. (C) Recordings from specific cell types. Cell types (excitatory, or E; fast-spiking, parvalbuminexpressing, or FS; somatostatin-expressing, or SST; vasoactive intestinal polypeptide-expressing, or VIP) were identified based on a combination of spike waveform, immunohistochemistry, and optogenetic tagging in transgenic mice. Cells no. 1–3 were from VIP-IRES-Cre x Ai32 mice and the brain slices were immunostained against PV. In this section both VIP and PV cells emitted green fluorescence, but fluorescence in VIP cells was membrane-bound (mbrn). For cells no. 5 and 6, ChR2-based tagging is illustrated. Blue, 5-ms laser stimulation. Cells were filled with neurobiotin (Nb) by in vivo juxtacellular methods after their behavior-relevant firing patterns were collected. (D) Spike waveform parameters for different cell types. Peak-to-trough ratios larger than 10 are plotted as 10. The number in parentheses denotes cell number in each cell type. (E) Laminar positions of neurons recovered histologically after recordings, and the corresponding recording depth (manipulator reading). The positions are normalized to the boundaries of the layers in which the cells were identified. Magenta lines denote 400 and 610 μm, corresponding to the boundaries for L4. The number of cells is listed for each type. See also Figure S1.
Figure 2.
Figure 2.. Cell-Type-Specific Activity Aligned to Touch Onset
Example recordings for different cell types (E, FS, SST, VIP), arrayed vertically. Layers are arrayed horizontally. Each neuron is represented by spike raster plots across ten trials (top), the peristimulus time histogram (PSTH; bin size, 1 ms) aligned to touch onset (bottom), and the spike waveform (inset). Dashed lines denote the touch onset. See also Figure S2.
Figure 3.
Figure 3.. Touch-Evoked Spiking Responses Across Cell Types and Layers
(A) Connectivity diagram. (B) Response latency from touch onset for VPM neurons. Top, the size of each circle corresponds to the magnitude of the response (spikes per touch). Middle, touch latency. Bottom, peak-normalized PSTHs for all neurons. The number in parentheses denotes the number of VPM cells. (C) Response latency from touch onset as a function of recording depth for excitatory (E) neurons. Top, the size of each circle corresponds to the magnitude of the response. Gray lines, 90% confidence interval for latency estimation for each cell. Magenta, 400, 610, and 700 μm representing the borders between L2/3 and L4, L4 and L5a, and L5a and L5b/6, respectively. Black lines, running median across cortical depth (calculated over 125 μm windows, in 50 μm steps). The number in parentheses denotes the number of cells in each layer. Bottom, peak-normalized PSTH for all neurons. (D) Same as C, FS neurons. (E) Same as C, SST neurons. (F) Spike rate aligned to touch onset for different neuron types and cortical layers (grand average; shading indicates SEM). The color code and the cell number in each group is the same as in B-E. (G) Same as F, peak-normalized. (H) Response latency from touch onset for different neuron types and layers. VIP neurons did not respond to touch reliably and were not included. Boxplots follow the style of Tukey boxplot. Red, median; Bottom and top edges of the box, 25th and 75th percentiles, or q1 and q3; Whiskers, extreme data values within q1–1.5×(q3-q1) and q3+1.5×(q3-q1). (I) Response magnitude for all cell types. More cells, including those whose latency could not be determined, are included for this plot. (J) Grand-averaged PSTHs of E (n = 108), FS (n = 72), SST (n = 58), and VIP (n = 9) neurons. See also Figures S3.
Figure 4.
Figure 4.. Touch Evoked Membrane Potential Dynamics: Comparing E, FS, and SST Neurons
(A) The latency of intracellularly-recorded synaptic-potential depolarization after touch onset as a function of recording depth, excitatory (E) neurons. Each point is an individual neuron. Squares correspond to example responses shown in B and C. The number in parentheses denotes the number of cells in L4 or L5/6. (B) Example responses of 7 example cells averaged across trials (seven cells, boxed in A). Arrow indicates the onset of synaptic-potential depolarization. (C) Single membrane potential traces and spike histogram for 2 example cells. One of the trials is plotted in black and others in gray. (D-F) Same as (A-C) for FS neurons. (G-I) Same as (A-C) for SST neurons. (J) Grand-averaged touch-evoked membrane potential response (z-scored) for E, FS, and SST neurons. See also Figures S4.
Figure 5.
Figure 5.. Cell Type-Specific Activity Aligned to Onset of Whisker Movement
Example recordings for different cell types (E, FS, SST, VIP), arrayed vertically. Layers are arrayed horizontally. Each neuron is represented by the PSTH aligned to the onset of a whisking bout and the spike waveform (inset). Top, whisking amplitude.
Figure 6.
Figure 6.. Whisking-Evoked Responses Across Cell Types and Layers
(A) Connectivity diagram. (B) Top, modulation index for individual VPM neurons. The size of the marker corresponds to the spike rate, averaged between whisking and non-whisking periods. Bottom, averaged responses (z-scored) for individual neurons aligned to the start of whisking bouts. (C) Top left, modulation index for E neurons as a function of recording depth. The size of the marker corresponds to the spike rate. Right, the proportion of neurons excited by whisking (solid line) and those inhibited by whisking (dashed line) calculated in running windows (125 μm window, 50 μm step). Error bar denotes standard error. Bottom, averaged responses (z-scored) for individual neurons aligned to the start of whisking bouts. (D) Same as C for FS neurons. (E) Same as C for SST neurons. (F) Same as C for VIP neurons. (G) Changes in spike rate with whisker movements for individual cells, arranged by cell types and layers. Pie charts, the fraction of cells that are excited (blue), inhibited (red), or show no change in spike rate (yellow) to whisking. (H) Spike rate changes aligned to start of whisking bouts for VPM (n = 29), FS (L4 and L5b/6, whisking-excited, n = 47), SST (L4 and L5b/6, whisking-excited, n = 24, whisking-inhibited, n = 13), and VIP neurons (n = 9), plotted pairwise for ease of comparison. Cells excited by whisking are plotted separately from cells inhibited by whisking. (I) Same as H with z-scored spike rate. (J) Grand-averaged PSTHs of E (n = 153), FS (n = 73), SST (n = 80), and VIP (n = 9) neurons. See also Figure S5.
Figure 7.
Figure 7.. Activation of VIP Neurons Causes Cell Type-Specific Disinhibition and Inhibition
(A) Examples of responses of E and FS neurons to photostimulation of VIP neurons. Top, spike waveforms. Middle, spike raster plots. Blue shading, time of photostimulation. Bottom, spike rate under control condition (black) and with VIP photostimulation (blue). Activity is aligned to the beginning of behavioral trials. Note that the modulation under the control condition (black tick marks and traces) was caused by the behavior (e.g., touch). (B) Grand-averages of the spike rate changes (stim-control, z-scored) of E (L2/3, n = 10; L4, n = 13; L5/6, n = 22) and FS (L2/3, n = 3; L4, n = 10; L5/6, n = 10) neurons in response to VIP neuron stimulation, sorted by their layers. (C) Effects of VIP photostimulation on neurons in different layers. Put., putative. (D) Responses of VIP neurons to single laser pulses (n = 9). (E) Spike rate changes (z-scored) of E and FS neurons to VIP stimulation, aligned to single laser pulses. See also Figure S6.

Comment in

Similar articles

Cited by

References

    1. Agmon A, and Connors BW (1991). Thalamocortical responses of mouse somatosensory (barrel) cortexin vitro. Neuroscience 41, 365–379. - PubMed
    1. Agmon A, and Connors BW (1992). Correlation between intrinsic firing patterns and thalamocortical synaptic responses of neurons in mouse barrel cortex. J. Neurosci 12, 319–329. - PMC - PubMed
    1. Armstrong-James M, Fox K, and Das-Gupta A (1992). Flow of excitation within rat barrel cortex on striking a single vibrissa. J. Neurophysiol 68, 1345–1358. - PubMed
    1. Audette NJ, Urban-Ciecko J, Matsushita M, and Barth AL (2018). Pom thalamocortical input drives layer-specific microcircuits in somatosensory cortex. Cereb. Cortex 28, 1312–1328. - PMC - PubMed
    1. Beierlein M, Gibson JR, and Connors BW (2003). Two dynamically distinct inhibitory networks in layer 4 of the neocortex. J. Neurophysiol 90, 2987–3000. - PubMed

Publication types

MeSH terms

LinkOut - more resources