. 2019 Sep:47:33-43.
doi: 10.1016/j.ebiom.2019.08.030. Epub 2019 Aug 26.

B7-H3-redirected chimeric antigen receptor T cells target glioblastoma and neurospheres

Affiliations

B7-H3-redirected chimeric antigen receptor T cells target glioblastoma and neurospheres

Dean Nehama et al. EBioMedicine. 2019 Sep.

Abstract

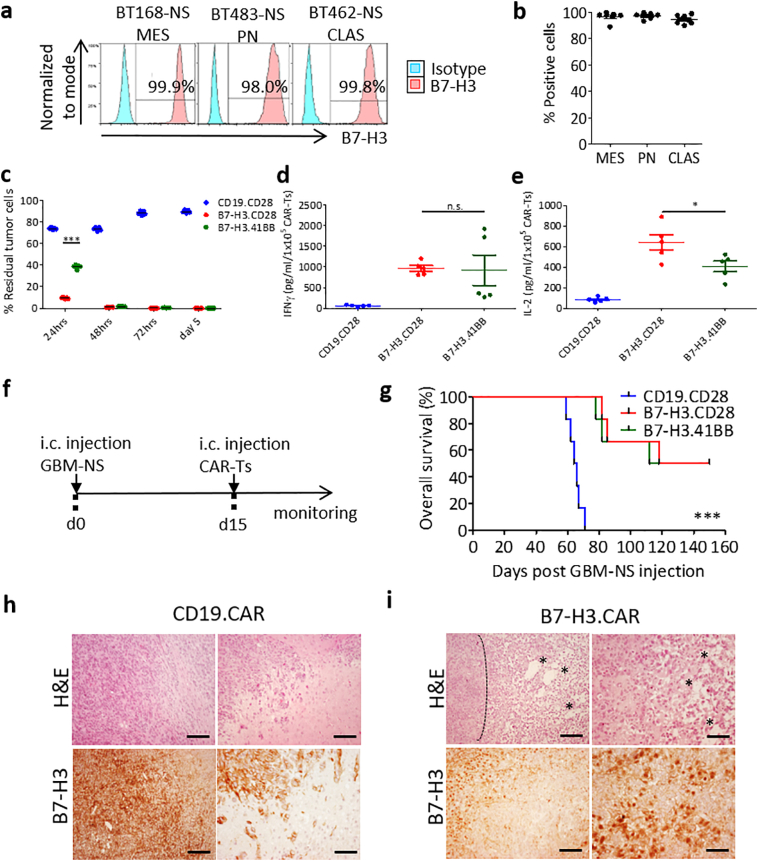
Background: The dismal survival of glioblastoma (GBM) patients urgently calls for the development of new treatments. Chimeric antigen receptor T (CAR-T) cells are an attractive strategy, but preclinical and clinical studies in GBM have shown that heterogeneous expression of the antigens targeted so far causes tumor escape, highlighting the need for the identification of new targets. We explored if B7-H3 is a valuable target for CAR-T cells in GBM.

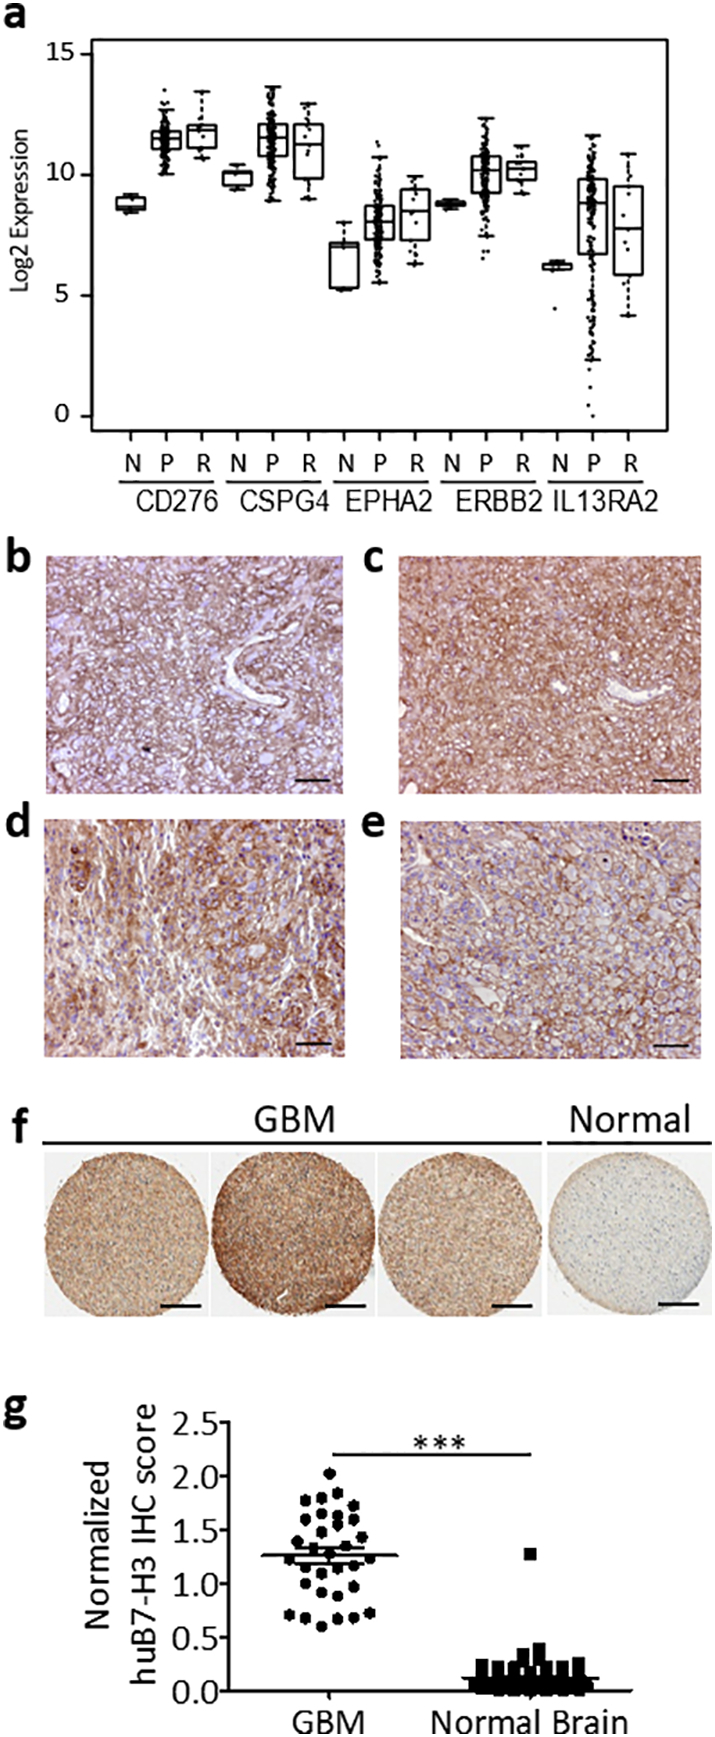
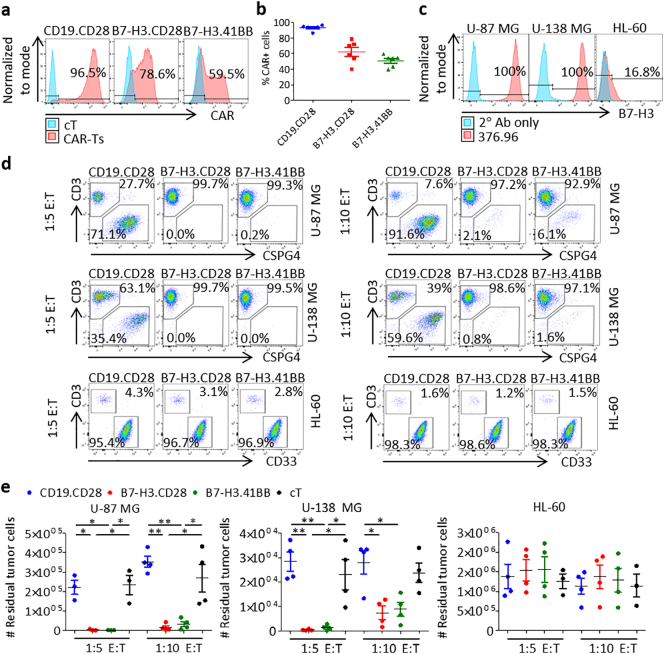
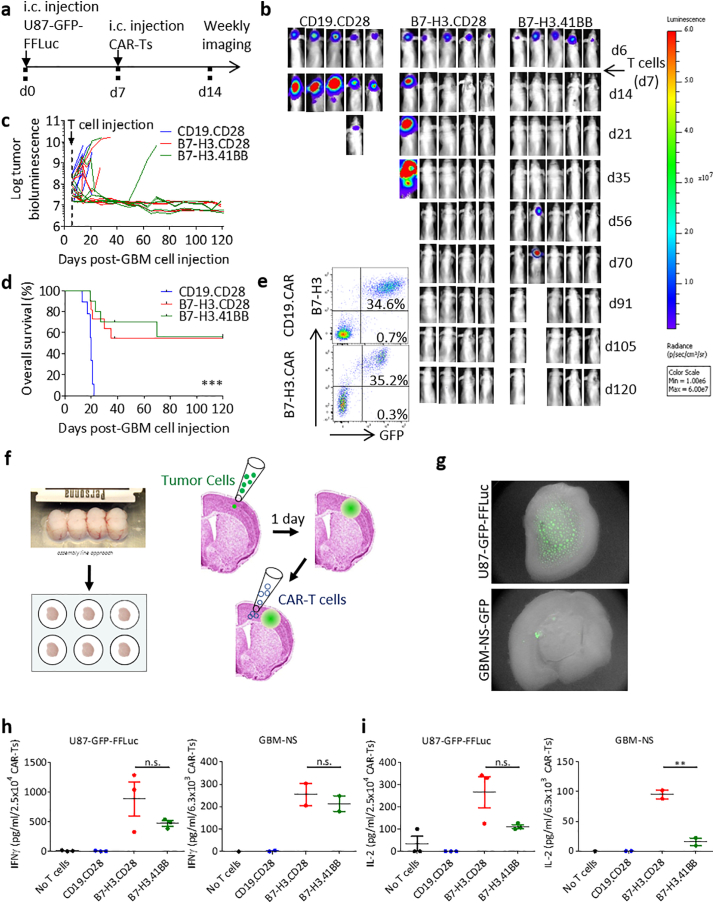
Methods: We compared mRNA expression of antigens in GBM using TCGA data, and validated B7-H3 expression by immunohistochemistry. We then tested the antitumor activity of B7-H3-redirected CAR-T cells against GBM cell lines and patient-derived GBM neurospheres in vitro and in xenograft murine models.

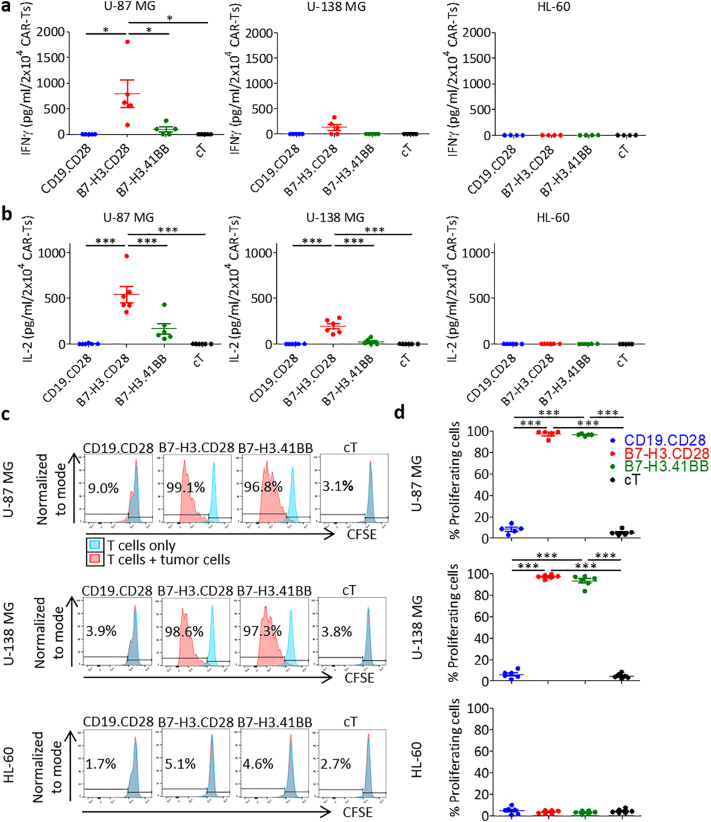
Findings: B7-H3 mRNA and protein are overexpressed in GBM relative to normal brain in all GBM subtypes. Of the 46 specimens analyzed by immunohistochemistry, 76% showed high B7-H3 expression, 22% had detectable, but low B7-H3 expression and 2% were negative, as was normal brain. All 20 patient-derived neurospheres showed ubiquitous B7-H3 expression. B7-H3-redirected CAR-T cells effectively targeted GBM cell lines and neurospheres in vitro and in vivo. No significant differences were found between CD28 and 4-1BB co-stimulation, although CD28-co-stimulated CAR-T cells released more inflammatory cytokines.

Interpretation: We demonstrated that B7-H3 is highly expressed in GBM specimens and neurospheres that contain putative cancer stem cells, and that B7-H3-redirected CAR-T cells can effectively control tumor growth. Therefore, B7-H3 represents a promising target in GBM. FUND: Alex's Lemonade Stand Foundation; Il Fondo di Gio Onlus; National Cancer Institute; Burroughs Wellcome Fund.

Keywords: B7-H3; Cancer stem cells; Chimeric antigen receptor; Glioblastoma; Immunotherapy.


Conflict of interest statement

GD HD and SF filed a patent for B7-H3-redirected CAR T cells. No other others have conflicts of interest to declare.

Figures

Fig. 1
Fig. 1
B7-H3 expression in GBM. (a) Normalized mRNA levels of CD276 (B7-H3), CSPG4, EPHA2, ERBB2, and IL13RA2 in adjacent normal (“N”), primary GBM (“P”), and recurrent GBM (“R”) samples in TCGA. Each point represents a different TCGA sample. (b-e). Representative examples of B7-H3 immunostaining in classical (b), proneural (c), mesenchymal GBM (d), and a rare case of giant cell GBM (e). (f) Representative B7-H3 immunostaining of commercially available GBM tissue arrays and normal brain. (g) B7-H3 expression scores of the tissue microarrays of GBM (n = 32) and normal brain cores (n = 69) quantified via color deconvolution algorithm. Statistical analysis of difference in means was performed using two-tailed nonparametric Mann-Whitney U test (***p < 0·0001). Scale bar (b)-(e), 50 μm. Scale bar (f), 400 μm.
Fig. 2
Fig. 2
B7-H3.CAR-T cells target human GBM cell lines in vitro. (a) Representative plots showing the CAR expression in CD19.CD28, B7-H3.CD28 and B7-H3.41BB CAR-T cells as assessed by flow cytometry. Expression is represented relative to non-transduced control T cells (cT). (b) Summary of CAR expression. Data represent mean ± SD (n = 6 donors). (c) Expression of B7-H3 in U-87 MG, U-138 MG, and HL-60 cells stained with the 376.96 mAb and APC goat anti-mouse and assessed by flow cytometry. Expression is represented relative to staining with APC goat anti-mouse alone. (d) Representative flow cytometry plots of CAR-T cells (CD3+) cocultured with U-87 MG cells (CSPG4+), U-138 MG cells (CSPG4+), or HL-60 cells (CD33+) at 1:5 or 1:10 effector-to-target (E:T) ratios for five days. (e) The number of remaining U-87 MG, U-138 MG, or HL-60 cells in 1:5 and 1:10 E:T coculture experiments in (d). Tumor cell numbers were calculated using counting beads. Data represent mean ± SD (n = 3–4 donors). Each donor was tested once for each experiment. Difference in means was assessed through one-way ANOVA with Bonferroni's post-test correction (*p < 0·05, **p < 0·01).
Fig. 3
Fig. 3
B7-H3.CAR-T cells release effector cytokines and proliferate in response to B7-H3+ GBM cell lines. (a-b) Quantification of IFNγ (a) and IL-2 (b) by ELISA in the supernatant 24 h after coculture of CAR-T cells or cTs with U-87 MG, U-138 MG, or HL-60 cells at 1:5 E:T ratio. Data represent mean ± SD (n = 5–6 donors). Difference in means was assessed through one-way ANOVA with Bonferroni's post-test correction (*p < 0·05, ***p < 0·0001). (c) Representative CFSE dilution of CFSE-labeled CAR-T cells cocultured at a 1:1 E:T ratio with U-87 MG, U-138 MG, or HL-60 cells for five days. The percent of CFSE dilution was measured relative to CFSE-labeled CAR-T cells cultured alone. (d) Summary of CFSE-dilution assays. Data represent mean ± SD (n = 5–6 donors). Each donor was tested once for each experiment. Difference in means was assessed through one-way ANOVA with Bonferroni's post-test correction (***p < 0·0001).
Fig. 4
Fig. 4
B7-H3.CAR-T cells control the growth of human GBM cell lines in vivo. (a) Schema of the xenograft murine model used to test the antitumor effects of B7-H3.CAR-T cells in vivo. U87-GFP-FFLuc GBM cells (1 × 105 cells) were inoculated into the caudate nucleus and tumor growth was monitored weekly by bioluminescence (BLI) imaging. CAR-T cells (2 × 106 cells) were injected intratumorally one week after tumor inoculation. (b) Representative images of tumor BLI. (c) Log-transformed BLI values showing the kinetics of tumor growth of each mouse (n = 9–11 mice/group across 3 donors of T cells). (d) Kaplan-Meier analysis of overall survival of the treated mice. Statistical analysis was performed using the Mantel-Cox log rank test (***p < 0·0001). (e) Representative flow cytometry plots showing the expression of GFP and B7-H3 in U87-GFP-FFLuc tumors explanted from mice treated with CAR-T cells. (f) Experimental setup of xenograft rat brain slice coculture model. (g) Representative images demonstrating U87-GFP-FFLuc and GBM-NS-GFP cells seeded on rat brain slice. (h,i) Quantification of IFNγ (h) and IL-2 (i) by ELISA in the supernatant 24 h after coculture of CAR-T cells with U87-GFP-FFLuc cells or GBM-NS-GFP at 1:2 E:T ratio on rat brain slides. Data represent one donor tested against U87-GFP-FFLuc cells or one GBM-NS-GFP line on 1–3 different rat brain slices. Each donor was tested once for each experiment. Difference in means was assessed through one-way ANOVA with Bonferroni's post-test correction (**p < 0·01).
Fig. 5
Fig. 5
B7-H3.CAR-T cells control the growth of human GBM-NS in vitro and in vivo. (a) Representative flow plots and (b) summary plots showing B7-H3 expression in human GBM-NS as assessed by flow cytometry. GBM-NS were subdivided by molecular subtypes (MES: mesenchymal, n = 6; PN: proneural, n = 6; CLAS: classical, n = 8). (c) CAR-T cells were cocultured with GBM-NS at 1:5 E:T ratio and residual tumor cells (B7-H3+) were quantified by flow cytometry at different time points. Data represent the average of two donors of CAR-T cells tested against five GBM-NS. Difference in means was assessed through two-way ANOVA with Bonferroni's post-test correction (***p < 0·0001). (d,e) Quantification of IFNγ (d) and IL-2 (e) release by B7-H3.CAR-T cells and CD19.CAR-T cells in the supernatant collected 24 h after coculture with GBM-NS. BT166-NS and BT462-NS released higher levels of IFNγ compared to BT308-NS, BT302-NS and BT273-NS [14]. Data represent the average of two donors of CAR-T cells tested against five GBM-NS. Difference in means was assessed through one-way ANOVA with Bonferroni's post-test correction (*p < 0·05). (f) Schema of the xenograft murine experimental model used to test the antitumor effects of CAR-T cells against GBM-NS. GBM-NS (1 × 105 cells) were inoculated into the caudate nucleus and CAR-T cells from one donor (2 × 106 cells) were injected intratumorally two week later. (g) Kaplan-Meier curves showing the overall survival of the treated mice (n = 6 mice/group). Overall survival comparison was measured using the Mantel-Cox log rank test (***p < 0·0001). (h,i) Tissue morphology assessed by hematoxylin and eosin staining and B7-H3 expression assessed by immunohistochemistry of xenograft gliomas collected from tumor-bearing mice. (h) Gliomas collected from mice treated with CD19.CAR-T cells show high cellularity and high B7-H3 expression. (i) Gliomas collected from mice treated with B7-H3.CAR-T cells show necrotic zones with fibrotic areas (marked by asterisks) and disrupted tumor architecture. Delimited area shows dense cellularity at the borders of necrosis. Scale bar, 100 μm. Each CAR-T cell donor was tested once for each experiment.

References

    1. Weller M., Butowski N., Tran D.D. Rindopepimut with temozolomide for patients with newly diagnosed, EGFRvIII-expressing glioblastoma (ACT IV): a randomised, double-blind, international phase 3 trial. Lancet Oncol. 2017 Oct;18(10):1373–1385. - PubMed
    1. Stupp R., Mason W.P., van den Bent M.J. Radiotherapy plus concomitant and adjuvant temozolomide for glioblastoma. N Engl J Med. 2005 Mar 10;352(10):987–996. - PubMed
    1. Friedman H.S., Prados M.D., Wen P.Y. Bevacizumab alone and in combination with irinotecan in recurrent glioblastoma. J Clin Oncol. 2009 Oct 1;27(28):4733–4740. - PubMed
    1. Brennan C.W., Verhaak R.G., McKenna A. The somatic genomic landscape of glioblastoma. Cell. 2013 Oct 10;155(2):462–477. - PMC - PubMed
    1. Patel A.P., Tirosh I., Trombetta J.J. Single-cell RNA-seq highlights intratumoral heterogeneity in primary glioblastoma. Science. 2014 Jun 20;344(6190):1396–1401. - PMC - PubMed

MeSH terms