. 2019 Nov 4;216(11):2562-2581.
doi: 10.1084/jem.20190377. Epub 2019 Aug 29.

Gasdermin D in peripheral myeloid cells drives neuroinflammation in experimental autoimmune encephalomyelitis

Affiliations

Gasdermin D in peripheral myeloid cells drives neuroinflammation in experimental autoimmune encephalomyelitis

Sheng Li et al. J Exp Med. .

Abstract

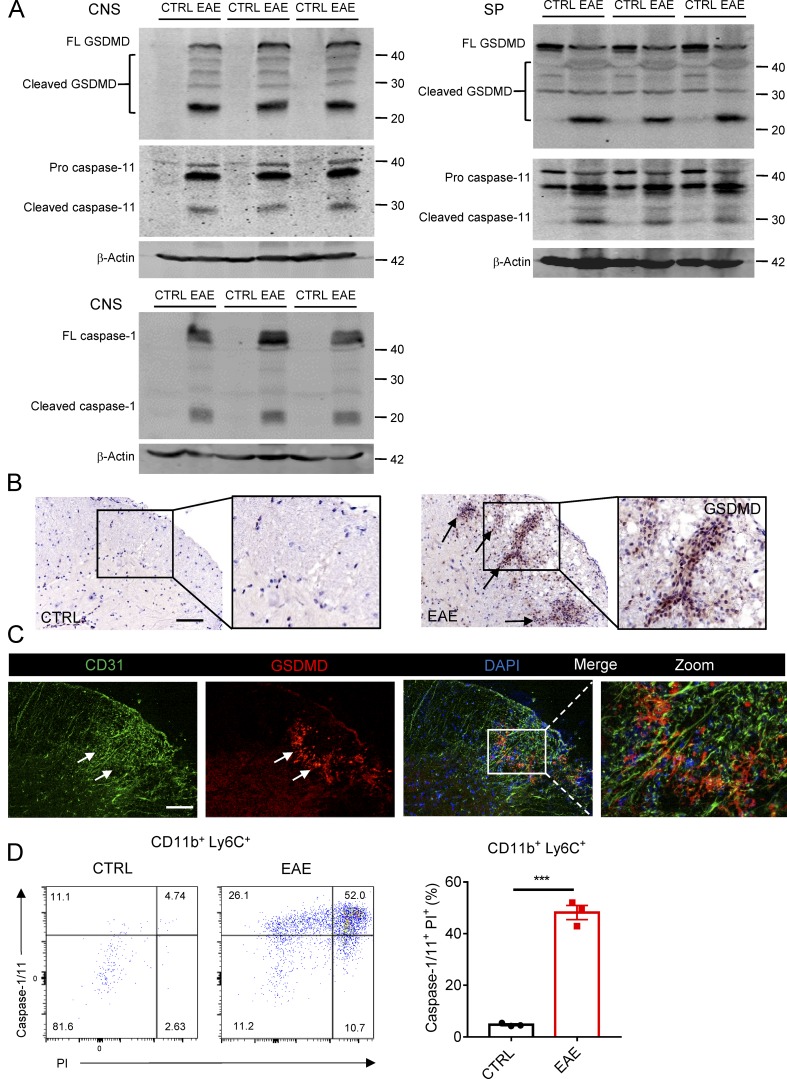
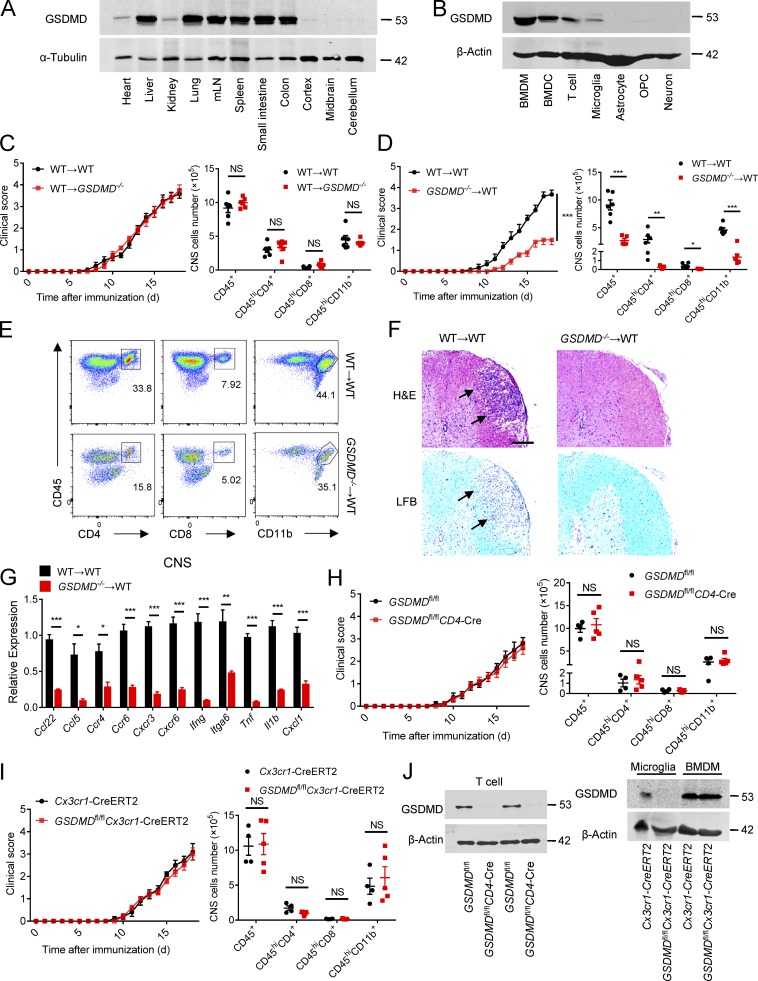
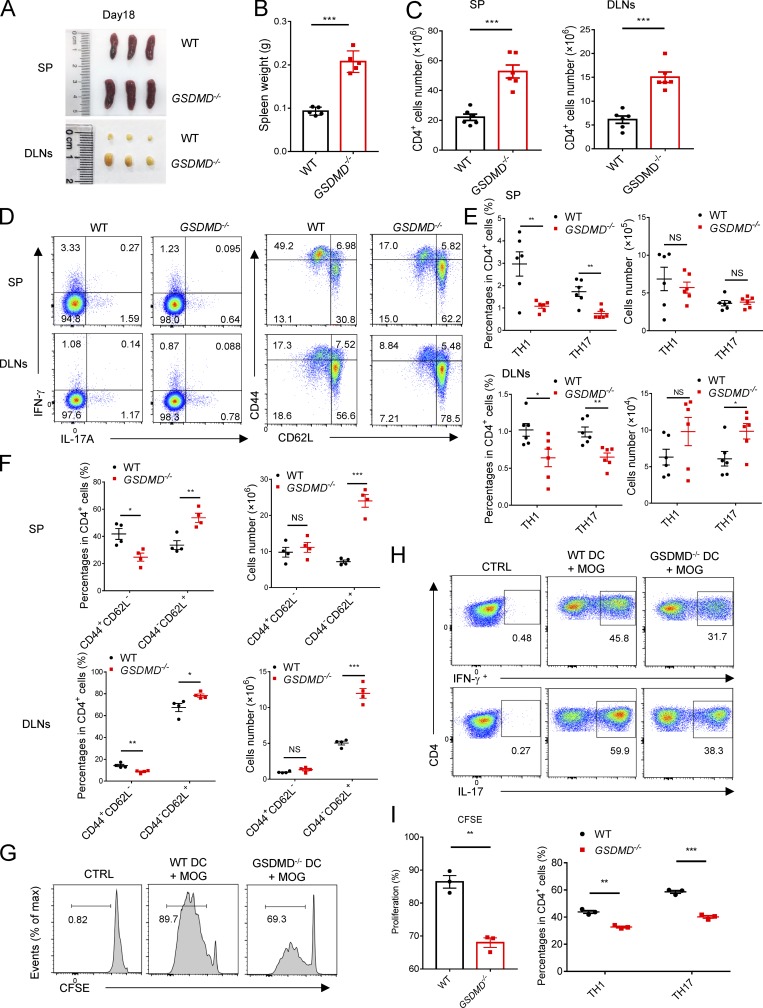
The NLRP3 inflammasome is critical for EAE pathogenesis; however, the role of gasdermin D (GSDMD), a newly identified pyroptosis executioner downstream of NLRP3 inflammasome, in EAE has not been well defined. Here, we observed that the levels of GSDMD protein were greatly enhanced in the CNS of EAE mice, especially near the areas surrounding blood vessels. GSDMD was required for the pathogenesis of EAE, and GSDMD deficiency in peripheral myeloid cells impaired the infiltration of immune cells into the CNS, leading to the suppression of neuroinflammation and demyelination. Furthermore, the loss of GSDMD reduced the activation and differentiation of T cell in the secondary lymphoid organs and prevented T cell infiltration into CNS of EAE. The administration of inflammasome-related cytokines partially rescued the impairment of pathogenesis of EAE in GSDMD KO mice. Collectively, these findings provide the first demonstration of GSDMD in peripheral myeloid cells driving neuroinflammation during EAE pathogenesis.


Figures

None
Graphical abstract
Figure 1.
Figure 1.
GSDMD is strongly expressed and processed in CNS during EAE. (A) Immunoblot analysis of full-length (FL) and cleaved GSDMD, caspase-11 and caspase-1 in the spinal cords and spleen (SP) from three pairs of control (CTRL) or EAE-induced WT mice at day 18 after immunization. (B) Immunohistochemistry images showing GSDMD expression in the spinal cord of control or EAE-induced WT mice at day 18 after immunization. Scale bar, 100 µm. (C) Immunofluorescent labeling of CD31 (green), GSDMD (red), and DAPI (blue) demonstrates the angiogenesis and the distribution of GSDMD (indicated by arrows) in the lesion area of spinal cord of EAE-induced WT mice at day 18 after immunization. Scale bar, 100 µm. (D) Flow-cytometric analysis of caspase-1/11+PI+ cells from CD11b+ Ly6C+ cells infiltrated to the spinal cord and brain of CTRL and MOG35-55-immunized WT mice at day 18 after immunization (n = 3 mice per group). Data are presented as a representative plot (left) and quantified percentages (right). Data are representative of three independent experiments. ***, P < 0.001. Error bars show means ± SEM. Unpaired t test for D.
Figure 2.
Figure 2.
GSDMD-deficient mice are resistant to EAE pathogenesis and neuroinflammation. (A) Mean clinical scores of age-matched female WT and GSDMD−/− mice subjected to MOG35-55-induced EAE (n = 10 mice per group); immunoblot analysis of GSDMD expression in spleen from indicated mice. (B) H&E staining and LFB staining of spinal cord sections from EAE-induced WT and GSDMD−/− mice showing inflammatory cell infiltration and demyelination, respectively (arrowheads). Scale bar, 500 µm. (C) Immunofluorescent labeling of MBP (red) and DAPI (blue) visualizing the impairment of myelination (arrowheads) of EAE-induced WT and GSDMD−/− mice, respectively. Scale bar, 100 µm. (D) Immunohistochemistry analysis for infiltrating CD4+ T cells in the spinal cord of EAE-induced WT and GSDMD−/− mice (representative images on left and quantified cell numbers on right, n = 3 mice per group), respectively. Scale bar, 100 µm. (E and F) Flow-cytometric analysis of immune cells (including CD45+CD4+ T cells, CD45+CD8+ T cells, and CD45+CD11b+ monocytes) infiltrated to the spinal cord and brain of MOG35-55-immunized WT and GSDMD−/− mice at day 18 after immunization (n = 7 for WTs, n = 8 for GSDMD−/− mice). Data are presented as a representative plot (E) and summary graph of the absolute cell numbers (F). (G and H) Flow-cytometric analysis of Th1 (IFN-γ+) and Th17 (IL-17A+) cells from CD4+ T cells infiltrated to the spinal cord and brain of MOG35-55-immunized WT and GSDMD−/− mice at day 18 after immunization (n = 7 mice per group). Data are presented as a representative plot (G), quantified percentage, and absolute cell numbers (H). Data are pooled from three independent experiments. *, P < 0.05; **, P < 0.01; ***, P < 0.001. Error bars show means ± SEM. Unpaired t test for A, D, and H, and multiple unpaired t test for F.
Figure 3.
Figure 3.
GSDMD deletion in peripheral cells attenuates the development of EAE. (A) Immunoblot analysis of the protein expression of GSDMD in different tissues (heart, liver, kidney, lung, mesenteric LNs [mLN], spleen, small intestine, colon, cortex, midbrain and cerebellum) from WT mice. (B) Immunoblot analysis of the protein expression of GSDMD in peripheral cells (BMDMs, bone marrow–derived DCs [BMDCs], and T cells) and CNS resident cells (microglia, astrocyte, oligodendrocyte progenitor cell [OPC], and neuron) from WT mice. (C) Mean clinical scores after EAE induction and summary graph of CNS-infiltrating immune cells at day 18 after immunization in WT and GSDMD−/− mice (n = 6 mice per group) adoptively transferred with WT bone marrow cells. (D) Mean clinical scores after EAE induction and summary graph of CNS-infiltrating immune cells at day 18 after immunization in WT mice (n = 5 or 6 mice per group) adoptively transferred with WT or GSDMD−/− bone marrow cells. (E) Representative plot from flow-cytometric analysis of immune cells infiltrated to the CNS (spinal cord and brain) of the mice in D. (F) H&E staining and LFB staining of spinal cord sections harvested from WT mice adoptively transferred with WT or GSDMD−/− bone marrow cells showing inflammatory cell infiltration and demyelination, respectively (arrows). Scale bar, 200 µm. (G) Quantitative PCR analysis of the relative mRNA expression of proinflammatory cytokines and chemokines in the spinal cord of WT mice (n = 4 mice per group) adoptively transferred with WT or GSDMD−/− bone marrow cells at the EAE peak. Data were normalized to a reference gene, Hprt. (H) Mean clinical scores after EAE induction and summary graph of CNS-infiltrating immune cells at day 18 after immunization in GSDMDfl/flCD4-Cre and littermate control GSDMDfl/fl mice (n = 4 or 5 mice per group). (I) Mean clinical scores after EAE induction and summary graph of CNS-infiltrating immune cells at day 18 after immunization in GSDMDfl/flCx3cr1-CreERT2 and Cx3cr1-CreERT2 mice (n = 4 or 5 mice per group). (J) Immunoblot analysis of GSDMD expression in T cells from indicated mice, and in microglia and BMDMs from indicated mice at 6 wk after administration of tamoxifen. Data are pooled from three independent experiments. *, P < 0.05; **, P < 0.01; ***, P < 0.001. Error bars show means ± SEM. Unpaired t test for C, D, H, and I, and multiple unpaired t test for C, D, and G–I.
Figure 4.
Figure 4.
The differentiation and egress of T cells in peripheral lymphoid organs during EAE are impaired in GSDMD−/− mice. (A and B) Spleens and DLNs harvested from three pairs of WTs and GSDMD−/− mice at day 18 after EAE induction (A) and quantified spleen (SP) weights (n = 5 mice per group; B). (C) Quantified absolute cell numbers of CD4+ T cells in spleen and DLNs from WTs and GSDMD−/− mice at day 18 after EAE induction (n = 6 mice per group). (D–F) Flow-cytometric analysis of Th1 (IFN-γ+) and Th17 (IL-17A+) cells from CD4+ T cells in the spleen and DLNs of WT and GSDMD−/− mice (n = 6 mice per group) at day 18 after EAE induction, and effective T cell (CD44+CD62L) and naive T cell (CD44CD62L+) cells from CD4+ T cells in the spleen and DLNs of WT and GSDMD−/− mice (n = 4 mice per group) at day 18 after EAE induction. Data are presented as a representative plot (D), and quantified percentages and absolute cell numbers (E and F). (G–I) Flow-cytometric analysis of CFSE-labeled cells, Th1 (IFN-γ+) cells, and Th17 (IL-17A+) cells from CD4+ T cells at day 5 after in vitro cocultured with DCs (n = 3 per group). Data are presented as a representative plot (G and H) and quantified percentages (I). Data are pooled from three independent experiments (A–E) or from two independent experiments (F–I). *, P < 0.05; **, P < 0.01; ***, P < 0.001. Error bars show means ± SEM. Unpaired t test for B, C, and I, and multiple unpaired t test for E, F, and I. CTRL, control; max, maximum.
Figure 5.
Figure 5.
Myeloid cells in peripheral lymphoid organs during EAE are impaired in GSDMD−/− mice. (A) Flow-cytometric analysis of macrophages (Ma; CD11b+F4/80+), neutrophils (Neu; CD11b+Gr-1+), DCs (CD11c+, including cDCs [CD11c+B220] and pDCs [CD11c+B220+]), and MHCII-expressing cells (CD11b+MHCII+ and CD11c+MHCII+) in the spleen (SP) of WT and GSDMD−/− mice (n = 4 mice per group) at day 18 after EAE induction. Data are presented as a representative plot, quantified percentages, and absolute cell numbers. (B) Flow-cytometric analysis of NK cells (NK1.1+) and B cells (CD19+) in the spleen of WT and GSDMD−/− mice (n = 4 mice per group) at day 18 after EAE induction. Data are presented as a representative plot, quantified percentages, and absolute cell numbers. Data are pooled from two independent experiments. *, P < 0.05; **, P < 0.01; ***, P < 0.001. Error bars show means ± SEM. Multiple unpaired t test for A and B. SSC-A, side scatter–area.
Figure 6.
Figure 6.
GSDMD deficiency attenuates the expression of genes required for T cell response in CD11b+ cell and CD4+ T cell of peripheral lymphoid organs during EAE. (A and B) KEGG analysis shows the most significantly enriched signaling pathways in CD11b+ macrophages (A) and CD4+ T cells (B) sorted from spleens of WT and GSDMD−/− mice at day 12 after EAE induction. (C) The heatmaps of genes with adjusted P value <0.05, false discovery rate <0.05, and log2 fold-change >1.2 from RNA-seq analysis of CD11b+ myeloid cells and CD4+ T cells isolated from spleens of three pairs of WTs and GSDMD−/− mice at day 12 after EAE induction. (D) Quantitative PCR analysis of the indicated genes in CD11b+ myeloid cells and CD4+ T cells sorted from spleens in C (n = 3 mice per group). Data were normalized to a reference gene, Hprt. (E and F) Flow-cytometric analysis of CD3e+, Cxcr6+, TNFα+, and Ccl5+ cells from Th1 and Th17 cells in the spleen of WT and GSDMD−/− mice (n = 4 mice per group) at day 18 after EAE induction. Data are presented as a representative plot (E) and quantified percentages (F). Data are pooled from three independent experiments (E and F). *, P < 0.05; **, P < 0.01; ***, P < 0.001. Error bars show means ± SEM. Two-way ANOVA with Sidak’s multiple comparisons test for D. Multiple unpaired t test for F.
Figure 7.
Figure 7.
GSDMD in peripheral myeloid cells is essential for the activation of CD4+ T Cells during EAE. (A) Schematic representation of the experiments in B, C, and Fig. 8 G. CD4+ T cells were obtained from spleens of WT or GSDMD−/− mice at day 12 after EAE induction, then transferred into Rag1−/− mice by i.v. injection or into WT mice by i.c.v. injection. DLN cells were obtained from WT or GSDMD−/− mice at day 12 after EAE induction, then cultured in vitro with MOG35-55 and IL-23 under Th17 cell–polarizing conditions before transfer into sublethal irradiated WTs or GSDMDfl/fl and GSDMDfl/flLysM-Cre mice, respectively. (B and C) Mean clinical scores after CD4 T cell and Th17 cell transfer by i.v. (B) and CD4 T cell transfer by i.c.v. (C; n = 5 mice per group). (D) Mean clinical scores after EAE induction in GSDMDfl/flLysM-Cre and littermate control GSDMDfl/fl mice (n = 5 mice per group); immunoblot analysis of GSDMD expression in BMDMs from indicated mice. (E) Summary graph of CNS-infiltrating immune cells at day 18 after immunization in GSDMDfl/flLysM-Cre and littermate GSDMDfl/fl mice (n = 5 mice per group). (F) Flow-cytometric analysis of KI67+ cells among CD4+ T cells in the CNS and spleens (SP) of GSDMDfl/flLysM-Cre and littermate GSDMDfl/fl mice at day 18 after immunization (n = 5 mice per group). (G) Immunofluorescent labeling of CD3 (red) and KI67 (green) demonstrate the proliferation of T cells in the spinal cord of indicated mice at day 18 after immunization. Data are presented as a representative image (left) and quantified percentage (right). Scale bar, 50 µm. (H) Quantified absolute cell numbers of CD4+ T cell in spleen and DLNs from GSDMDfl/flLysM-Cre and littermate control GSDMDfl/fl mice at day 18 after EAE induction (n = 4 mice per group). Data are pooled from three independent experiments (A–G) or from two independent experiments (H). *, P < 0.05; **, P < 0.01; ***, P < 0.001. Error bars show means ± SEM. Unpaired t test for B–D and F–H, and multiple unpaired t test for E.
Figure 8.
Figure 8.
GSDMD in peripheral myeloid cells is essential for T cell priming by myeloid cells during EAE. (A–C) Flow-cytometric analysis of Th1 (IFN-γ+) and Th17 (IL-17A+) cells, effective T cells (CD44+CD62L), and naive T cells (CD44CD62L+) from CD4+ T cells in the spleen (SP) and DLNs of GSDMDfl/flLysM-Cre and littermate control GSDMDfl/fl mice (n = 4 mice per group) at day 18 after EAE induction. Data are presented as a representative plot (A), and quantified percentages and absolute cell numbers (B and C). (D and E) Flow-cytometric analysis of macrophages (Ma; CD11b+F4/80+), neutrophils (Neu; CD11b+Gr-1+), DCs (CD11c+, including cDCs [CD11c+B220] and pDCs [CD11c+B220+]), and MHCII-expressing cells (CD11b+MHCII+ and CD11c+MHCII+) in the spleen of GSDMDfl/flLysM-Cre and littermate control GSDMDfl/fl mice (n = 4 mice per group) at day 18 after EAE induction. Data are presented as a representative plot (D), and quantified percentages and absolute cell numbers (D and E). (F) Flow-cytometric analysis of NK cells (NK1.1+) and B cells (CD19+) in the spleen of GSDMDfl/fl and GSDMDfl/flLysM-Cre mice (n = 4 mice per group) at day 18 after EAE induction. Data are presented as a representative plot, quantified percentages and absolute cell numbers. (G) Mean clinical scores after Th17-cell transferring by i.v. to indicated mice (n = 5 mice per group). Data are pooled from two independent experiments. *, P < 0.05; **, P < 0.01; ***, P < 0.001. Error bars show means ± SEM. Unpaired t test for G and multiple unpaired t test for B, C, E, and F. SSC-A, side scatter–area.
Figure 9.
Figure 9.
Pharmacological inhibition of GSDMD attenuates EAE, and inflammasome-related cytokines promote EAE pathogenesis in GSDMD-deficient mice. (A) Mean clinical scores of WT mice injected (i.p.) with disulfiram or PBS daily after EAE induction, respectively (n = 5 mice per group). (B and C) Representative images (B) and histological scores (C) of H&E staining and LFB staining of spinal cord sections from mice in A. Inflammatory cell infiltration and demyelination indicated by arrow. Scale bar, 200 µm. (D) Mean clinical scores of WTs and GSDMD−/− mice which were i.v. injected with rIL-1β and rIL-18 combination or PBS at day 4, 8, 12, and 16 after EAE induction, respectively (n = 5 mice per group). (E and F) Representative images (E) and histological scores (F) of H&E staining and LFB staining of spinal cord sections from mice in D. Inflammatory cell infiltration and demyelination indicated by arrow. Scale bars, 200 µm. Histological scores in C and F: 0, no inflammatory cell infiltration and no demyelination; 1, slight inflammatory cell infiltration or demyelination observed; 2, moderate inflammatory cell infiltration or demyelination in several spots; 3, substantial inflammatory cell infiltration and large area of demyelination. Data are pooled from three independent experiments (D–F) or from two independent experiments (A–C). *, P < 0.05; **, P < 0.01. Error bars show means ± SEM. Unpaired t test for A, C, D, and F.
Figure 10.
Figure 10.
Model for GSDMD function in EAE pathogenesis. During EAE development, peripheral myeloid cell–intrinsic GSDMD mediates pyroptosis to instigate inflammation and promote the activation and differentiation of T cells in the secondary lymphoid organs, thus driving T cell–mediated neuroinflammation and demyelination in the CNS of EAE.

References

    1. Banerjee I., Behl B., Mendonca M., Shrivastava G., Russo A.J., Menoret A., Ghosh A., Vella A.T., Vanaja S.K., Sarkar S.N., et al. . 2018. Gasdermin D Restrains Type I Interferon Response to Cytosolic DNA by Disrupting Ionic Homeostasis. Immunity. 49:413–426.e5. 10.1016/j.immuni.2018.07.006 - DOI - PMC - PubMed
    1. Bauer J., Huitinga I., Zhao W., Lassmann H., Hickey W.F., and Dijkstra C.D.. 1995. The role of macrophages, perivascular cells, and microglial cells in the pathogenesis of experimental autoimmune encephalomyelitis. Glia. 15:437–446. 10.1002/glia.440150407 - DOI - PubMed
    1. Bradl M., and Lassmann H.. 2010. Oligodendrocytes: biology and pathology. Acta Neuropathol. 119:37–53. 10.1007/s00401-009-0601-5 - DOI - PMC - PubMed
    1. Chastain E.M., Duncan D.S., Rodgers J.M., and Miller S.D.. 2011. The role of antigen presenting cells in multiple sclerosis. Biochim. Biophys. Acta. 1812:265–274. 10.1016/j.bbadis.2010.07.008 - DOI - PMC - PubMed
    1. Cheng W., and Chen G.. 2014. Chemokines and chemokine receptors in multiple sclerosis. Mediators Inflamm. 2014:659206 10.1155/2014/659206 - DOI - PMC - PubMed

Publication types

MeSH terms

Substances